Viral Suppression and Barriers to Care
Viral suppression is one of the six Ending the HIV Epidemic in the U.S. indicators. Viral suppression refers to the percentage of people with diagnosed HIV who have less than 200 copies of HIV per milliliter of blood.


* Among people aged 13 and older.
† At least 1 viral load or CD4 test.
‡ Had 2 viral load or CD4 tests at least 3 months apart in a year.
** Based on most recent viral load test.
Source: CDC. Monitoring selected national HIV prevention and care objectives by using HIV surveillance data—United States and 6 dependent areas, 2021. HIV Surveillance Supplemental Report 2023;28(4).

* Among people aged 13 and older.
† At least 1 viral load or CD4 test.
‡ Had 2 viral load or CD4 tests at least 3 months apart in a year.
** Based on most recent viral load test
Source: CDC. Monitoring selected national HIV prevention and care objectives by using HIV surveillance data—United States and 6 dependent areas, 2021. HIV Surveillance Supplemental Report 2023;28(4).
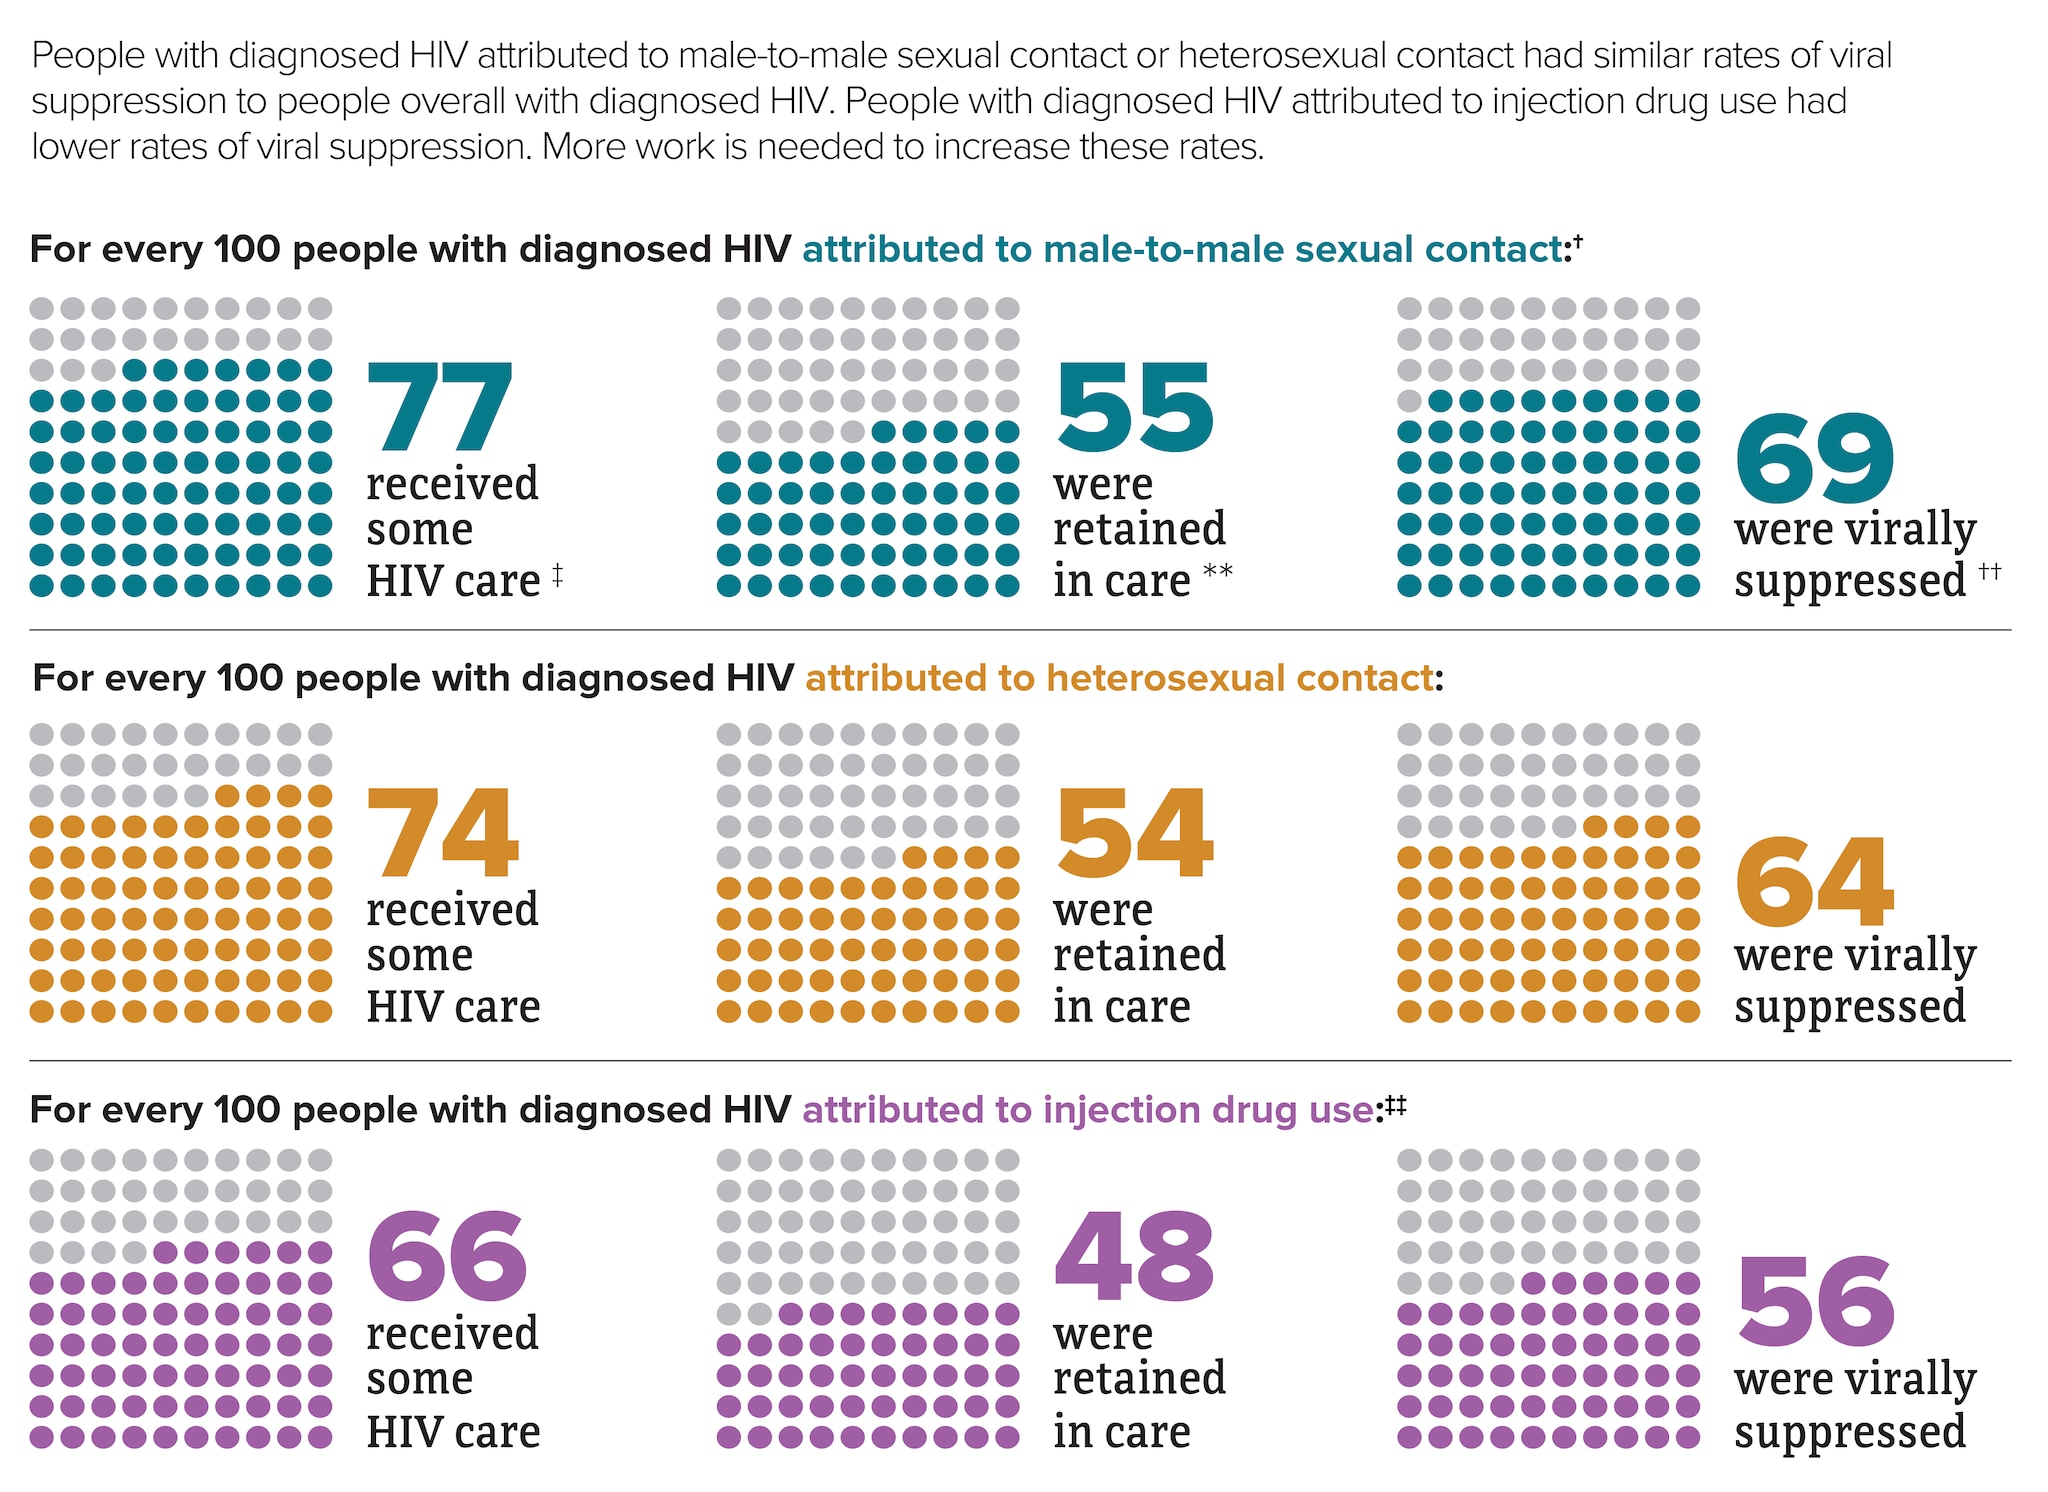
* Among people aged 13 and older.
† Includes infections attributed to male-to-male sexual contact only.
‡ At least 1 viral load or CD4 test.
** Had 2 viral load or CD4 tests at least 3 months apart in a year.
†† Based on most recent viral load test.
‡‡ Includes infections attributed to injection drug use only. For every 100 men with HIV attributed to male-to-male sexual contact and injection drug use, 78 received some HIV care, 56 were retained in care, and 65 were virally suppressed.
Source: CDC. Monitoring selected national HIV prevention and care objectives by using HIV surveillance data—United States and 6 dependent areas, 2021. HIV Surveillance Supplemental Report 2023;28(4).
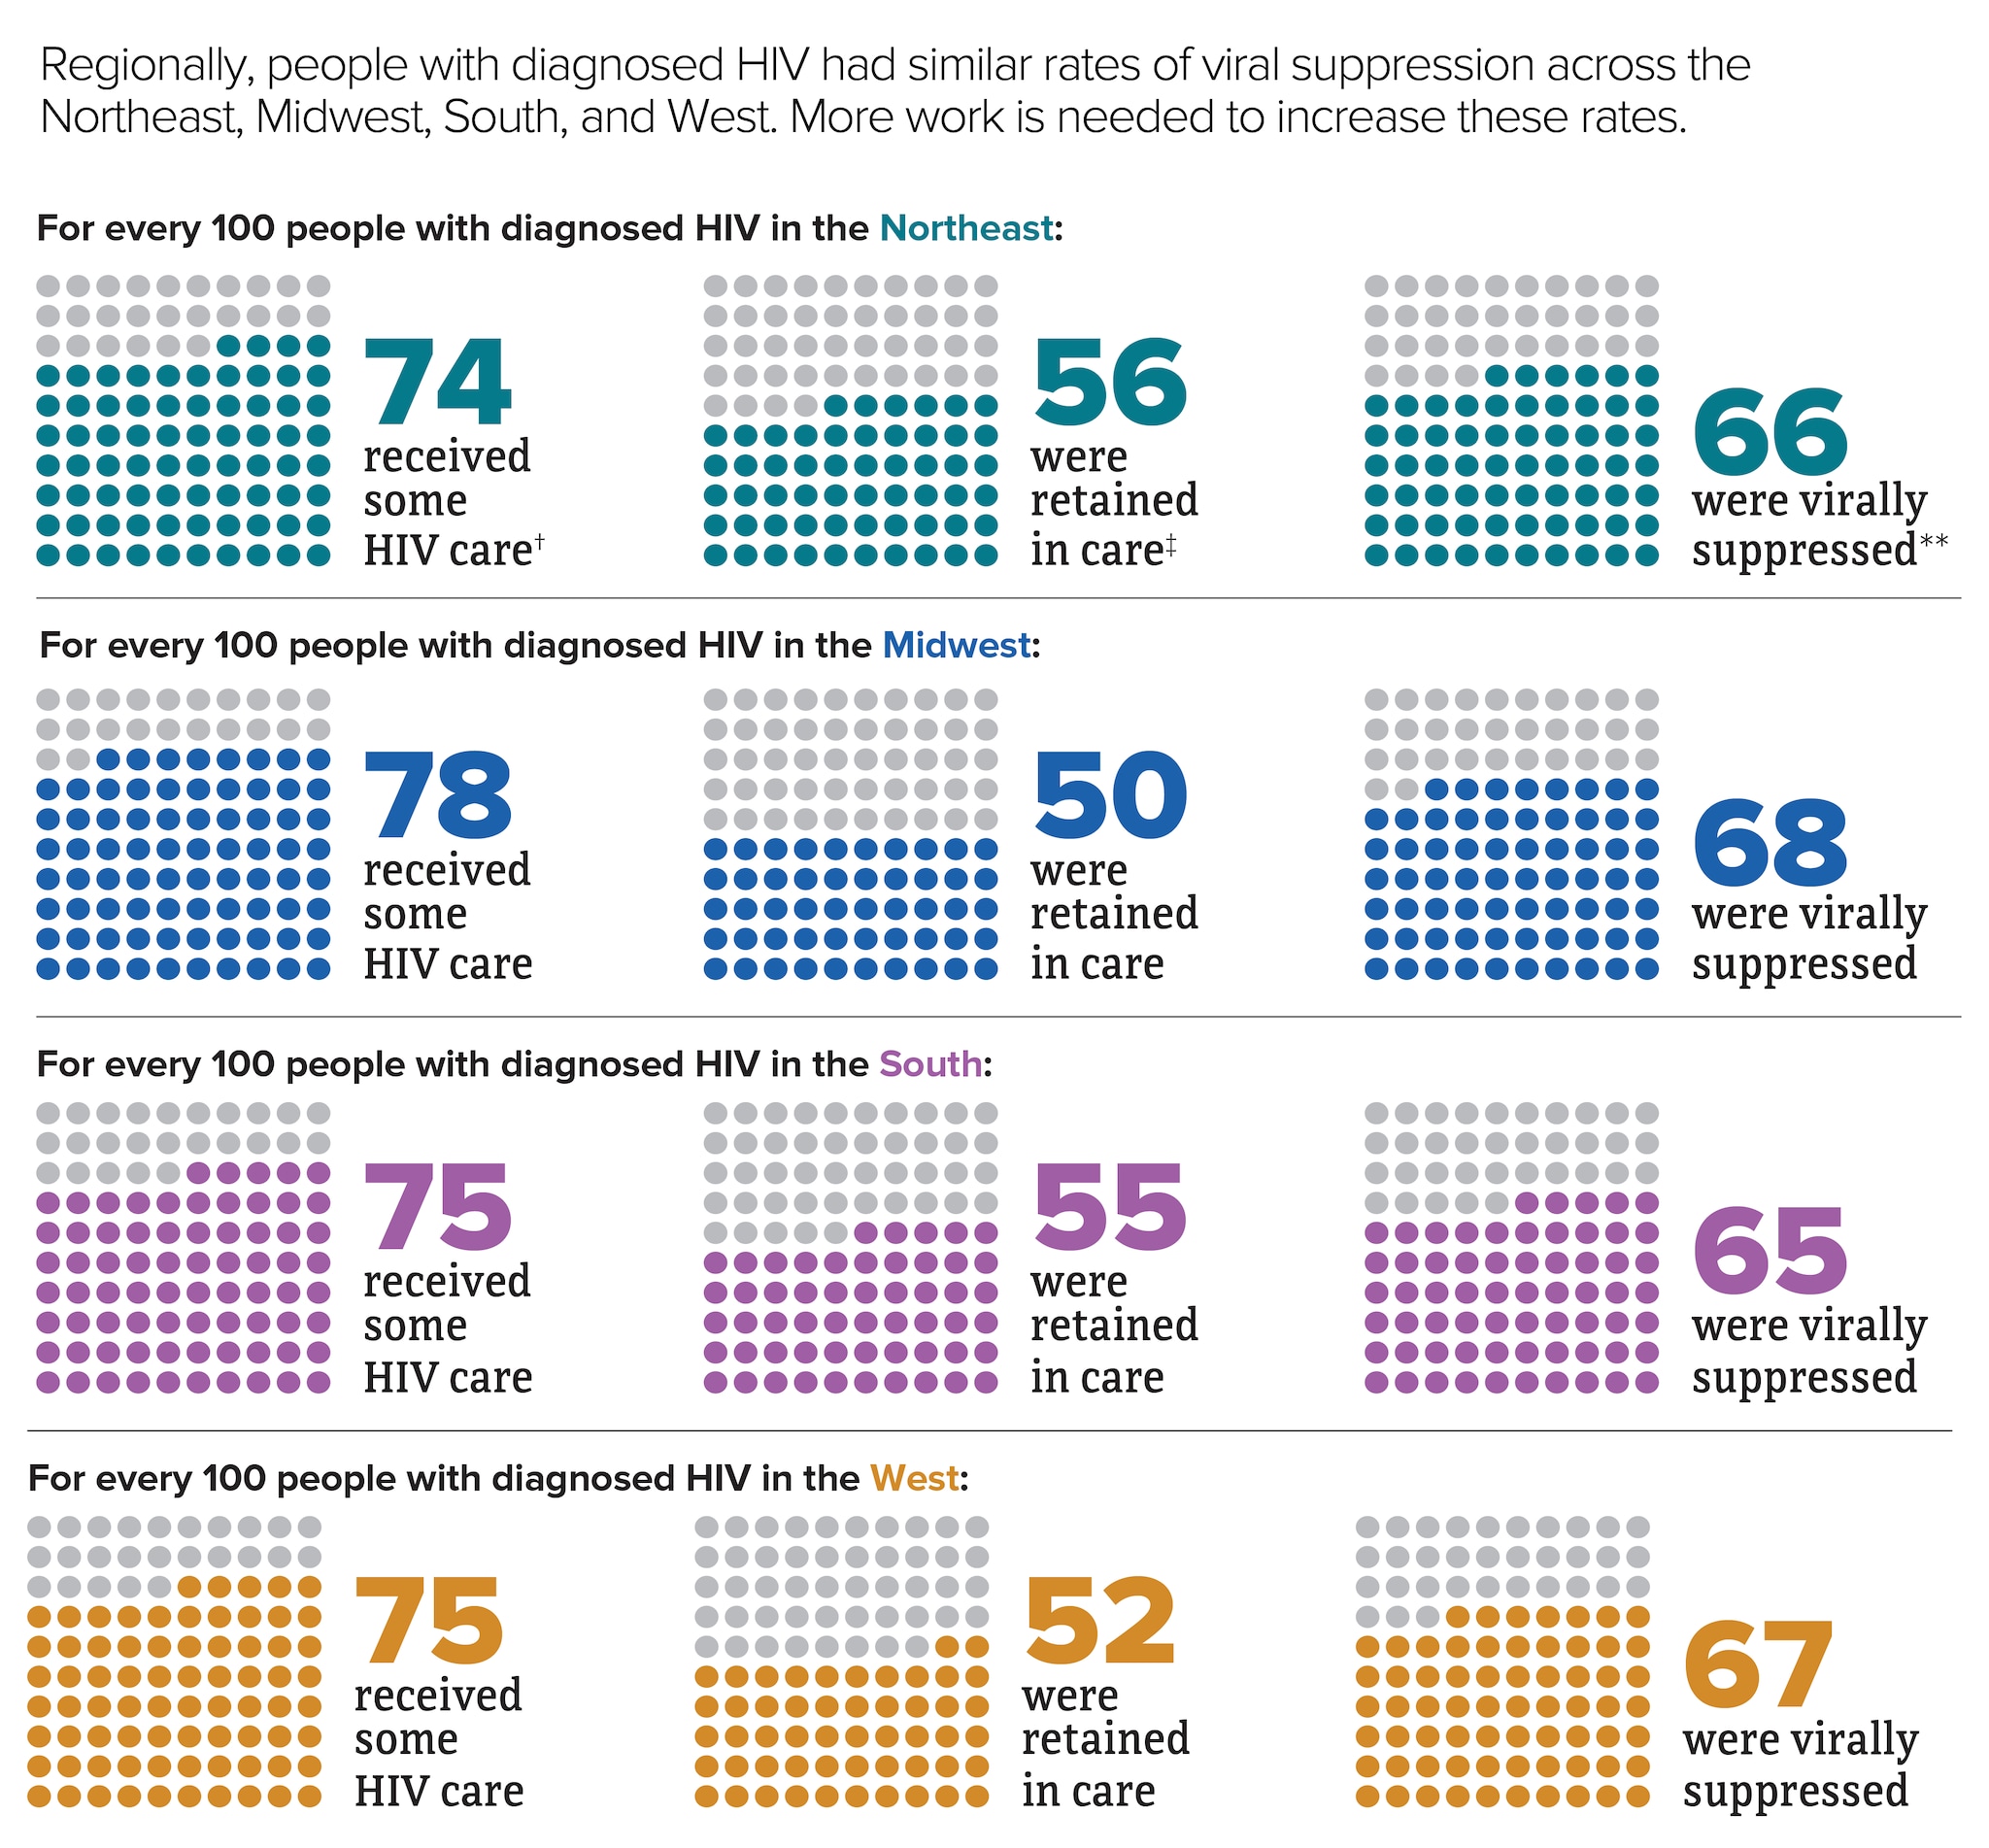
* Among people aged 13 and older.
† At least 1 viral load or CD4 test.
‡ Had 2 viral load or CD4 tests at least 3 months apart in a year.
** Based on most recent viral load test.
Source: CDC. Monitoring selected national HIV prevention and care objectives by using HIV surveillance data—United States and 6 dependent areas, 2021. HIV Surveillance Supplemental Report 2023;28(4).


Source: CDC. Diagnoses of HIV infection in the United States and dependent areas, 2021. HIV Surveillance Report 2023;34.
Barriers to Care
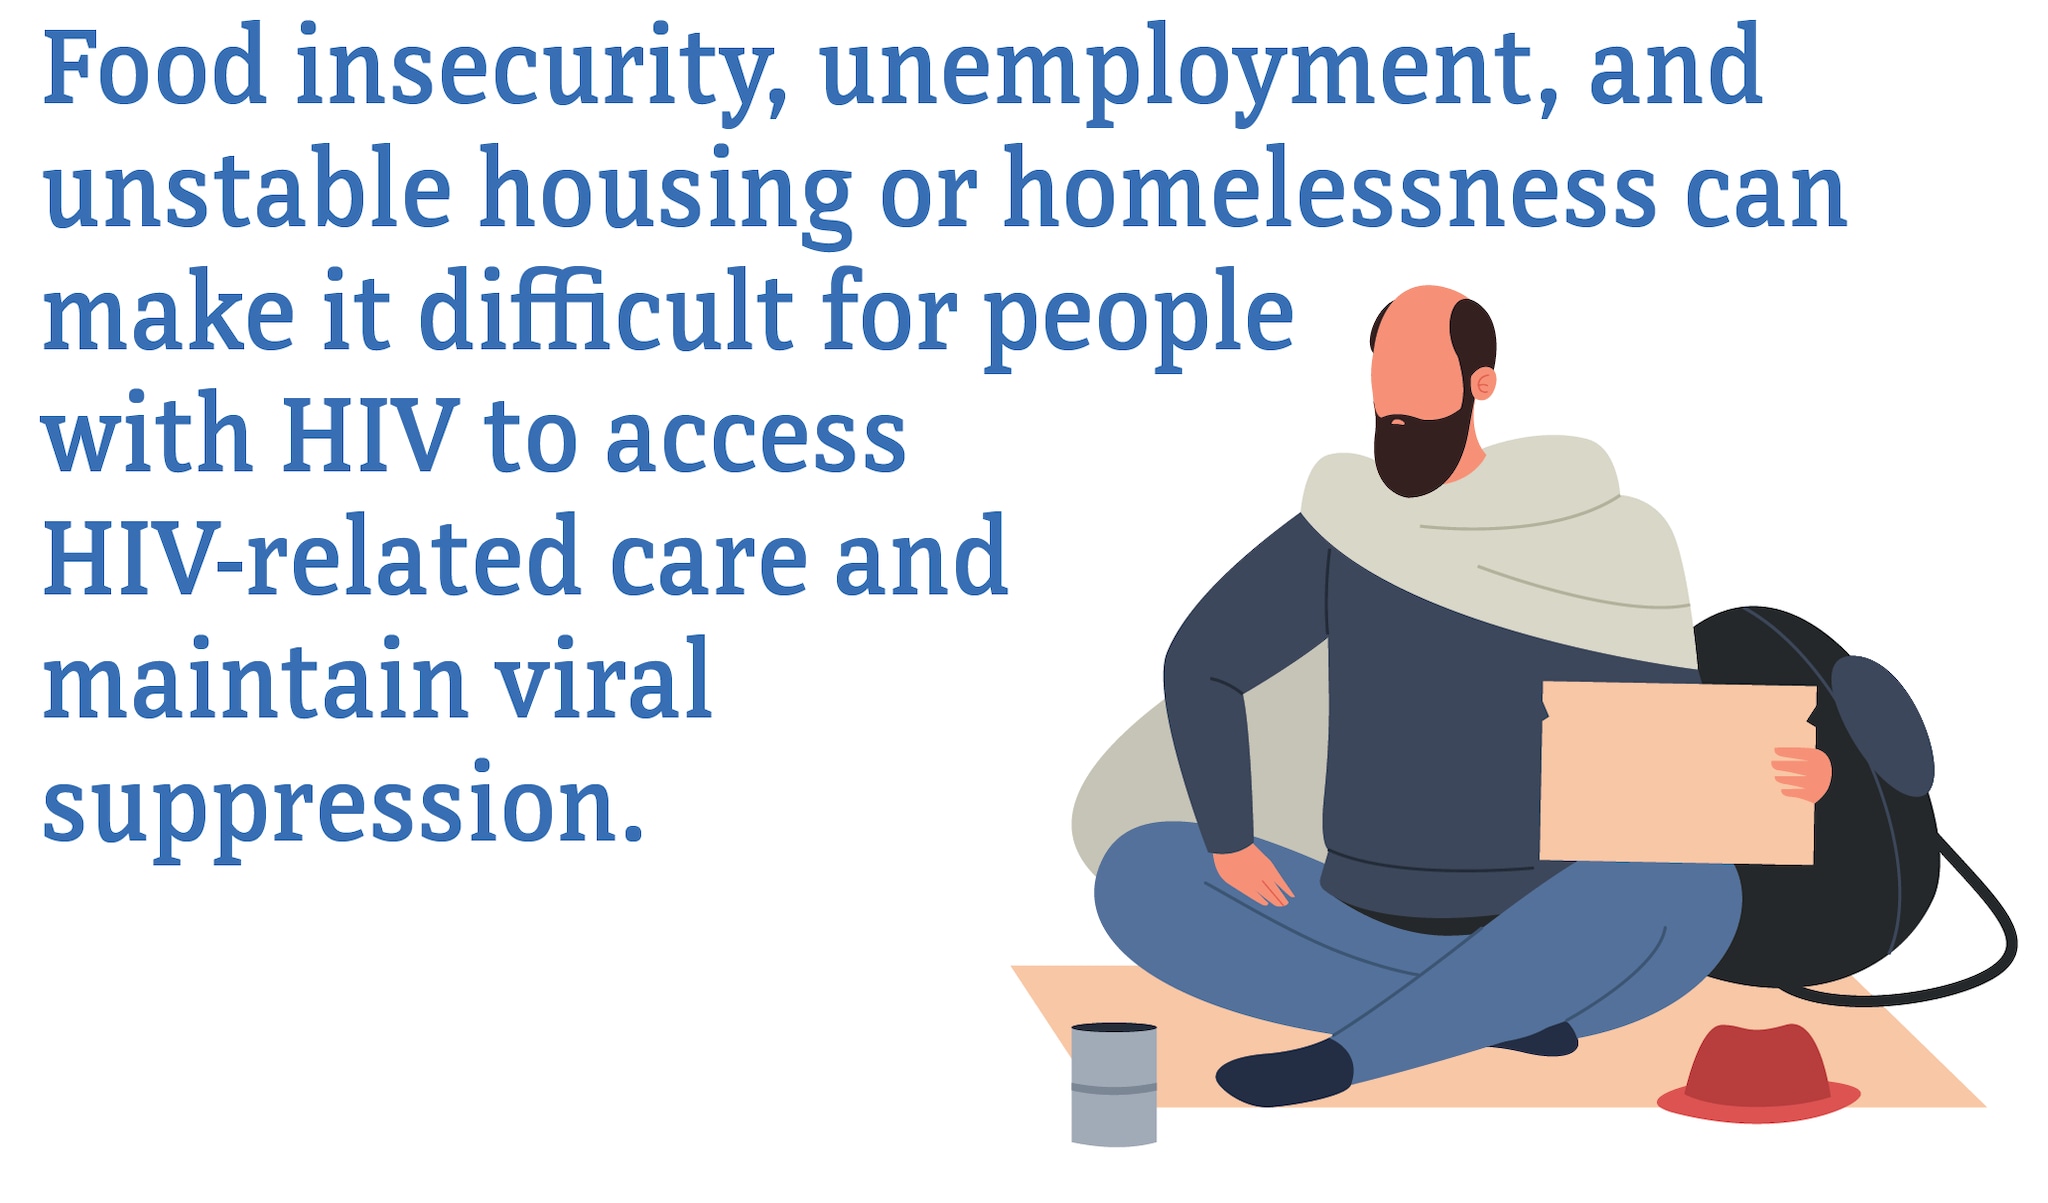
Although many people taking HIV medicine are virally suppressed, some people with HIV are currently not virally suppressed or do not maintain viral suppression over time. Some challenges with achieving and maintaining viral suppression include HIV stigma, physical health, mental health, and structural issues—such as food insecurity, unemployment, and unstable housing or homelessness.
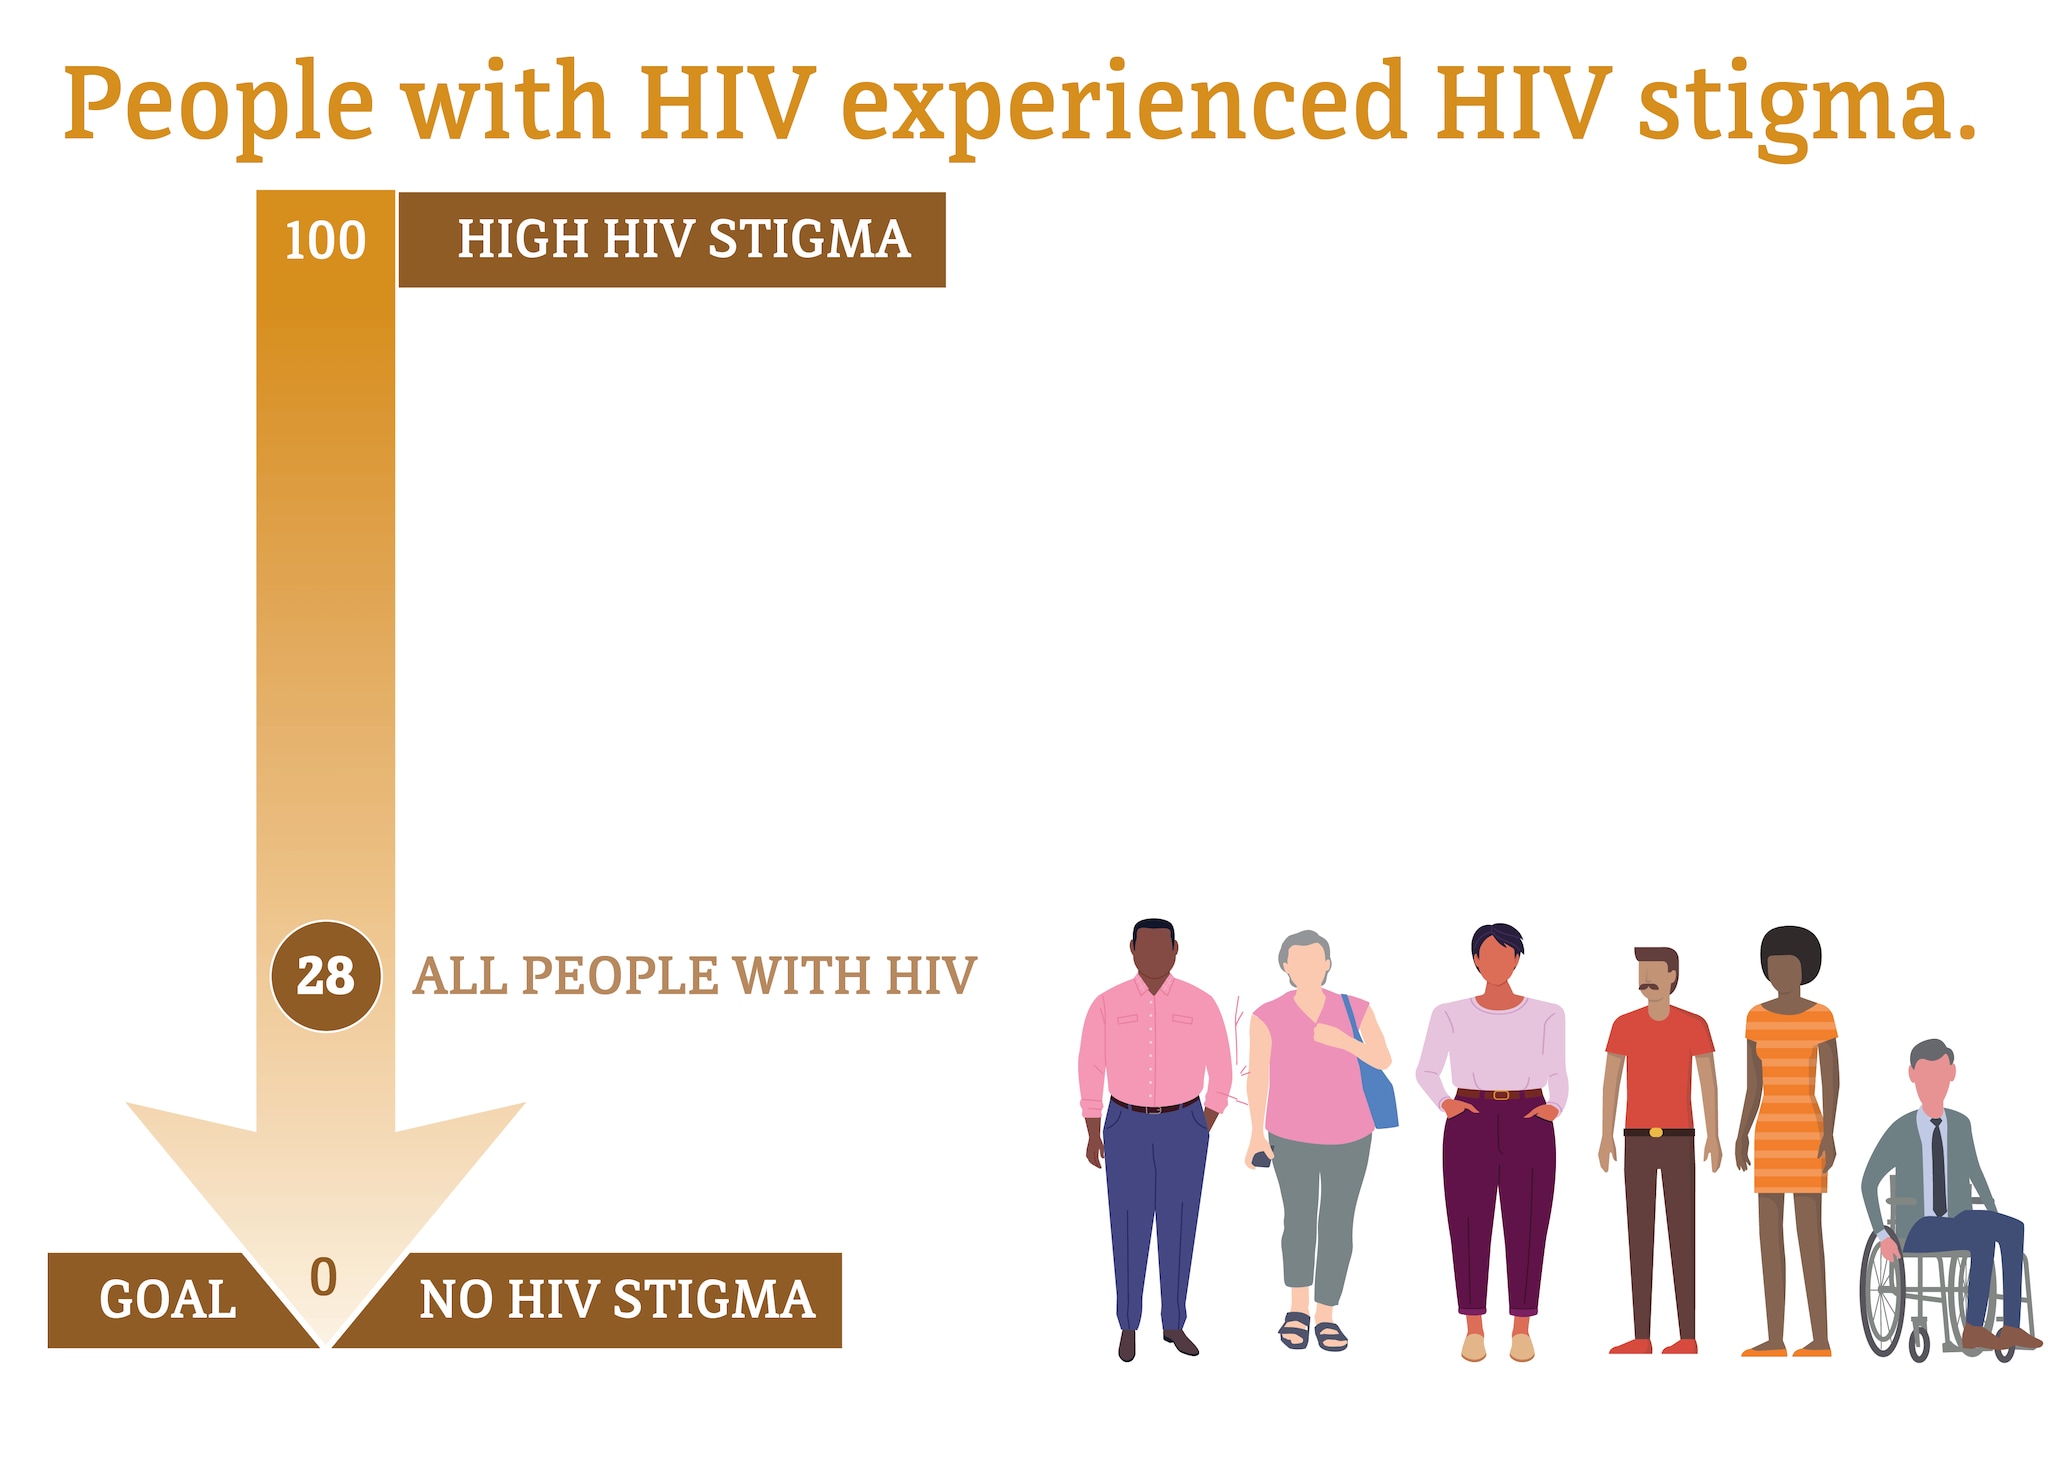
Median HIV stigma scores are presented based on a ten-item scale ranging from 0 (no stigma) to 100 (high stigma) that measures personalized stigma during the past 12 months, current disclosure concerns, current negative self-image, and current perceived public attitudes about people with HIV.
* Among people aged 18 and older.
Source: CDC. Behavioral and clinical characteristics of persons with diagnosed HIV infection—Medical Monitoring Project, United States 2020 cycle (June 2020–May 2021). HIV Surveillance Special Report 2022;29.
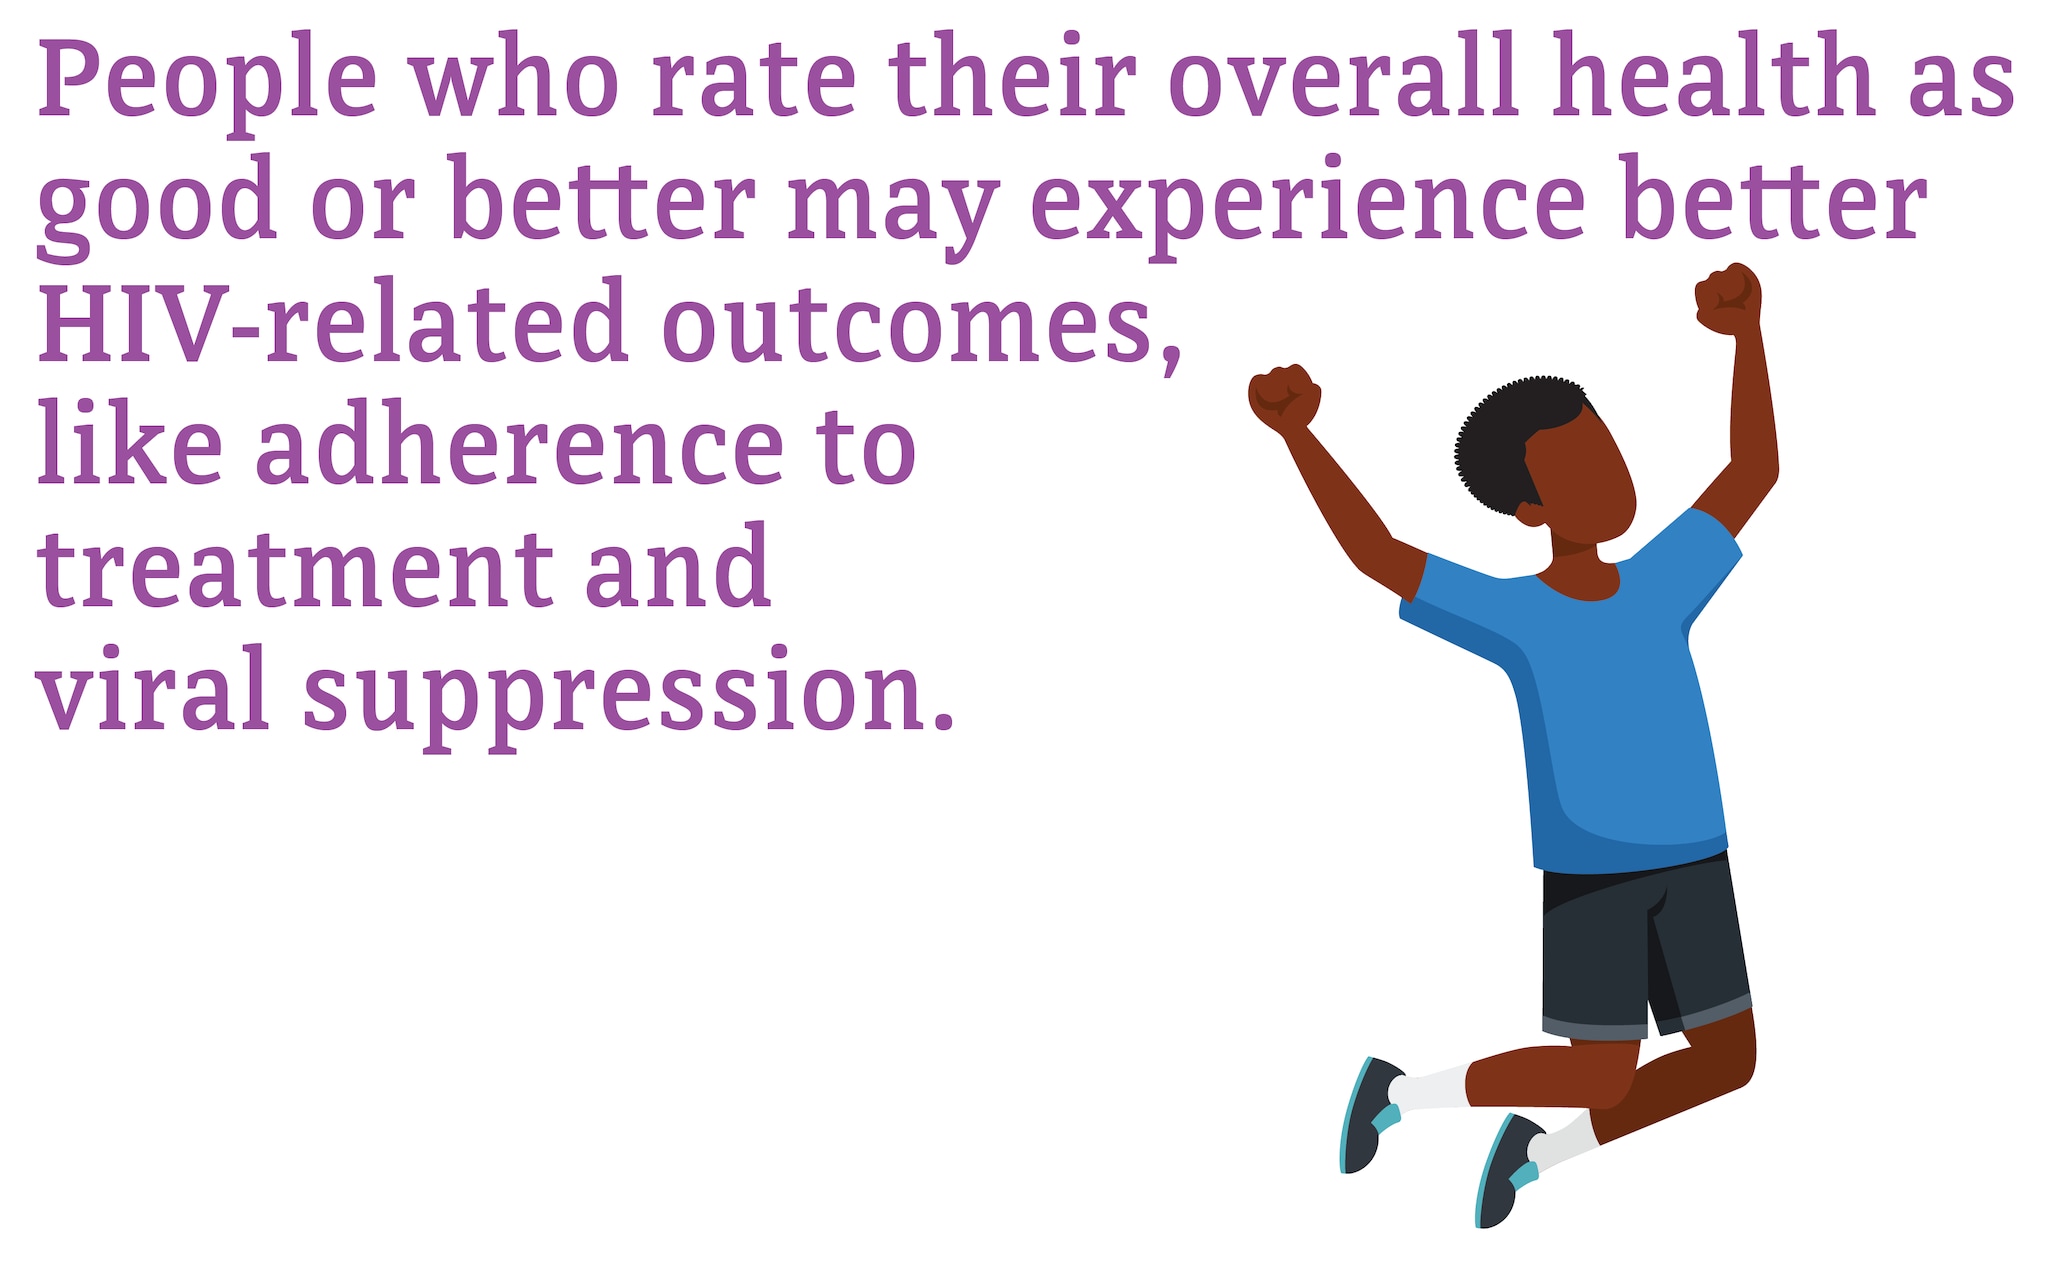
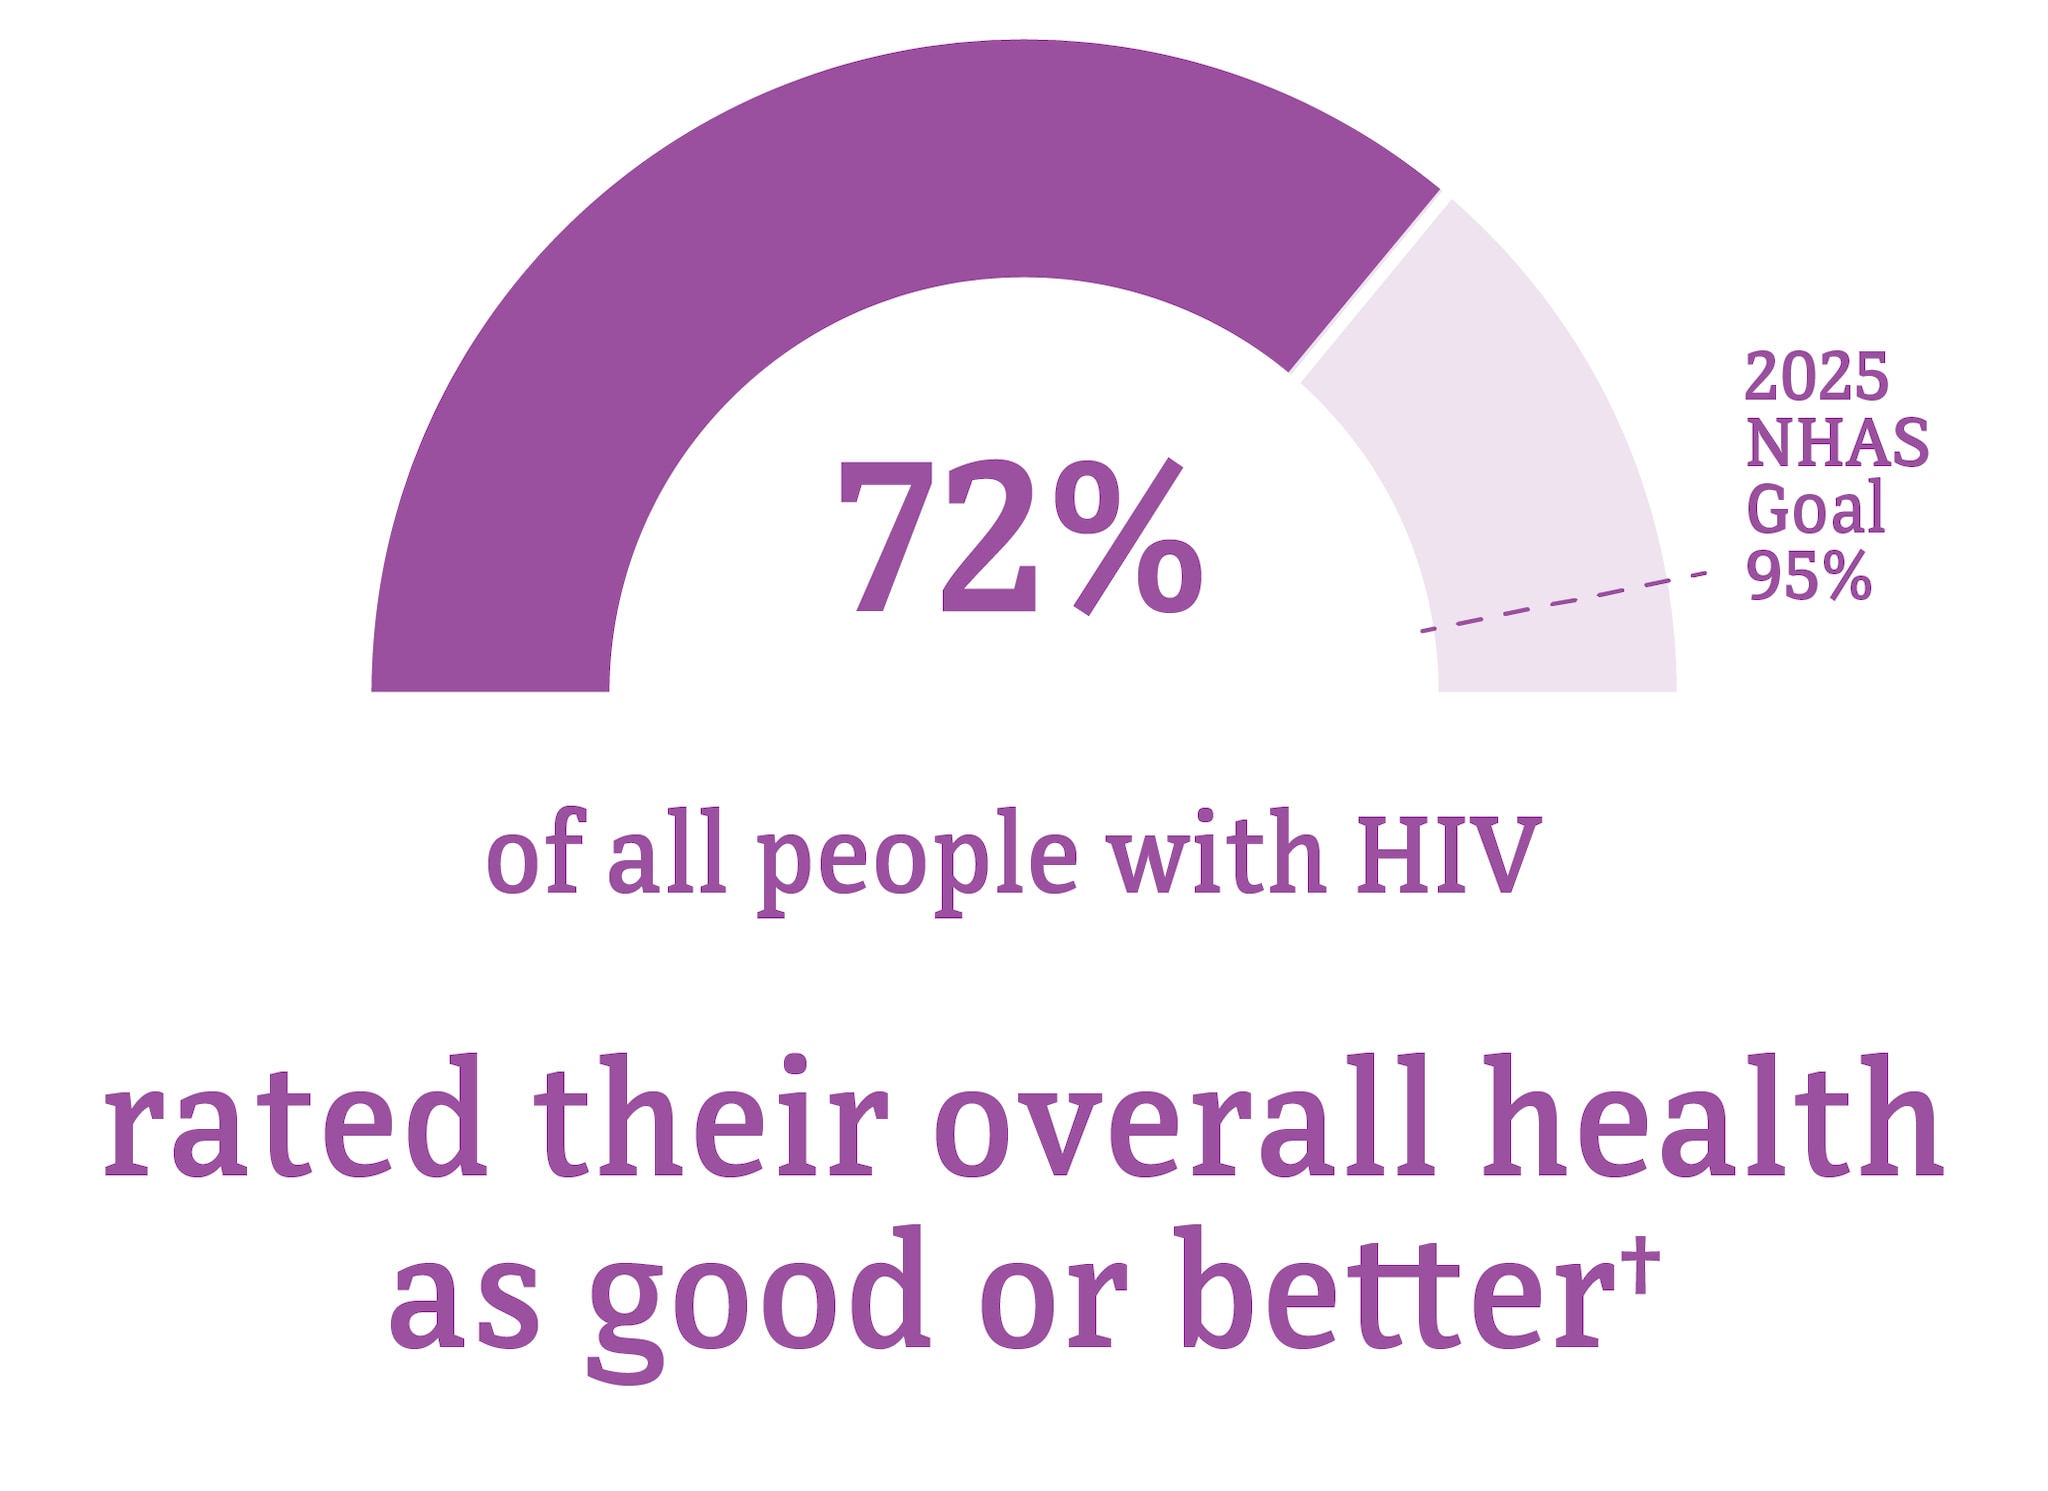
* Among people aged 18 and older.
† Good or better self-rated health is defined as rating one’s health as good, very good, or excellent (as opposed to poor or fair) at the time of interview.
Source: CDC. Quality of life and HIV stigma—Indicators for the National HIV/AIDS Strategy, 2022–2025, CDC Medical Monitoring Project, 2017–2020 sycles. HIV Surveillance Special Report 2022;30.
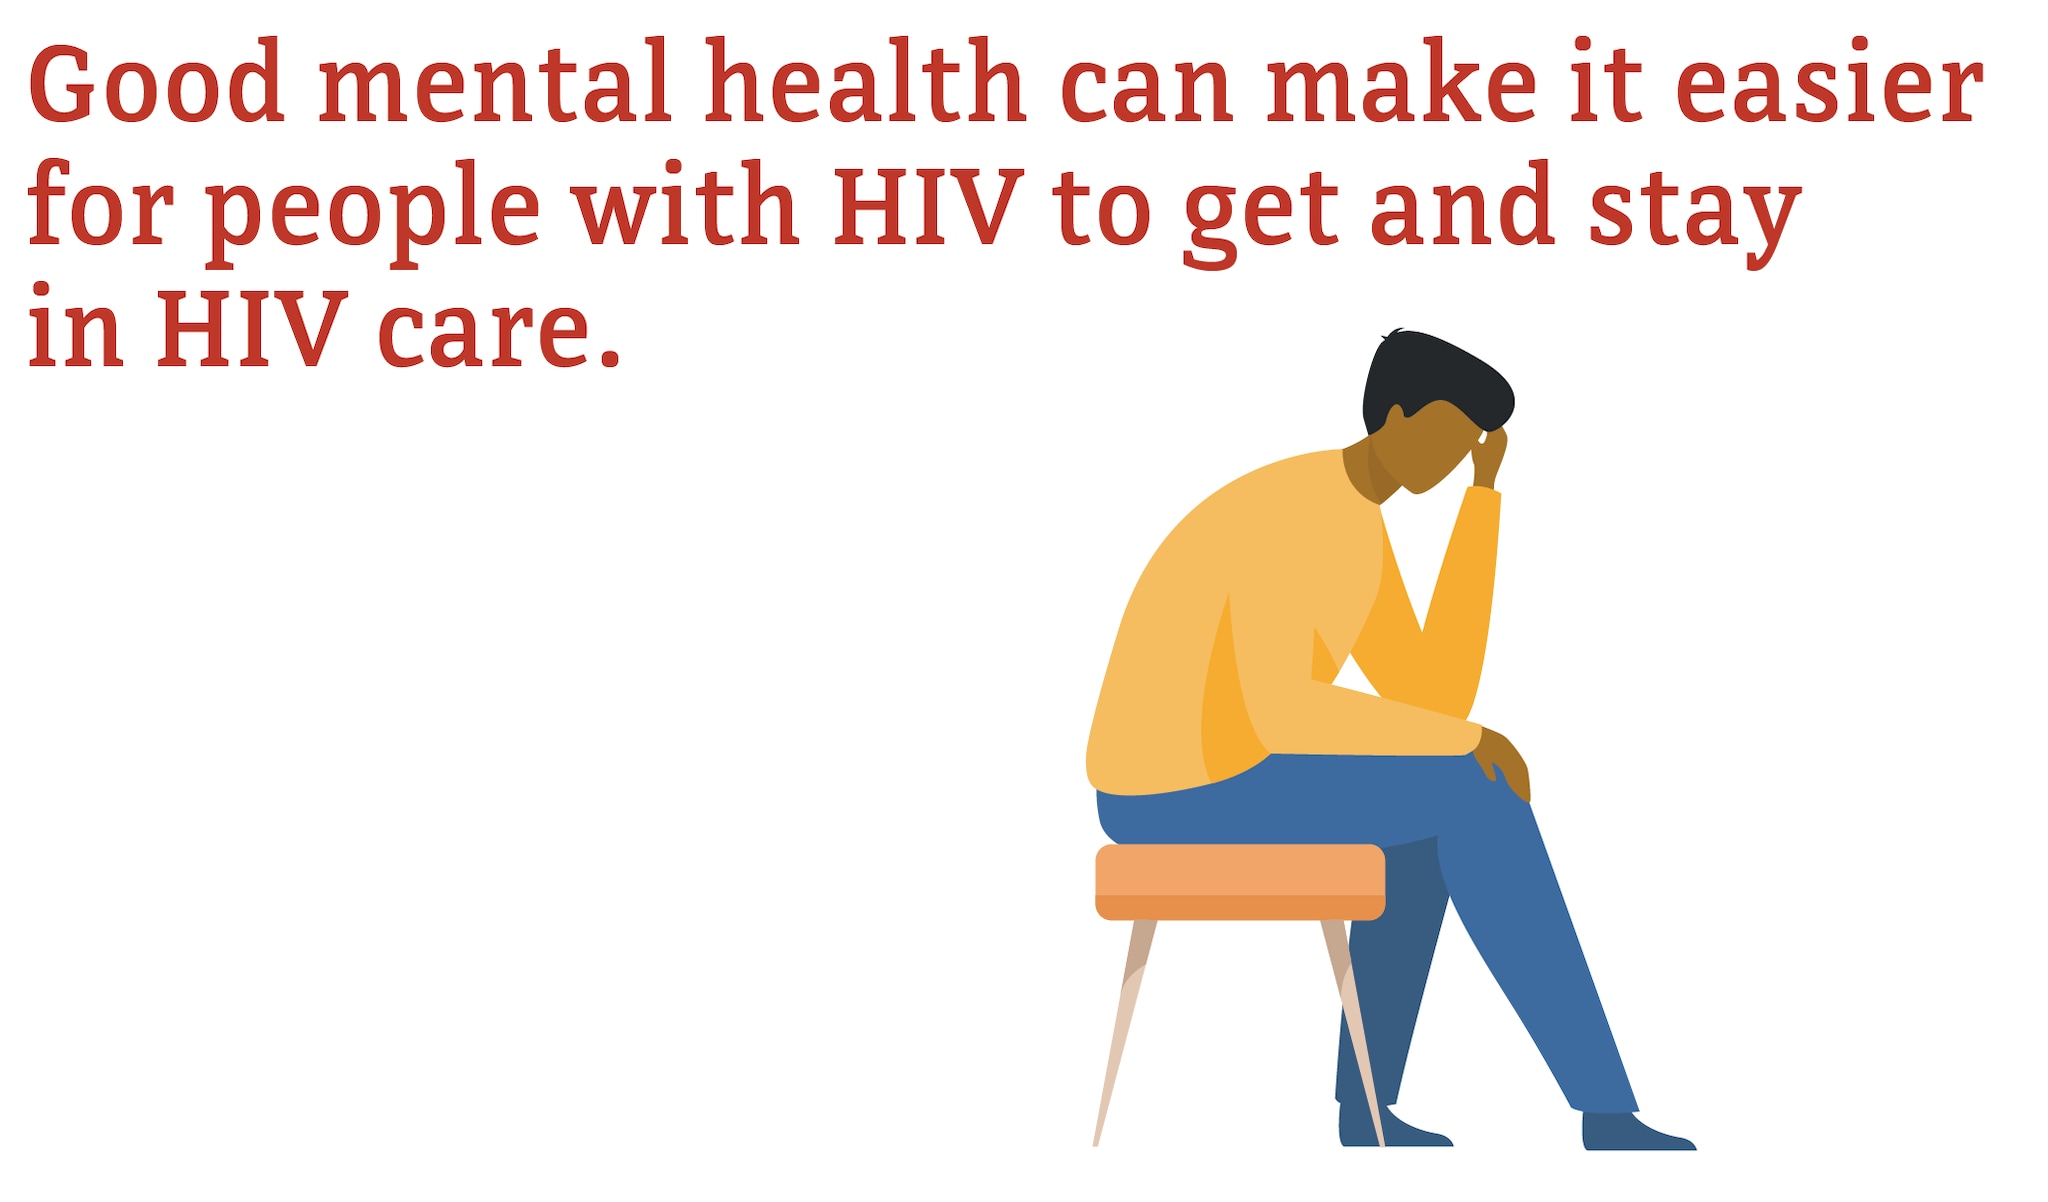
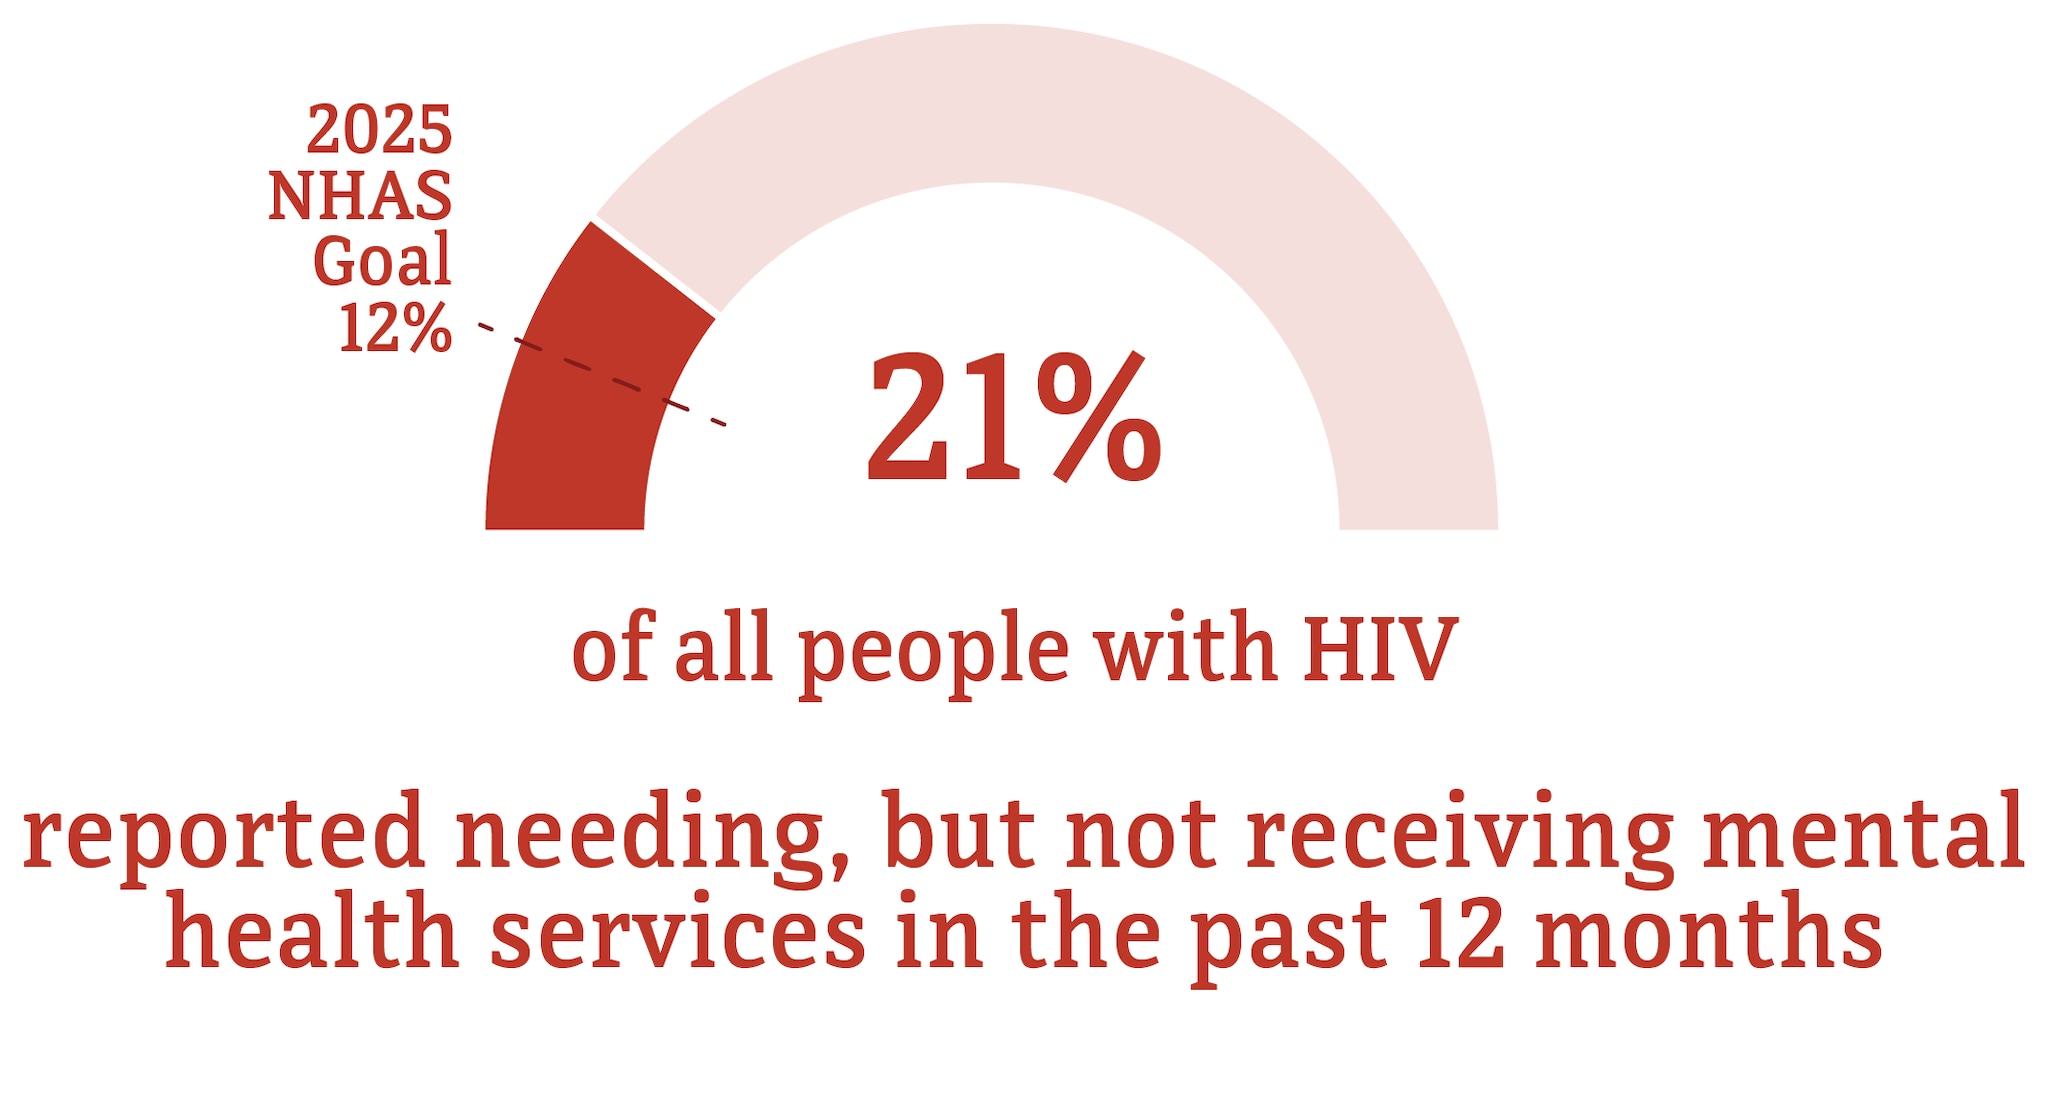
* Among people aged 18 and older.
† Among people with diagnosed HIV who reported an unmet need for mental health services in the past 12 months.
Source: CDC. Quality of life and HIV stigma—Indicators for the National HIV/AIDS Strategy, 2022–2025, CDC Medical Monitoring Project, 2017–2020 cycles. HIV Surveillance Special Report 2022;30.
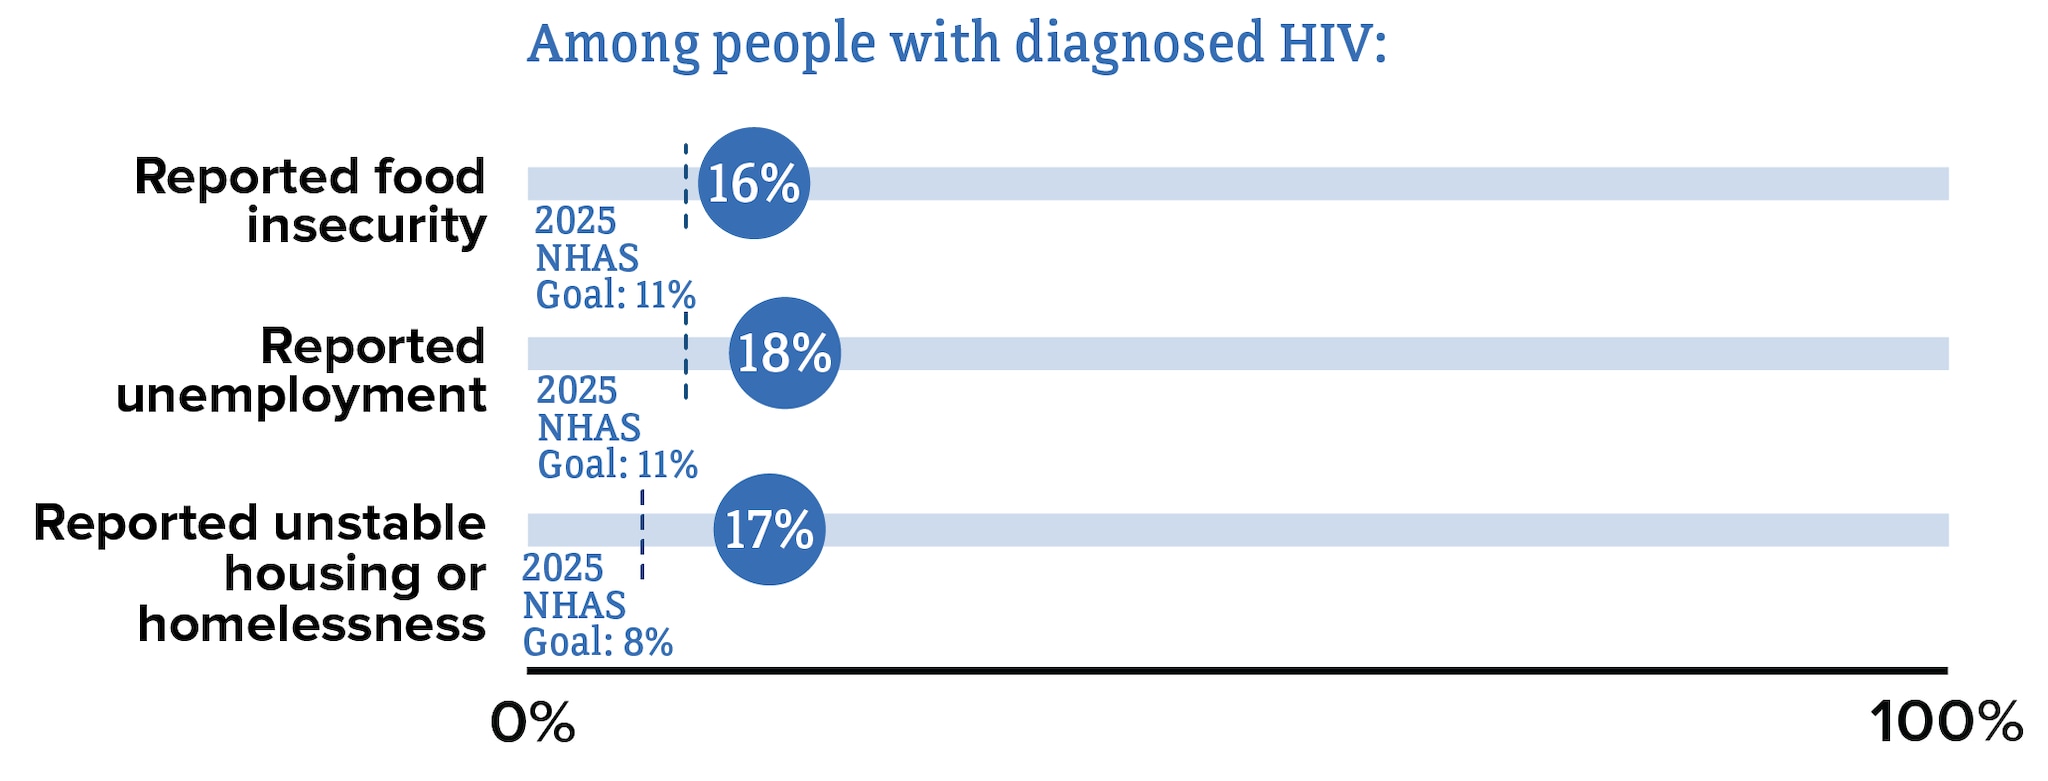
* Among people aged 18 and older.
Source: CDC. Quality of life and HIV stigma—Indicators for the National HIV/AIDS Strategy, 2022–2025, CDC Medical Monitoring Project, 2017–2020 cycles. HIV Surveillance Special Report 2022;30.
a Unless otherwise noted, data in this web content are for adults and adolescents aged 13 and older.
b American Samoa, Guam, the Northern Mariana Islands, Puerto Rico, the Republic of Palau, and the US Virgin Islands.
c HIV incidence data are not available for transgender people.
d Includes infections attributed to male-to-male sexual contact and injection drug use (men who reported both risk factors).
e A person whose gender identity or expression is different from their assigned sex at birth.
f A person assigned male at birth who identifies as female.
g A person assigned female at birth who identifies as male.
h Includes infections attributed to male-to-male sexual contact and injection drug use (men who reported both risk factors).
i The term male-to-male sexual contact is used in CDC surveillance systems. It indicates a behavior that transmits HIV infection, not how individuals self-identify in terms of their sexuality. This web content uses the term gay and bisexual men to represent gay, bisexual, and other men who reported male-to-male sexual contact.
j Includes people who have ever had sexual contact with a person known to have, or with a risk factor for, HIV. Does not include men who have ever had sexual contact with both men and women.
k Does not include infections attributed to male-to-male sexual contact and injection drug use (men who reported both risk factors).
l Regions used in CDC’s National HIV Surveillance System:
Northeast: CT, ME, MA, NH, NJ, NY, PA, RI, VT
Midwest: IL, IN, IA, KS, MI, MN, MO, NE, ND, OH, SD, WI
South: AL, AR, DE, DC, FL, GA, KY, LA, MD, MS, NC, OK, SC, TN, TX, VA, WV
West: AK, AZ, CA, CO, HI, ID, MT, NV, NM, OR, UT, WA, WY
- CDC. Diagnoses of HIV infection in the United States and dependent areas, 2021. HIV Surveillance Report 2023;34.
- CDC. Estimated HIV incidence and prevalence in the United States 2017–2021. HIV Surveillance Supplemental Report 2023;28(3).
- CDC. Monitoring selected national HIV prevention and care objectives by using HIV surveillance data—United States and 6 dependent areas, 2021. HIV Surveillance Supplemental Report 2023;28(4).
- CDC. Quality of life and HIV stigma—Indicators for the National HIV/AIDS Strategy, 2022–2025, CDC Medical Monitoring Project, 2017–2020 cycles. HIV Surveillance Special Report2022;30.
- CDC. Behavioral and clinical characteristics of persons with diagnosed HIV infection—Medical Monitoring Project, United States 2020 cycle (June 2020–May 2021). HIV Surveillance Special Report 2022;29.
