


What to know
Introduction
The U.S. Centers for Disease Control and Prevention has hosted influenza forecasting challenges annually since the 2013-2014 influenza season, except for 2020-2021, when there was limited influenza activity. This report summarizes the performance of FluSight hospital admission forecasts for all 50 states, D.C., and nationally from the 2025-2026 U.S. influenza season. An evaluation of FluSight emergency department visit percentages due to flu is forthcoming. Further details on FluSight and the scoring methods can be found at the bottom of the page.
Results
The U.S. 2025-2026 influenza season was characterized as moderate according to CDC's preliminary in-season severity assessment, with the highest weekly number of hospital admissions exceeding 40,0001. Influenza hospitalizations began to increase in mid-November 2025 and peaked nationally during the week ending December 27, 2025. The figure below shows national weekly observed influenza hospital admissions (black points) along with FluSight ensemble forecasts with 50% and 95% prediction intervals (denoted by shading) for six different submission timepoints during the 2025–2026 season (Figure 1). While ensemble forecasts, including the FluSight ensemble (see Methods), have been among the most accurate for influenza and other infectious disease forecasting efforts, they may not always reliably predict rapid changes in disease trends, such as increases observed at the season onset and changes at the peak. This pattern was seen during the 2025-2026 season when the ensemble 50% and 95% prediction intervals failed to anticipate the increases in hospitalizations observed in late December 2025 and the decreases in mid-January 2026.
Figure 1: National Ensemble Forecasts
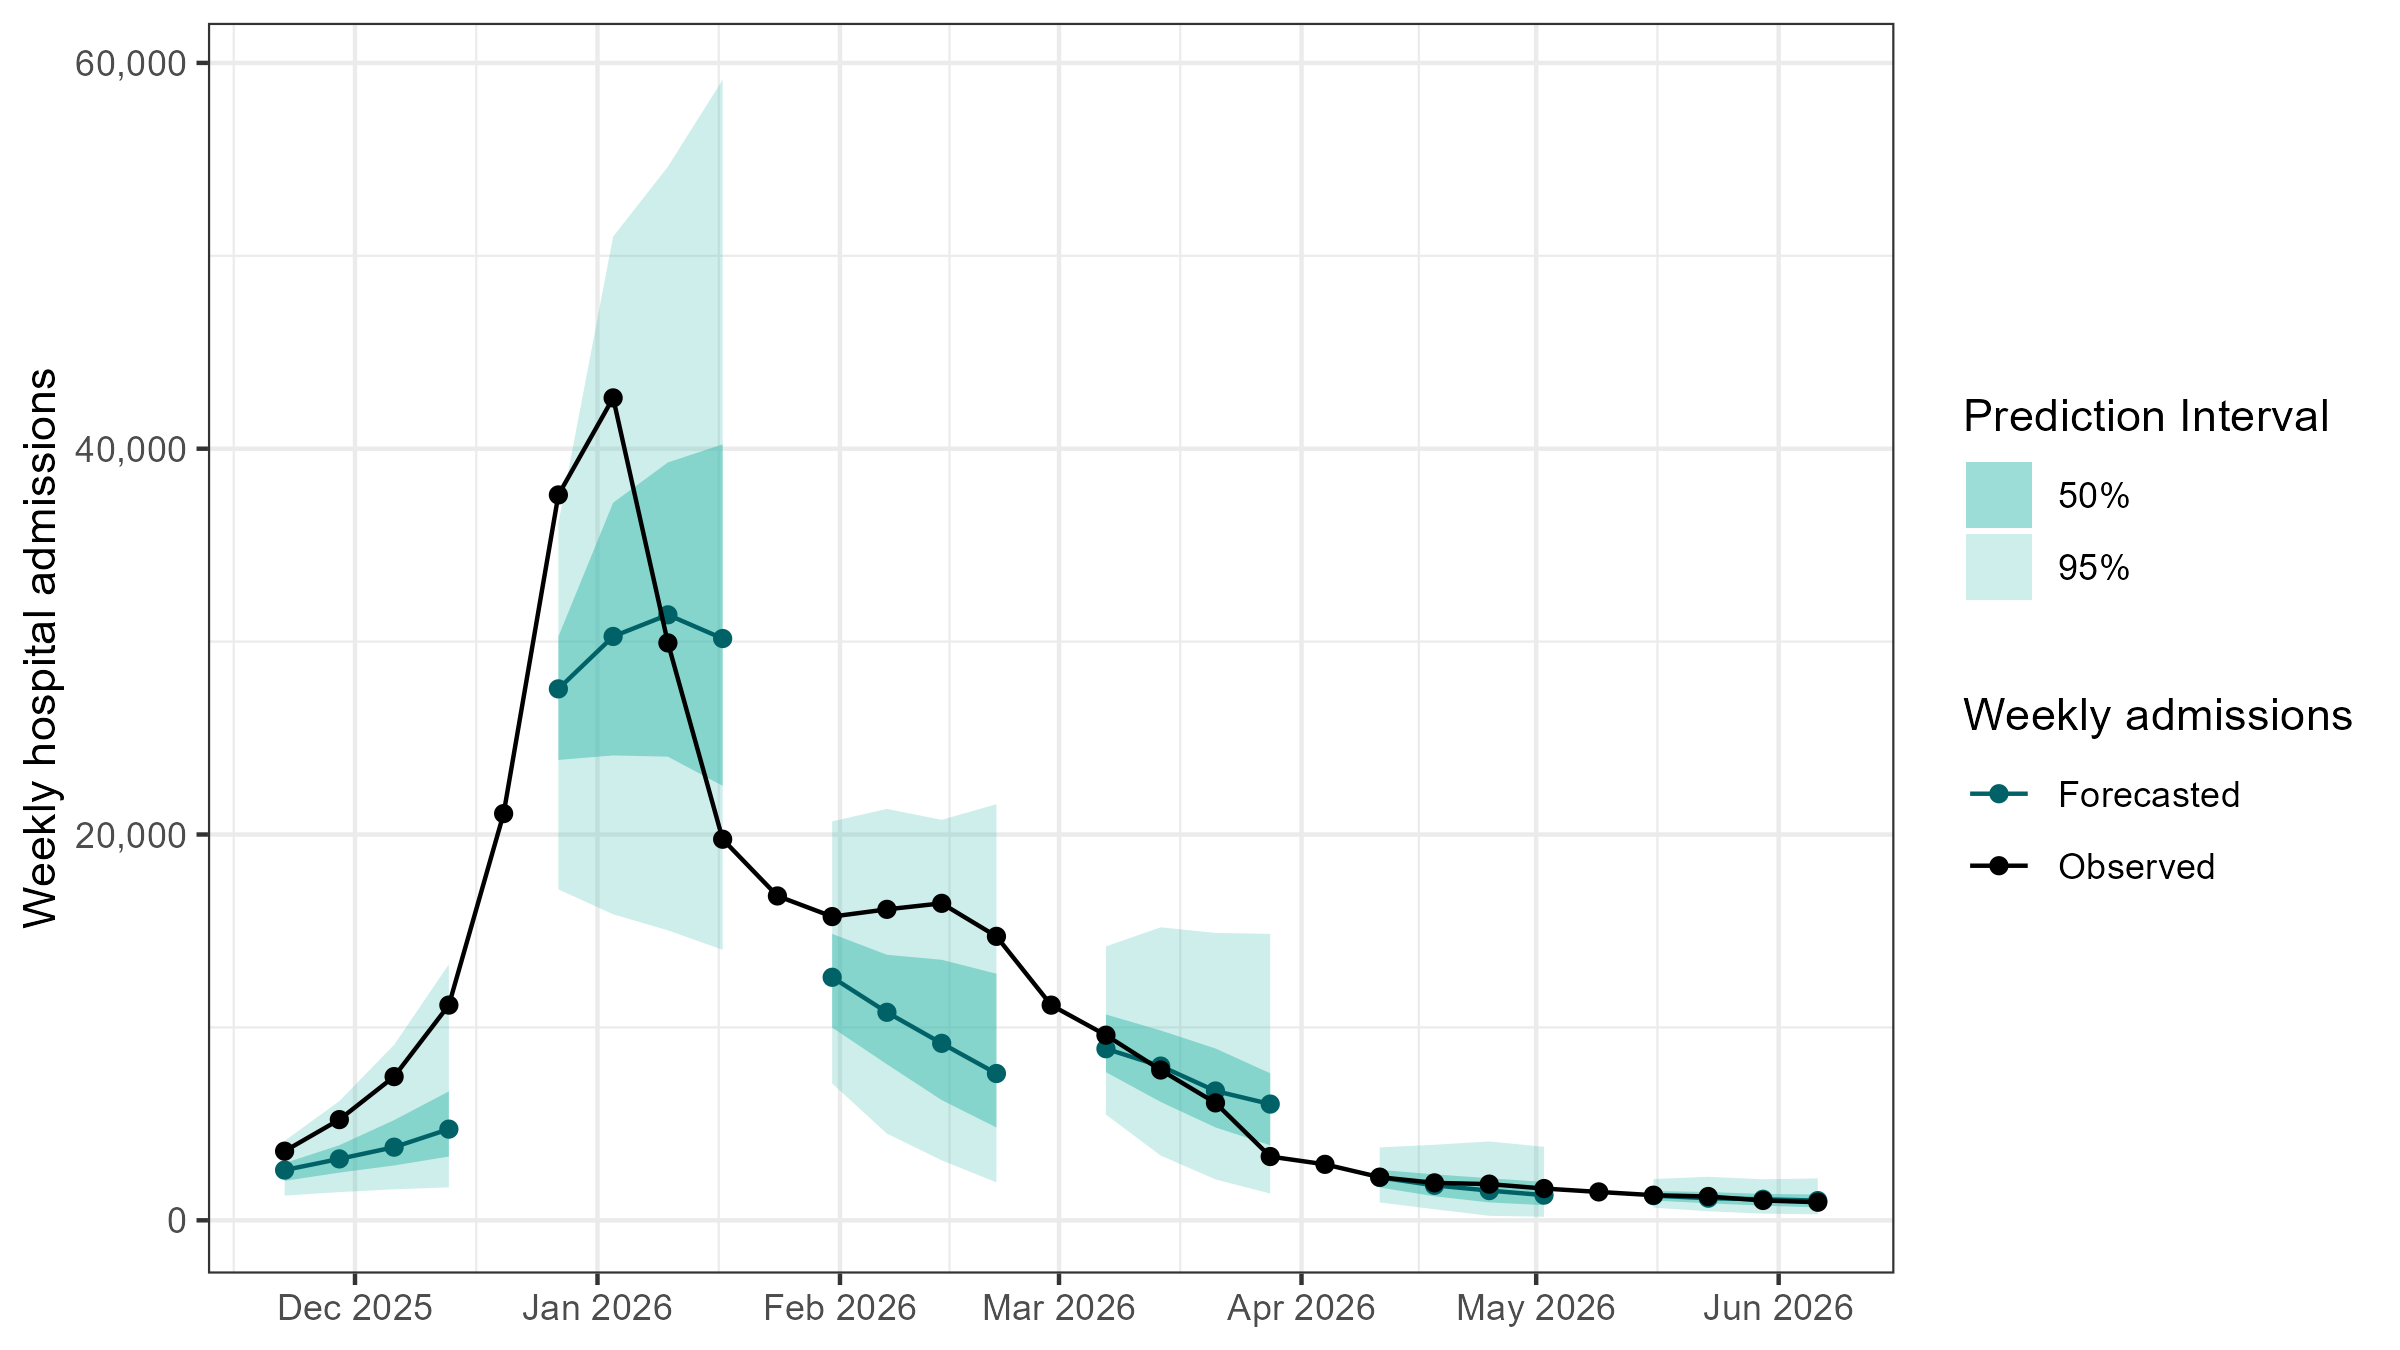
A total of 34 teams contributed influenza hospital admission forecasts from 53 unique models; of those, 39 models met the inclusion criteria for this analysis, and were categorized based on their methodologies as statistical, mechanistic, artificial intelligence or machine learning, or ensemble. The following models submitted forecasts during the 2025-2026 season and were included in the FluSight ensemble when submitted, but were not included in this analysis because they did not submit at least 75% of the forecast targets: CADPH-FluCAT_Ensemble, CFA_Pyrenew-Pyrenew_HE_Flu, DMAPRIM-DLM, DMAPRIME-QR, Epistorm-Ensemble_Flu, JHU_CSSE-CSSE_Ensemble, LU-comUncertLab-puca, MDPredict-SIRS, NU-PGF_FLUH, and UVAFluX-CESGCN. A baseline model that carries forward the prior week's number of hospital admissions was generated for comparison purposes (see Methods).
Forecasts were primarily evaluated using the relative weighted interval score (WIS), a forecast skill metric that measures how consistent a collection of forecast prediction intervals is with observed data. This metric is calculated relative to the baseline model, with a value below 1 representing a forecast that performed better than the baseline. Forecasts were also evaluated on coverage, or how often the prediction interval contained the eventually observed value.
The FluSight ensemble, which is the model used by CDC to communicate forecast messaging, ranked 7th for the overall season in terms of the primary performance metric (average relative WIS across the season for all jurisdictions, excluding national). Among the individual team submissions, the top performing model was Google_SAI-FluEns23. Of the 39 submitted models, 33 performed better than the baseline model (Table 1).
Table 1: Results for included models
Relative WIS values varied by jurisdiction. Table 2 shows how each model performed for each jurisdiction. The FluSight ensemble was one of 12 models that consistently outperformed the baseline in all jurisdictions.
Table 2: Relative WIS by jurisdiction and model
The lowest coverage for the FluSight ensemble occurred during the week ending December 27, 2026, which aligns with the national and most common jurisdictional peak in influenza hospital admissions, with less than 25% of the 2-week horizon forecast prediction intervals across jurisdictions containing observed values. Another drop in coverage was seen in mid-January, aligning with the steepest decrease in hospitalizations of the season (Figure 2). FluSight ensemble coverage stabilized at values near 95% starting in February 2026.
Methods
CDC solicited weekly influenza forecasts from academic, industry, and government forecasting teams from November 19, 2025, through May 20, 2026. The main forecasting target was weekly influenza hospital admissions for the current week and up to three weeks in the future for the United States, each state, Puerto Rico, and Washington D.C. Target data, Weekly Hospital Respiratory Data Metrics by Jurisdiction, were downloaded from the National Healthcare and Safety Network (NHSN) and data.cdc.gov4. Final target data used for scoring in this analysis were published July 1, 2026. Influenza hospital admission forecasts were first published to the CDC FluSight webpage on December 12, 20255.
Each week, CDC created a baseline forecast (FluSight baseline) for comparison and an ensemble forecast (FluSight ensemble). The FluSight baseline model forecasted a median incidence equal to that of the last week with uncertainty based on observation noise. Methods for creating the baseline have been described previously6. The FluSight ensemble, which was used for CDC's influenza forecasting messaging, takes the median forecast from models self-designated for ensemble inclusion and is created using the hubEnsembles R package7.
Prior to forecast submission, teams were required to submit model metadata which included information about methods and whether the model should be included in the FluSight ensemble8. Models were categorized based on model components including statistical (STAT), mechanistic (MECH), and artificial intelligence or machine learning (AI/ML). Components were determined based on submitted methods listed in the metadata. Models with "mechanistic", "SEIR", "SIR", "SLIR", "km27", "compartment", "renewal", or "dynamics" in the description were considered to have mechanistic components, models that mentioned "lstm", "random forest", "generative", "GRB", "SVM", "lightGBM", or had key words including "deep", "neural", or "machine learning" were considered to have AI/ML components, and methods that explicitly stated "statistical", "time-series", "ARIMA", "regression", "holt", or "random walk", or were not classified as having either mechanistic or AI/ML were classified as having statistical components. Components were not considered mutually exclusive. Whether a model was an ensemble of other models was also included in categorization. Ensembles were explicitly reported by each team. This information was not used for scoring or analysis purposes but is included in Table 1 for reference.
For the scoring in this analysis, we excluded national forecasts due to differences in scale and Puerto Rico forecasts due to data availability. Models that submitted less than 75% of the total forecasts from all remaining weeks and jurisdictions were also excluded. Table 1 includes the percentage of forecasts submitted for each model for the targets included in this analysis.
Forecasts were evaluated on relative WIS using transformed hospital admissions counts with a natural logarithm to minimize the impact of count magnitude across jurisdictions9. WIS is a proper score that measures how consistent a collection of forecast prediction intervals is with the observed data. A lower value represents a better forecast. WIS is often calculated relative to the baseline to give relative WIS (values <1 are considered better than the baseline). Relative WIS was calculated as the geometric mean of pairwise mean WIS ratios over forecast targets shared by each pair of models and then scaled relative to the FluSight baseline model9. Using the pairwise approach allows for a more direct comparison of models even when not all models submit all or most forecast jurisdictions. This reduces penalization against models that may have submitted forecasts for all jurisdictions or jurisdictions that may be inherently more difficult to forecast.
Forecasts were also evaluated on 50% and 95% coverage. Coverage is a measure of how often the prediction interval captures the eventually observed values or the percentage of times a prediction interval correctly contains the observed value. Relative WIS and coverage were calculated using the scoringutils R package10.
All analyses were performed in R version 4.5.311.
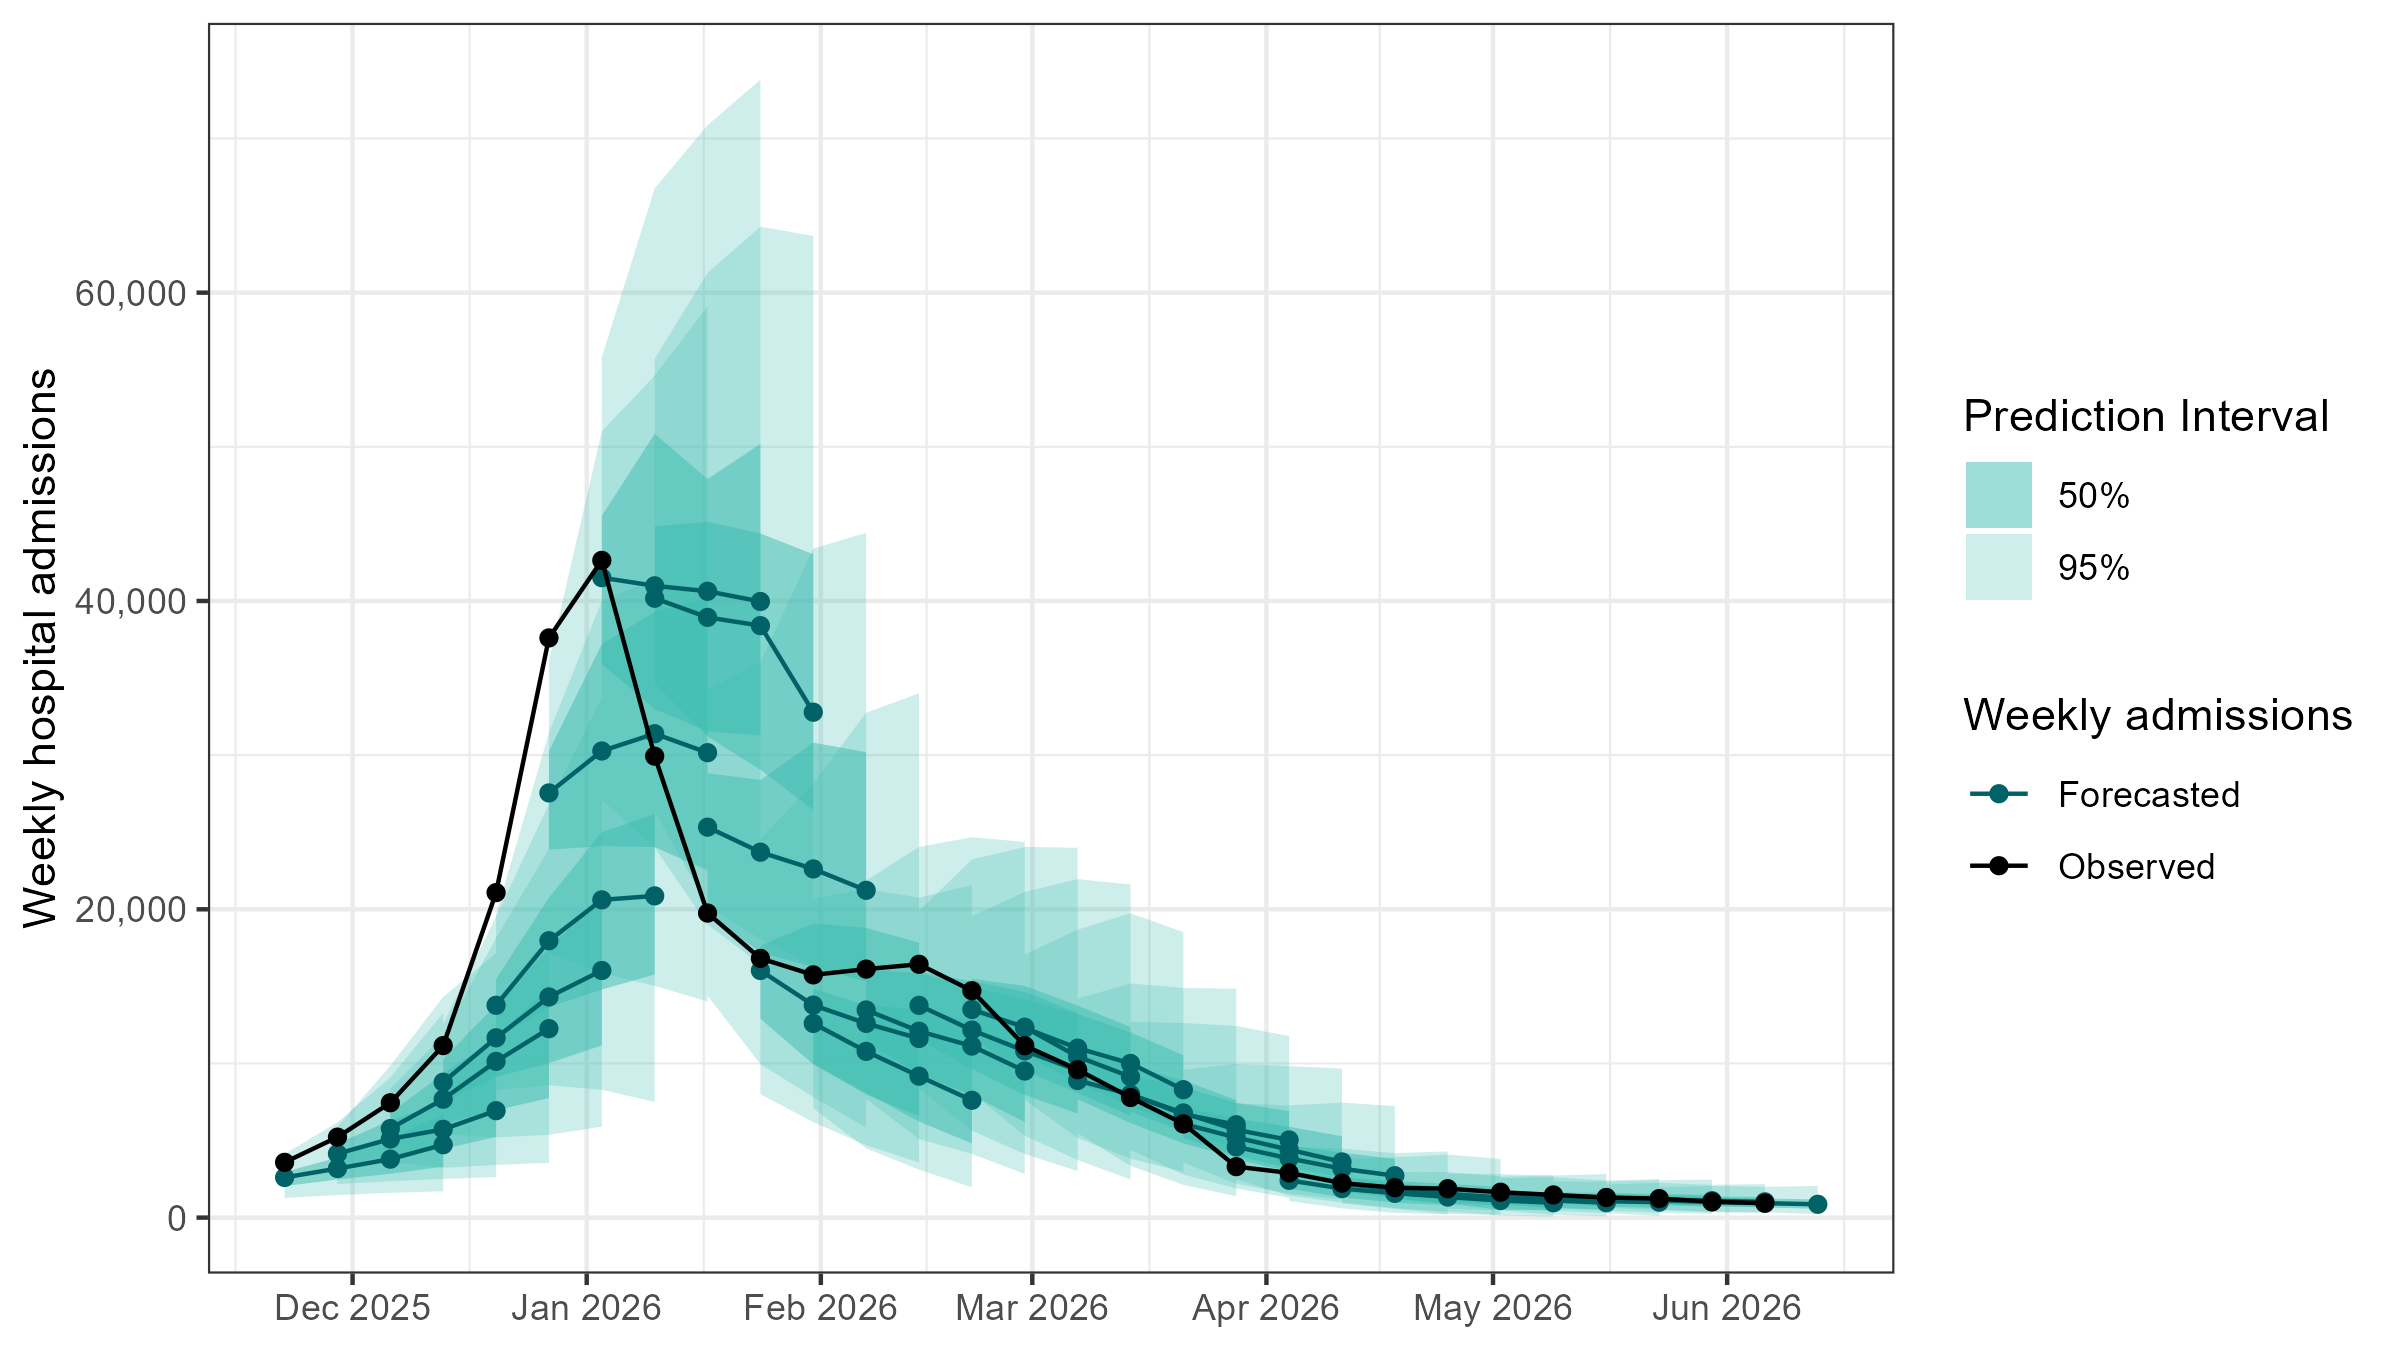
Supplemental Figure 1: National Ensemble Forecasts of Influenza Hospitalizations
This page was last updated on this date. Updates may include minor edits, image changes, or other modifications to page content.
The information on this page was last reviewed by subject matter experts to ensure accuracy.
- Influenza Division Centers for Disease Control and Prevention 2025-2026 United States Flu Season: Preliminary In-Season Severity Assessment. 2026; Available from: https://www.cdc.gov/flu-burden/php/surveillance/in-season-severity.html.
- Aygun, E., et al., An AI system to help scientists write expert-level empirical software. Nature, 2026. 654(8120): p. 909-916.
- Martinson, S., et al., Prospective multi-pathogen disease forecasting using autonomous LLM-guided tree search. arXiv preprint, 2026. 2605.
- Weekly Hospital Respiratory Data (HRD) Metrics by Jurisdiction, National Healthcare Safety Network (NHSN) (Preliminary). Available from: https://data.cdc.gov/Public-Health-Surveillance/Weekly-Hospital-Respiratory-Data-HRD-Metrics-by-Ju/mpgq-jmmr/about_data
- Influenza Division Centers for Disease Control and Prevention Flu Hospital Admissions as of December 10, 2025. 2025; Available from: https://www.cdc.gov/flu-forecasting/data-vis/12102025-flu-forecasts.html.
- Mathis, S.M., et al., Title evaluation of FluSight influenza forecasting in the 2021-22 and 2022-23 seasons with a new target laboratory-confirmed influenza hospitalizations. Nat Commun, 2024. 15(1): p. 6289.
- Shandross, L., E. Howerton, and E.L. Ray. hubEnsembles: Ensemble methods for combining hub model outputs. 2025; Available from: https://github.com/infectious-disease-modeling-hubs/hubEnsembles.
- CDC FluSight Team FluSight Forecast Hub. 2026; Available from: https://github.com/cdcepi/FluSight-forecast-hub.
- Bosse, N.I., et al., Scoring epidemiological forecasts on transformed scales. PLoS Comput Biol, 2023. 19(8): p. e1011393.
- Bosse, N.I., Gruson, H., Funk, S., Cori, A., van Leeuwen, E., Abbot, S., Evaluating Forecasts with scoringutils in R. 2022.
- R Core Team R: A Language and Envrionment for Statistical Computing. 2026; Available from: https://www.R-project.org/.