What to know
Interpretation of Forecasts of Emergency Department Visits
- Ensemble forecasts combine forecasts from all submitted models into one forecast. These forecasts have been among the most accurate for previous influenza forecasting efforts but may not reliably predict rapid changes in disease trends. Declines in forecast accuracy during rapid changes in influenza emergency department visit percentages have also been observed this season.
- This week, seven modeling groups contributed seven forecasts that were eligible for inclusion in the ED ensemble forecasts for at least one jurisdiction. Contributing teams are listed below.
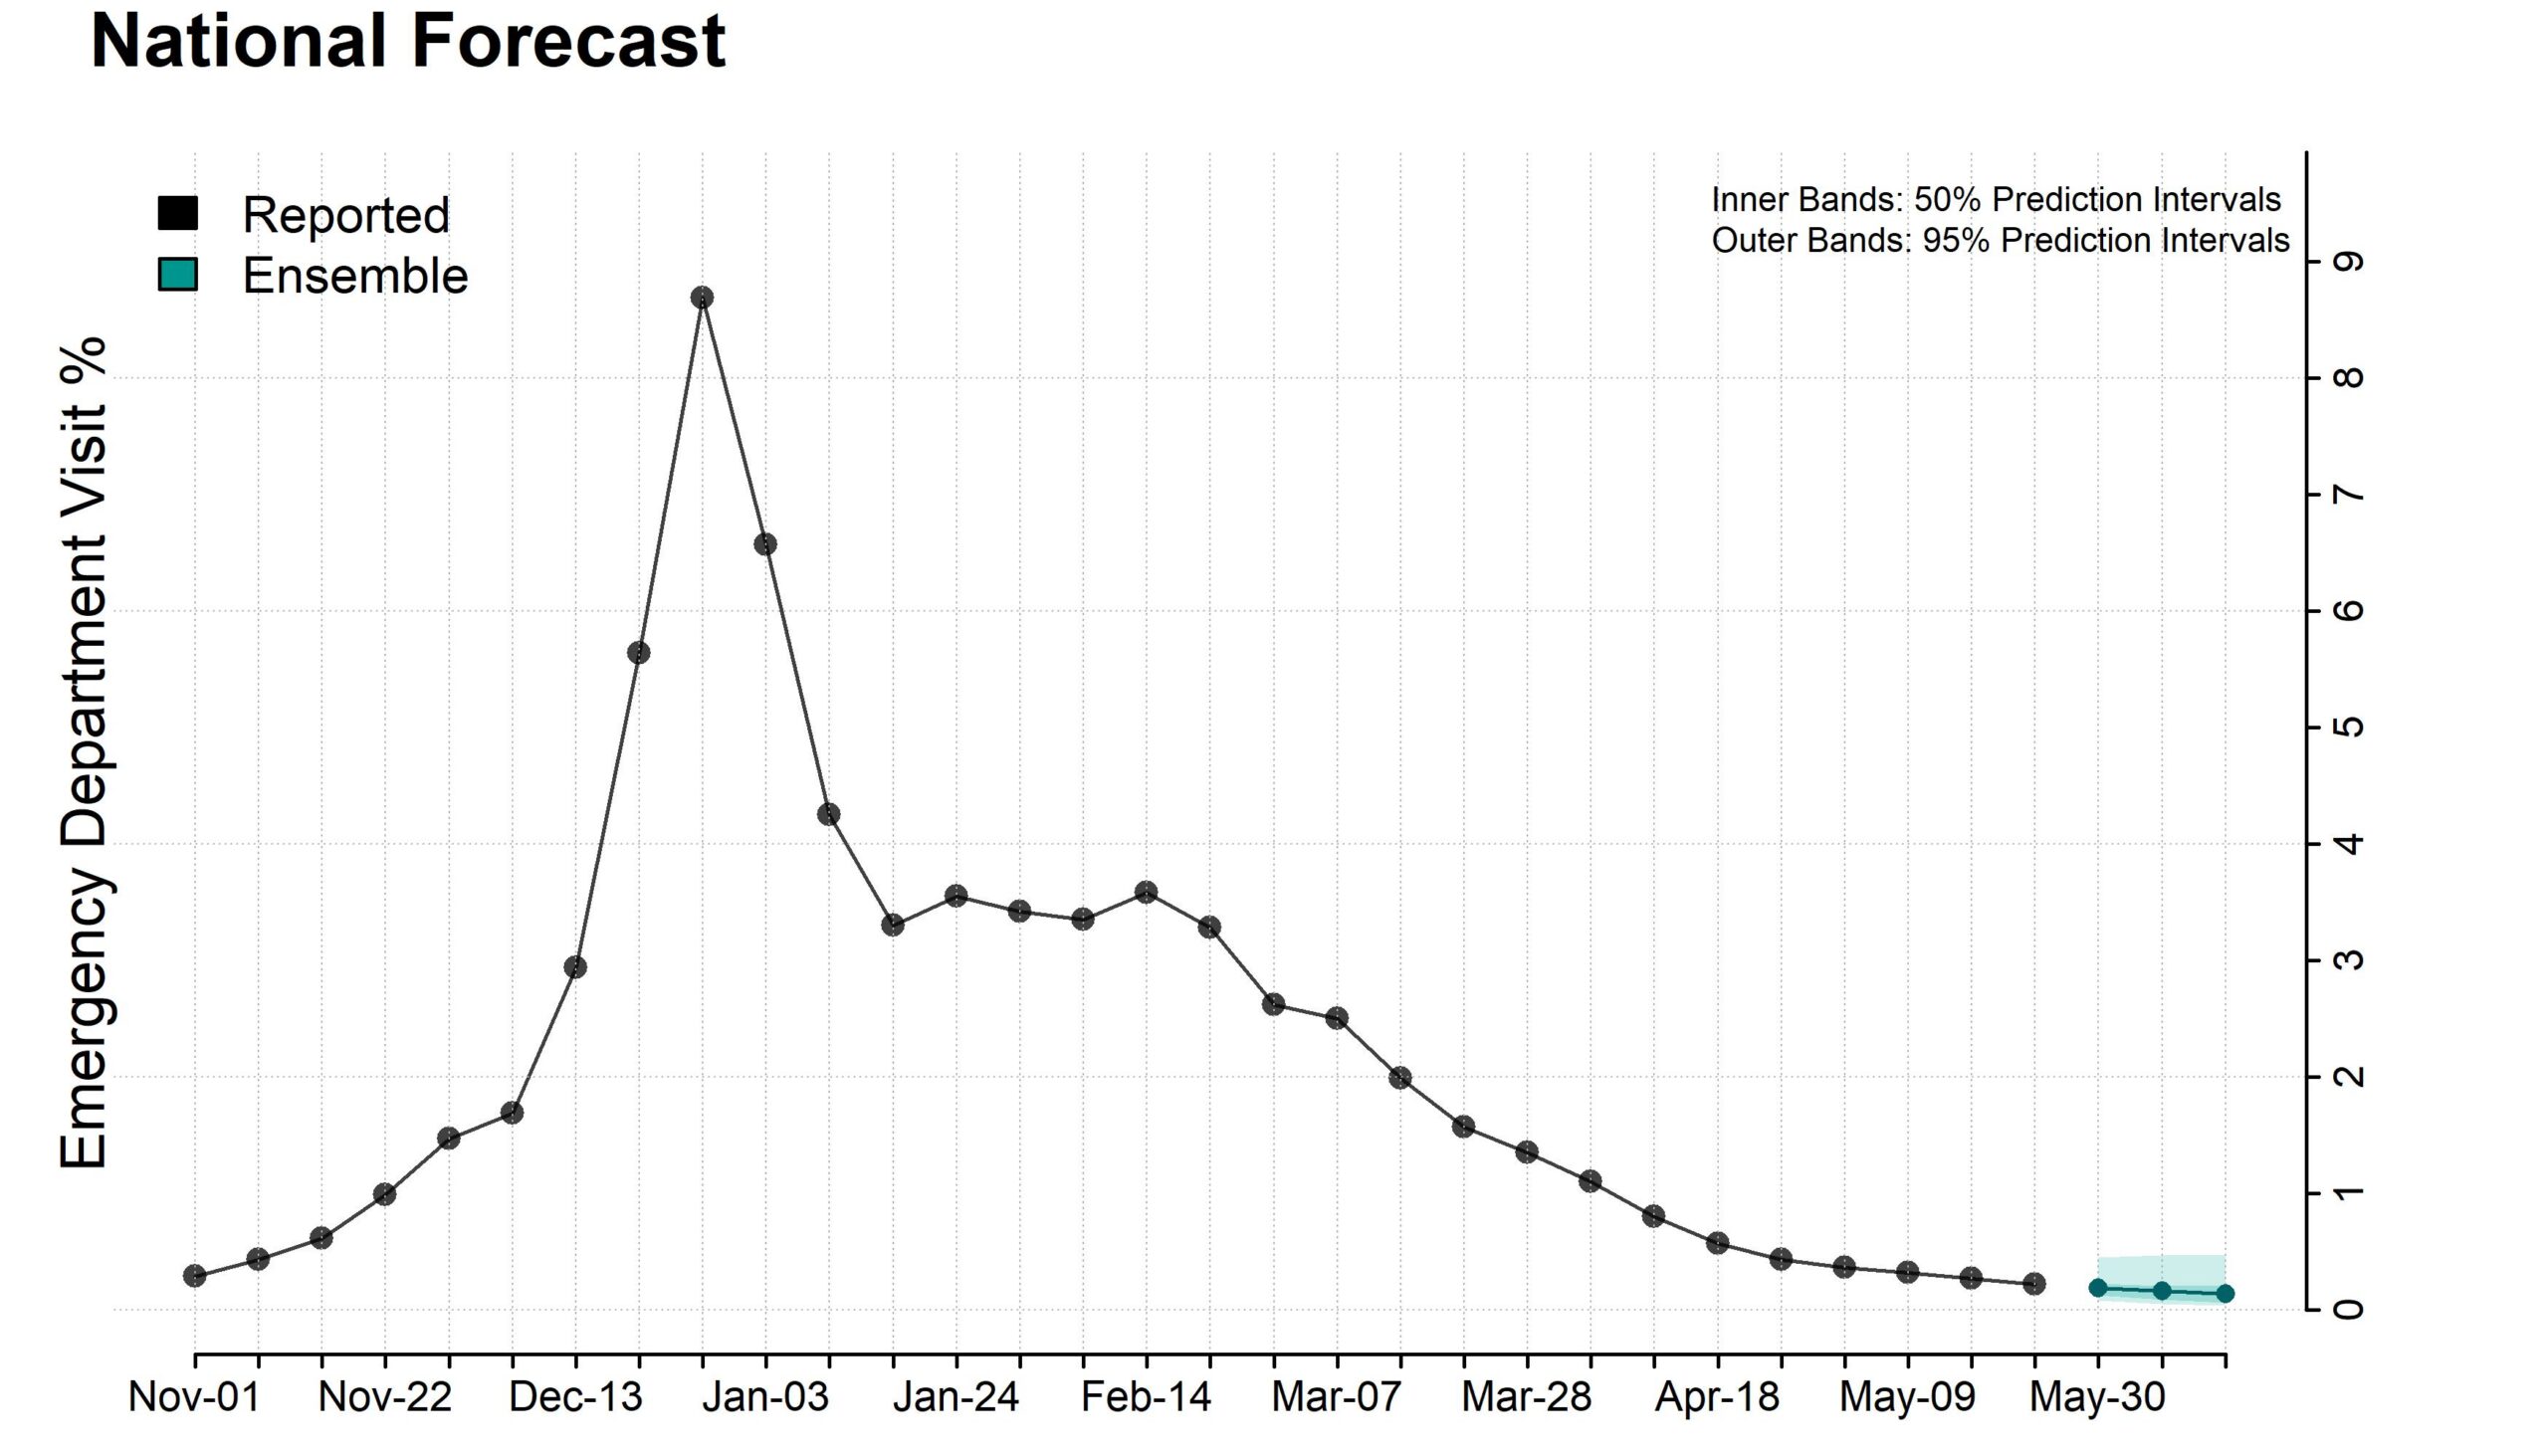
- The interactive figure shows the percentage of ED visits due to influenza reported in the United States each week from October 2025 through May 23, 2026 reported as of May 27, 2026, and forecasted influenza ED visit percentages each week for this week and the next two weeks, through June 13, 2026. The colored areas on the graph show prediction intervals, which indicate bounds of uncertainty around the forecast estimates.
National and State Forecasts
Forecasted weekly
Select a location and week ending date to see the ( prediction interval) based on forecasts submitted by .
Select forecast location, date, and models below. Modeling based on forecasts submitted by . Click and drag to change the forecast date to see how previous forecasts performed against reported data.
Forecasted
(% prediction interval: - )
| Median | Prediction Interval | Model | |
|---|---|---|---|
| Forecast median | prediction interval | Name |
|---|
Select Models
Click on models to see and compare forecasts
- The forecasted percentages of ED visits due to influenza are calculated by dividing the number of visits with a discharge diagnosis of influenza in a one-week period (the numerator) by the total number of ED visits in the same period (denominator) at the relevant jurisdictional level.
- Reporting of influenza specific ED visits is voluntary through the National Sydromic Surveillance Program (NSSP), but many facilities participate in automated reporting, resulting in reasonably stable visit levels over time. For more information about NSSP see About NSSP.
- Forecast submissions are collected and stored in the FluSight GitHub repository, which also contains more detailed information about the forecast data and submission process.
Additional Reports
State-level forecasts show the predicted percentage of emergency department visits due to influenza for this week and the next two weeks by state. Each state forecast figure uses a different scale due to differences in the percentage of emergency department visits due to influenza each week between states. Only forecasts included in the FluSight ensemble are shown. Plots of the state-level forecasts and the underlying data can be downloaded below.
Additional forecast data and information about submitting forecasts are available.
Contributing Teams and Models
Carnegie Mellon Delphi Group (Model: CMU-TimeSeries)
Center for Forecasting and Outbreak Analytics (CFA/CDC) Pyrenew team (Model: CFA_Pyrenew-Pyrenew_E_Flu)
Columbia University (Model: CU-ensemble)
MOBS Lab at Northeastern University and ISI Foundation (Model: NEU_ISI-FluBcast)
MOBS Lab at Northeastern University (Model: MOBS-EpyStrain_Flu)
NAU (Model: NAU-vulPES)
UGA_flucast (Model: UGA_flucast-INFLAenza)