 ShareCompartir
Posted January 19, 2009
Multistate Outbreak of Salmonella Typhimurium Infections Linked to Peanut Butter, 2008–2009
This outbreak appears to be over. However, Salmonella is an important cause of human illness in the United States. More information about Salmonella, and steps people can take to reduce their risk of infection, can be found on the CDC Salmonella Web Page.
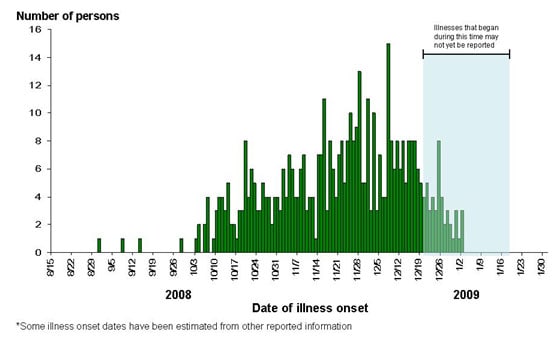
Epi Curve
This outbreak can be visually described with a chart showing the number of persons who became ill each day. This chart is called an epi curve. Please see the Timeline for Reporting of Salmonella Cases for more details on the reporting process.
Figure 1. Date of illness onset, by day
Interpretation of Epidemic Curves During an Active Outbreak
The epidemic curve (epi curve) shows progression of an outbreak over time. The horizontal axis represents the date when a person became ill, also called the date of onset . The vertical axis is the number of persons who became ill on each date. These are updated as new data come in, and thus are subject to change. The epi curve is complex and incomplete. Several issues are important in understanding it.
- There is an inherent delay between the date that an illness starts, and the date that the case is reported to public health authorities. It typically takes 2-3 weeks for Salmonella infections. That means that someone who got sick last week is very unlikely to have been reported yet, and someone who got sick three weeks ago may just be reported now. Please see the Salmonella Outbreak Investigations:Timeline for Reporting Cases.
- Some background cases of illness are likely to occur that would have occurred even without an outbreak. This makes it difficult to say exactly which case is the first in an outbreak. Epidemiologists typically focus on the first recognized cluster or group of cases rather than the very first case. Due to the inherent reporting delay, the cluster is sometimes not detected until several weeks after the persons became ill.
- For some cases, the date when they became ill is not known because it takes time before someone from the health department can do an interview to ask for this information. Sometimes the interview never occurs. If the date that the person brought the specimen to be tested to the laboratory is known, we may estimate the date of illness onset as three days before that.
- It can be difficult to determine when cases start to decline because of the reporting delay. This can become clearer as time passes.
- It can be difficult to say when the outbreak is over, because of the reporting delay. The delay means that the curve for the most recent three weeks always looks like the outbreak could be ending even during an active outbreak. The full shape of the curve is only clear after the outbreak is over.
Get email updates
To receive email updates about this page, enter your email address:
Contact Us:
- Centers for Disease Control and Prevention
1600 Clifton Rd
Atlanta, GA 30333 - 800-CDC-INFO
(800-232-4636)
TTY: (888) 232-6348 - Contact CDC–INFO
