Persons using assistive technology might not be able to fully access information in this file. For assistance, please send e-mail to: mmwrq@cdc.gov. Type 508 Accommodation and the title of the report in the subject line of e-mail.
Surveillance for Foodborne Disease Outbreaks — United States, 1998–2008
Corresponding author: L. Hannah Gould, PhD, Division of Foodborne, Waterborne, and Environmental Diseases, National Center for Emerging and Zoonotic Infectious Diseases. Telephone: 404-639-3315; E-mail: lgould@cdc.gov.
Abstract
Problem/Condition: Foodborne diseases cause an estimated 48 million illnesses each year in the United States, including 9.4 million caused by known pathogens. Foodborne disease outbreak surveillance provides valuable insights into the agents and foods that cause illness and the settings in which transmission occurs. CDC maintains a surveillance program for collection and periodic reporting of data on the occurrence and causes of foodborne disease outbreaks in the United States. This surveillance system is the primary source of national data describing the numbers of illnesses, hospitalizations, and deaths; etiologic agents; implicated foods; contributing factors; and settings of food preparation and consumption associated with recognized foodborne disease outbreaks in the United States.
Reporting Period: 1998–2008.
Description of the System: The Foodborne Disease Outbreak Surveillance System collects data on foodborne disease outbreaks, defined as the occurrence of two or more cases of a similar illness resulting from the ingestion of a common food. Public health agencies in all 50 states, the District of Columbia, U.S. territories, and Freely Associated States have primary responsibility for identifying and investigating outbreaks and use a standard form to report outbreaks voluntarily to CDC. During 1998–2008, reporting was made through the electronic Foodborne Outbreak Reporting System (eFORS).
Results: During 1998–2008, CDC received reports of 13,405 foodborne disease outbreaks, which resulted in 273,120 reported cases of illness, 9,109 hospitalizations, and 200 deaths. Of the 7,998 outbreaks with a known etiology, 3,633 (45%) were caused by viruses, 3,613 (45%) were caused by bacteria, 685 (5%) were caused by chemical and toxic agents, and 67 (1%) were caused by parasites. Among the 7,724 (58%) outbreaks with an implicated food or contaminated ingredient reported, 3,264 (42%) could be assigned to one of 17 predefined commodity categories: fish, crustaceans, mollusks, dairy, eggs, beef, game, pork, poultry, grains/beans, oils/sugars, fruits/nuts, fungi, leafy vegetables, root vegetables, sprouts, and vegetables from a vine or stalk. The commodities implicated most commonly were poultry (18.9%; 95% confidence interval [CI] = 17.4–20.3) and fish (18.6%; CI = 17.2–20), followed by beef (11.9%; CI = 10.8–13.1). The pathogen-commodity pairs most commonly responsible for outbreaks were scombroid toxin/histamine and fish (317 outbreaks), ciguatoxin and fish (172 outbreaks), Salmonella and poultry (145 outbreaks), and norovirus and leafy vegetables (141 outbreaks). The pathogen-commodity pairs most commonly responsible for outbreak-related illnesses were norovirus and leafy vegetables (4,011 illnesses), Clostridium perfringens and poultry (3,452 illnesses), Salmonella and vine-stalk vegetables (3,216 illnesses), and Clostridium perfringens and beef (2,963 illnesses). Compared with the first 2 years of the study (1998–1999), the percentage of outbreaks associated with leafy vegetables and dairy increased substantially during 2006–2008, while the percentage of outbreaks associated with eggs decreased.
Interpretation: Outbreak reporting rates and implicated foods varied by state and year, respectively; analysis of surveillance data for this 11-year period provides important information regarding changes in sources of illness over time. A substantial percentage of foodborne disease outbreaks were associated with poultry, fish, and beef, whereas many outbreak-related illnesses were associated with poultry, leafy vegetables, beef, and fruits/nuts. The percentage of outbreaks associated with leafy vegetables and dairy increased during the surveillance period, while the percentage associated with eggs decreased.
Public Health Actions: Outbreak surveillance data highlight the etiologic agents, foods, and settings involved most often in foodborne disease outbreaks and can help to identify food commodities and preparation settings in which interventions might be most effective. Analysis of data collected over several years of surveillance provides a means to assess changes in the food commodities associated most frequently with outbreaks that might occur following improvements in food safety or changes in consumption patterns or food preparation practices. Prevention of foodborne disease depends on targeted interventions at appropriate points from food production to food preparation. Efforts to reduce foodborne illness should focus on the pathogens and food commodities causing the most outbreaks and outbreak-associated illnesses, including beef, poultry, fish, and produce.
Introduction
Surveillance for Foodborne
Disease Outbreaks
Foodborne diseases cause an estimated 48 million illnesses each year in the United States, including 9.4 million caused by known pathogens (1,2). Only a minority of foodborne illnesses, hospitalizations, and deaths occur as part of recognized outbreaks (3). The contaminated food that caused an individual illness rarely is determined. Therefore, foodborne disease outbreak surveillance provides valuable insights into the agents that cause foodborne illness, types of implicated foods and ingredients, and settings in which transmission occurs.
CDC conducts surveillance for foodborne disease outbreaks in the United States through the Foodborne Disease Outbreak Surveillance System. State, local, and territorial public health departments have primary responsibility for identifying and investigating foodborne disease outbreaks caused by enteric bacterial, viral, parasitic, and chemical/toxic agents. At the current system's inception in 1973, paper reports were sent to CDC; in 1998, a revised reporting form was implemented, and the system became web-based. The revised form expanded the range of food information, settings, and contributing factors that could be reported. By 2001, all state, local, and territorial health departments were submitting reports through the web-based version of this form, the electronic Foodborne Outbreak Reporting System (eFORS). Data were collected through eFORS until 2008, when the system transitioned to an enhanced form and reporting platform, the National Outbreak Reporting System (NORS). NORS also collects information on enteric disease outbreaks with modes of transmission other than food, including: person-to-person contact, animal contact, water, and environmental contamination. Information about NORS is available at http://www.cdc.gov/nors. Foodborne disease outbreaks have been a nationally notifiable condition since 2010.
Foodborne disease outbreak surveillance serves multiple purposes:
- Identification of foods. Foodborne disease outbreak investigations have identified common and rare foods associated with foodborne disease outbreaks. Data from outbreaks can help researchers identify changes over time in commonly reported food vehicles, providing insight into the effectiveness of regulations and control measures. These data also help to identify specific pathogen-food pairs repeatedly linked to outbreaks and illnesses.
- Identification of etiologic agents. Outbreak investigations are a key means of identifying new and emerging pathogens and tracking ongoing problems. Prompt and thorough investigations of outbreaks aid in the timely identification of etiologic agents and can lead to appropriate prevention and control measures. Summaries of the results of these investigations provide information on the relative public health importance and impact of specific pathogens.
- Identification of settings. Data from outbreaks provide information regarding the food preparation and consumption settings where outbreaks occur. These data help to identify food preparation and handling practices that can be targeted by interventions to reduce foodborne diseases.
- Identification of points of contamination. The investigation of outbreaks informs prevention and control measures in the food industry by identifying points of contamination where action can be taken to reduce contamination by pathogens. Improvements at multiple points of food production (e.g., farm, slaughterhouse, and production plant) can contribute to reducing contamination in the food supply.
- Describing trends in foodborne disease outbreaks. Summarizing the findings of these investigations illustrates how outbreaks have changed over time and provides information about the efforts needed to prevent them. Data from outbreaks are used to measure progress toward food safety goals to reduce the incidence of illness caused by selected pathogens.
Summaries of data reported to the Foodborne Disease Outbreak Surveillance System have been published previously for 1983–1987 (4), 1988–1992 (5), 1993–1997 (6), 1998–2002 (7), 2006 (8), 2007 (9), and 2008 (10). This report summarizes epidemiologic data on foodborne disease outbreaks reported to CDC during 1998–2008, the eFORS reporting period, including assessments of changes in reporting over time and trends in source attribution. These findings are intended to be used by health departments and regulatory agencies to identify foods and settings for intervention likely to yield the greatest public health benefit.
Methods
Definitions and Sources of Data
A foodborne disease outbreak is defined as the occurrence of two or more cases of a similar illness resulting from the ingestion of a common food. This report includes outbreaks in which the first illness occurred during 1998–2008 that were reported by April 24, 2011. State, local, territorial, and tribal health departments use a standard form (CDC form 52.13, Investigation of a Foodborne Outbreak available at http://www.cdc.gov/nors/pdf/NORS_CDC_5213.pdf) to report foodborne disease outbreaks to CDC. Data requested for each outbreak include reporting state; date of first illness onset; the number of illnesses, hospitalizations, and deaths; the etiology; the implicated food vehicle; the setting of food preparation and consumption; and contributing factors. Multistate outbreaks (i.e., those in which exposure to the implicated food occurred in more than one state) typically are reported to the system by CDC.
Several types of outbreaks are excluded from the Foodborne Disease Outbreak Surveillance System, including those that occur on cruise ships and those in which the food was eaten outside the United States, even if the illness occurred in the United States. Outbreaks with other modes of transmission (e.g., water, person-to-person contact, and animal contact) also are not captured by this system; since 2009, these outbreaks have been reportable through NORS.
Laboratory and clinical guidelines for confirming an etiology are specific to each bacterial, chemical/toxin, parasitic, and viral agent (http://www.cdc.gov/outbreaknet/references_resources/guide_confirming_diagnosis.html). Suspected etiologies are those that do not meet the confirmation guidelines. The cause of the outbreak is categorized as multiple etiologies if more than one etiologic agent is reported.
Analysis
Descriptive
The number of outbreaks, illnesses, hospitalizations, and deaths for each year, state, and setting was calculated. For outbreaks caused by a single confirmed or suspected etiology, etiologies were grouped as bacterial, chemical/toxin, parasitic, or viral. Population-based rates of reported outbreaks over the 11-year surveillance period were calculated for each state using U.S. Census estimates for the midpoint of the surveillance period (2003) (11). Changes in the percentage of outbreaks caused by each etiology group were calculated using a Chi-square test.
Reporting Rates
So that changes in outbreak reporting nationwide during 1998–2008 could be assessed, the median number of outbreaks reported by each state annually and interquartile ranges were calculated (12). Changes in the detection, investigation, and reporting of foodborne outbreaks within each state during the surveillance period were evaluated using the annual percentage change in each state's foodborne outbreak reporting rate, calculated as follows:
in which AORR is the annual outbreak reporting rate (i.e., number of outbreaks reported per 1 million population, as estimated using the U.S. Census estimates for the midpoint of the surveillance period (2003) in the previous year (prev yr) and the current year (curr yr) of analysis, respectively. For each state, the median annual percentage change during the first half of the surveillance period (1998–2003) was compared with the median annual percentage change for the second half (2004–2008). The median annual percentage change was used as a measure of change over time to limit the impact of surveillance artifacts that influence reporting on estimates of change. Multistate outbreaks and states that reported no outbreaks during 2 or more years during the surveillance period were excluded from analysis.
Foods
Reported implicated food vehicles were included in the analysis regardless of the criteria by which they were identified (i.e., statistical evidence, laboratory evidence, compelling supportive information, and other data or experience made food a likely source). If the implicated food contained a single contaminated ingredient, or if all ingredients in the food belonged to a single commodity, the outbreak was assigned to one of 17 commodity groups: fish, crustaceans, mollusks, dairy, eggs, beef, game, pork, poultry, grains/beans, oils/sugars, fruits/nuts, fungi, leafy vegetables, root vegetables, sprouts, and vegetables from a vine or stalk (13). Outbreaks associated with implicated foods that could not be assigned to one of these commodities (e.g., the food contained ingredients from more than one commodity) (14), or for which the report contained insufficient information for commodity assignment, were not attributed to any commodity.
The percentage of outbreaks attributable to each food commodity is dependent upon several factors and is highly variable from year to year and across different states. In addition, the single commodity percentage estimates are mutually dependent, so direct estimation of 95% confidence intervals (CIs) from the reported data are not feasible. Consequently, random samples of the original dataset were drawn repeatedly (i.e., bootstrap resampling) and used to create a distribution of values representative of the original dataset from which CIs associated with the percentage of outbreaks associated with each commodity during the study period were estimated (15). This analysis required the assumption that outbreaks reported during the study period represented a random sample of all foodborne outbreaks occurring in the United States. Bootstrap resampling of outbreaks with one or more implicated foods reported and caused by a single suspected or confirmed etiology was performed to estimate the mean percentage of outbreaks in the resampled distribution associated with each pathogen-commodity pair* and CIs. Changes in the percentage of outbreaks attributed to specific commodities over time were estimated by grouping outbreaks into four 2–3-year time periods (1998–1999, 2000–2002, 2003–2005 and 2006–2008) and by performing bootstrap resampling of outbreaks for each time period. For each etiology, a set of 1,000 replications obtained from the original data was used to generate a bootstrap distribution of the mean percentage of outbreaks associated with each food commodity. Outbreaks with implicated food vehicles that could not be assigned to a single commodity were excluded from the replicates after bootstrap resampling. CIs were determined by using the two values that encompassed the central 95% of the bootstrap distribution (the percentile method). Sensitivity analysis was performed to evaluate the impacts on estimated attribution percentages associated with state reporting variability.
The mean percentage of outbreaks in the resampled distribution attributable to each commodity and CIs were determined for norovirus, Shiga toxin–producing Escherichia coli (STEC), Clostridium perfringens, all Salmonella serotypes combined, Salmonella serotype Enteritidis, and Salmonella serotype Typhimurium. The percentage of outbreaks caused by other etiologies attributed to individual food commodities could not be estimated reliably because of the relatively low number of reported outbreaks caused by these etiologies during the surveillance period.
Results
Foodborne Disease Outbreaks
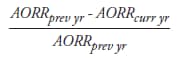
During 1998–2008, CDC received reports of 13,405 foodborne disease outbreaks, resulting in 273,120 illnesses, 9,109 hospitalizations, and 200 deaths (Table 1). An average of 1,219 (range: 968–1,403) outbreaks, 24,829 (range: 19,951–28,895) illnesses, 828 (range: 593–1261) hospitalizations, and 20 (range: 9–48) deaths was reported each year. Overall, the reported annual national rate of foodborne disease outbreaks was 4.2 outbreaks per 1 million population, ranging from a low of 3.3 in 2005 to a high of 4.8 in 2000 (Figure 1). The average annual rate of outbreak-related illnesses was 85.7 per 1 million population, the average annual rate of hospitalizations was 2.8 per 1 million population, and the average annual rate of deaths was 0.1 per 1 million population.
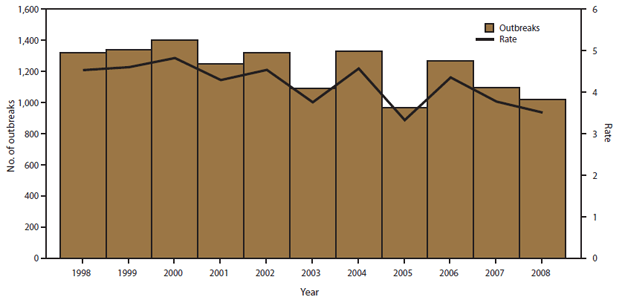
Outbreaks were reported by public health officials from 50 states, the District of Columbia (DC), Guam, Puerto Rico, and the Republic of Palau; 128 multistate outbreaks were reported. The total number of outbreaks reported by each state during 1998–2008 varied (range: 22–2,055; annual median: 116) (Figure 2). The median of the average annual state reporting rate was 3.1 outbreaks (range: 0.68–22.34) per 1 million population.
Etiologic Agents
A single confirmed or suspected etiologic agent was reported for 7,998 (60%) outbreaks; these outbreaks accounted for 204,048 (75%) illnesses (Table 1). Among the 7,998 outbreaks with a reported etiology, the etiology was confirmed in 5,059 (63%) outbreaks. Of the 7,998 outbreaks with a single confirmed or suspected etiology, 3,633 (45%) were caused by viruses, 3,613 (45%) by bacteria, 685 (9%) by chemical and toxic agents, and 67 (1%) by parasites.
Eight pathogens caused 89% of the 5,059 confirmed, single-etiology outbreaks, including norovirus (39%), Salmonella (26%), Shiga toxin–producing E. coli (STEC) (6%), scombroid toxin/histamine (5%), Clostridium perfringens (5%), Staphylococcus enterotoxin (3%), ciguatoxin (3%), and Campylobacter jejuni (2%). Overall, norovirus was the most common cause of outbreaks and illnesses, causing 3,444 (43%) of the 7,998 outbreaks with a confirmed or suspected single etiology, resulting in 100,652 (37%) illnesses, 1,028 (11%) hospitalizations, and five (3%) deaths (Table 1).
Salmonella was the second most common etiology, causing 1,449 (18%) of the 7,998 outbreaks with a confirmed or suspected single etiology and 39,126 (19%) illnesses (Table 1). Among the 1,291 outbreaks caused by Salmonella with a confirmed serotype, Enteritidis was the most common, causing 418 (32%) outbreaks, followed by Typhimurium (170 outbreaks [13%]), Heidelberg (102 outbreaks [8%]), and Newport (93 outbreaks [7%]). Outbreaks caused by Salmonella resulted in the largest number of reported hospitalizations (4,034 of 9,109 hospitalizations [44%]), followed by STEC (1,271 [14%] hospitalizations), and norovirus (1,028 [11%] hospitalizations). Salmonella also caused the most deaths (60 [30%] deaths), followed by Listeria (48 [24%] deaths), and STEC (22 [11%] deaths). The percentage of illnesses leading to hospitalization was highest for outbreaks caused by Listeria (61%) (Table 1).
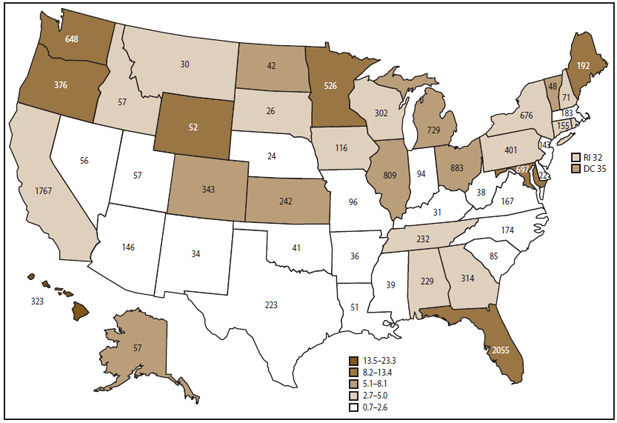
The percentage of outbreaks for which an etiology was confirmed or suspected increased significantly from 40% in 1998 to 67% in 2002 (p<0.0001), after which it remained level (Figure 3). Among outbreaks with a confirmed or suspected etiology, the percentage caused by a viral etiology increased markedly (Figure 4) because the percentage of outbreaks with a confirmed or suspected etiology that were reported as norovirus infections increased from 28% during 1998–2000 to 50% during 2006–2008 (p<0.001). Although the percentage of outbreaks with a confirmed single etiology that were caused by Salmonella remained relatively constant over time (22% during 1998–2000 and 19% during 2006–2008), the percentage of outbreaks caused by Salmonella serotype Enteritidis decreased from 44% during 1998–2000 to 24% during 2006–2008 (Figure 5).
Multistate Foodborne Disease Outbreaks
The annual number of multistate outbreaks reported increased from nine in 1998 to 17 in 2008 (Figure 6). Of the 128 multistate outbreaks reported, 68 (53%) were caused by Salmonella, and 37 (29%) were caused by STEC O157. Other etiologies reported in multistate outbreaks were Listeria monocytogenes (seven outbreaks), Shigella sonnei (three outbreaks), norovirus (three outbreaks), Vibrio parahemolyticus (two outbreaks), hepatitis A virus (two outbreaks), Clostridium botulinum (two outbreaks), Campylobacter jejuni (two outbreaks), paralytic shellfish poisoning toxin (one outbreak), and an unknown chemical agent (one outbreak). The most common Salmonella serotypes reported in multistate outbreaks were Newport (10 outbreaks [15%]), Typhimurium (eight outbreaks [12%]), Enteritidis (seven outbreaks [10%]), Saintpaul (five outbreaks [7%]), and Poona (four outbreaks [6%]).
Settings
Of the 13,405 outbreaks, a single place of food preparation was reported for 11,627 (86%) (Table 2). Of these, 7,939 (68%) were associated with food prepared in a restaurant or deli, 1,058 (9%) with food prepared in a private home, 794 (7%) with food prepared by a catering or banquet facility, and the remainder with food prepared in another place (Table 2). Among the 2,930 norovirus outbreaks with a reported single place of food preparation, the most common places were a restaurant or deli (1,885 [63%]) and a catering or banquet facility (318 [11%]). Among the 1,147 outbreaks of Salmonella infection with a single place of food preparation, the most common places were a restaurant or deli (623 [54%] outbreaks) and a private home (232 [20%] outbreaks). Among the 231 outbreaks of STEC infection with a single place of food preparation, the most common places were a restaurant or deli (86 [37%] outbreaks) and a private home (57 [25%] outbreaks). A private home was the most common place of food preparation for only one etiology, ciguatoxin (135 [81%] outbreaks).
The average outbreak size varied by place of food preparation. The largest outbreaks occurred in institutional settings, including prisons or jails (median: 45 illnesses), schools (median: 38 illnesses), and camps (median: 25 illnesses) (Table 4). Outbreaks in which the food was prepared in restaurants were among the smallest reported (median: five illnesses). Outbreaks in which the food was prepared in a private home had a median of eight illnesses.
Reporting Rates
During 1998–2008, the number of outbreaks reported declined 23%; the number of outbreaks reported did not exceed the median of the 11-year period (1,267 outbreaks) in any year after 2004. Florida contributed the most to the observed decrease in reporting, from 21% of outbreaks reported nationally in 1998 to 7% in 2008. Data from eight states and DC were excluded from further analyses evaluating reporting changes over time because they did not report any outbreaks for 2 or more years during the surveillance period (Table 5). Although the median number of outbreaks reported annually by each state varied from year to year (Figure 7), no patterns were observed over time. However, within-state comparisons of the median annual percentage change in reporting rates during the first (1998–2003) and the second (2004–2008) half of the surveillance period indicated that 16 states decreased annual reporting during 2004–2008 while 26 states either did not change or increased their reporting rate during 2004–2008 (Table 5). Of the 16 states that decreased reporting in the second half of the study period, two (California and Florida) together accounted for 28% of the total number of outbreaks reported nationally during the surveillance period.
Foods
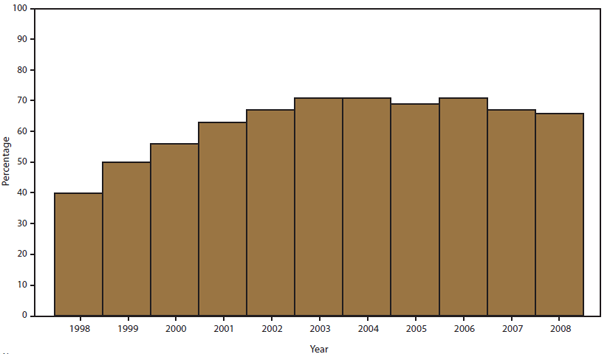
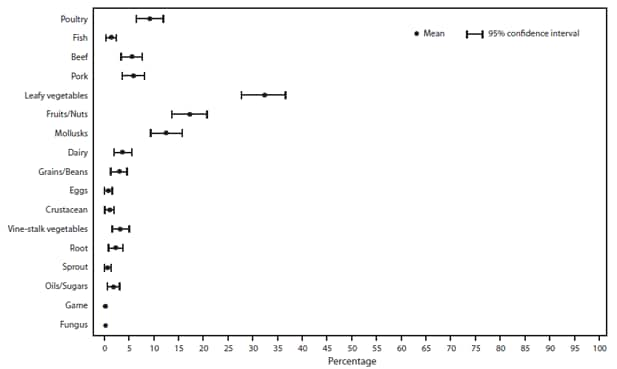
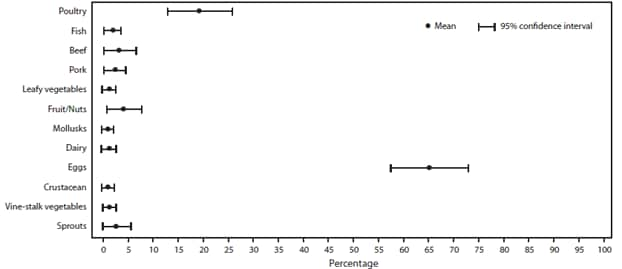
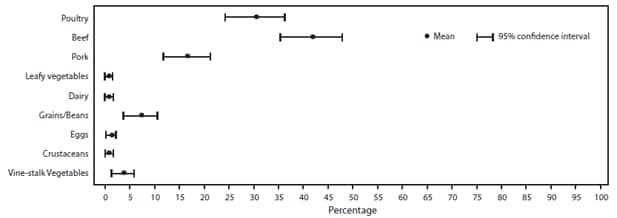
A food vehicle was reported for 7,724 (58%) outbreaks. The percentage of outbreaks with an implicated food decreased from 63% in 1998 to 46% in 2008 (Figure 8). The food vehicle could be assigned to one of the 17 commodities in 3,264 (42%) outbreaks (Table 6). The commodities implicated most commonly in outbreaks were poultry (19%; CI = 17.4–20.3), fish (19%; CI = 17.2–20), and beef (12%; CI = 10.8–13.1) (Figure 9). Among the 67,752 illnesses in outbreaks assigned to one of the 17 commodities, the commodities associated with the most outbreak-related illnesses were poultry (17%), leafy vegetables (13%), beef (12%), and fruits/nuts (11%).
The pathogen-commodity pairs responsible for the most outbreaks were scombroid toxin/histamine and fish (317 outbreaks), ciguatoxin and fish (172 outbreaks) (Table 7), Salmonella and poultry (145 outbreaks) (Table 8), and norovirus and leafy vegetables (141 outbreaks) (Table 9). The pathogen-commodity pairs responsible for the most outbreak-related illnesses were norovirus and leafy vegetables (4,011 illnesses) (Table 9), Clostridium perfringens and poultry (3,452 illnesses) (Table 8), Salmonella and vine-stalk vegetables (3,216 illnesses) (Table 9), and Clostridium perfringens and beef (2,963 illnesses) (Table 8). The pathogen-commodity pairs responsible for the most hospitalizations were Salmonella and fruits/nuts (452 hospitalizations), Salmonella and vine-stalk vegetables (441 hospitalizations), STEC and beef (340 hospitalizations), and STEC and leafy vegetables (301 hospitalizations). The pathogen-commodity pairs responsible for the most deaths were Listeria and poultry (16 deaths), Salmonella and fruits/nuts (14 deaths), and STEC and leafy vegetables (seven deaths).
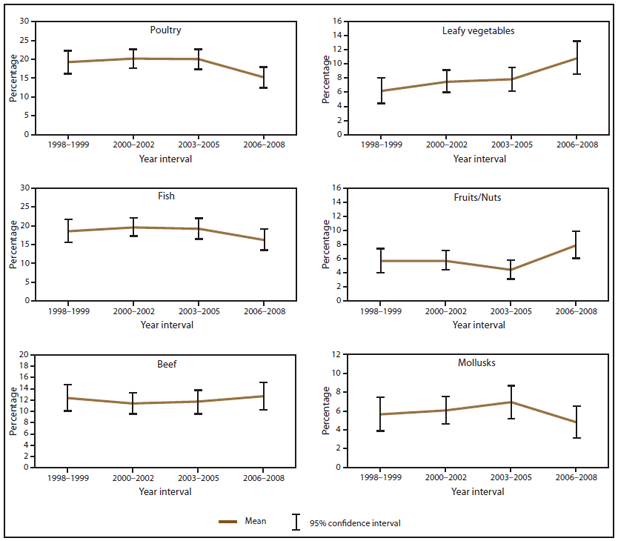
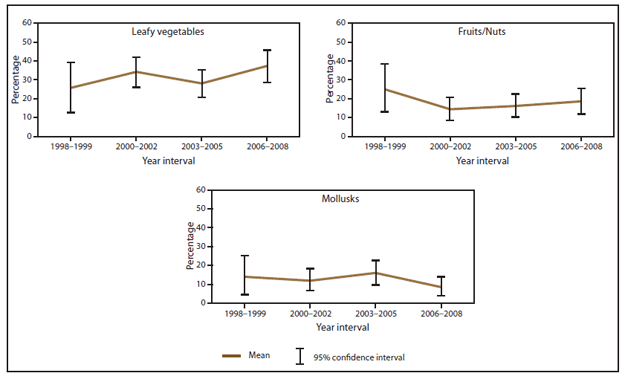
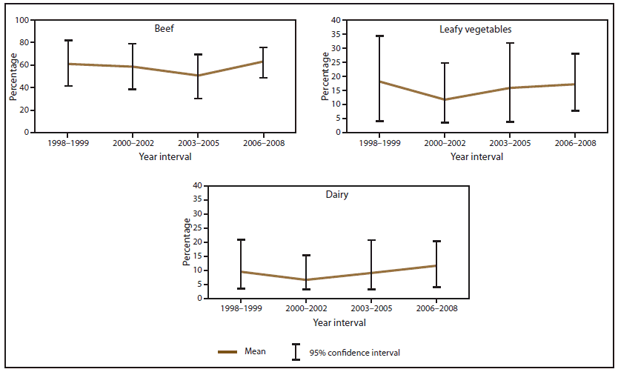
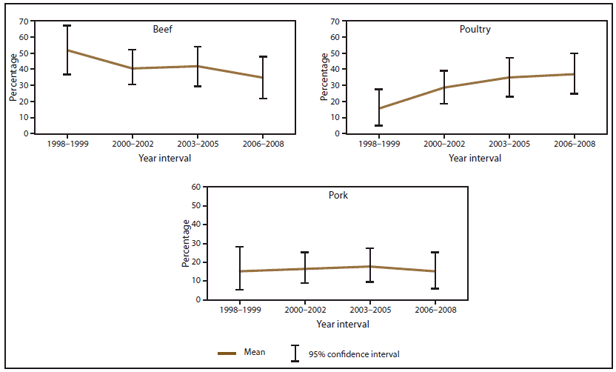
Estimated CIs for the percentage of outbreaks associated with each commodity were greatest for time periods, etiologies, and food commodities with fewer reported outbreaks. Consequently, few comparisons over time yielded significant results. Nonetheless, compared with the first 2 years of the study period (1998–1999), the percentage of outbreaks associated with leafy vegetables was significantly higher during the last 3 years (2006–2008), from 6% (CI = 4.4–8.1) during 1998–1999 to 11% (CI = 8.6–13.2) during 2006–2008. Similarly, the percentage of outbreaks associated with dairy increased from 3.6% (CI = 2.3–5.0) during 1998–1999 to 7% (CI = 5.4–9.3) during 2006–2008. The percentage of outbreaks associated with eggs decreased from 6% (CI = 3.9–7.3) during 1998–1999 to 2% (CI = 1.3–3.5) during 2006–2008 (Figure 10).
Among the outbreaks caused by norovirus, leafy vegetables (32%; CI = 27.8–36.6) were the most commonly implicated commodity (Figure 11), followed by fruits/nuts (17%; CI = 13.7–20.8) and mollusks (13%; CI = 9.5–15.7). Although the percentage of outbreaks caused by norovirus associated with these commodities varied across the time intervals, there were no significant differences over time in the estimated percentage of outbreaks attributed to these three commodities (Figure 12).
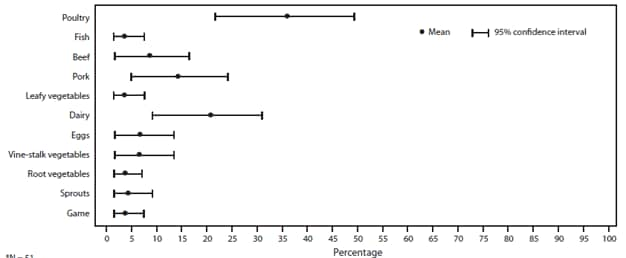
Outbreaks caused by Salmonella were associated most commonly with poultry (30%; CI = 25.7–34.2) and eggs (24%; CI = 20.5–28.3) (Figure 13). The percentage of outbreaks caused by Salmonella attributed to poultry varied over the four time intervals, ranging from 24% (CI = 15.5–32.7) to 33% (CI = 24.2–42.0) (Figure 14). The percentage of outbreaks caused by Salmonella attributed to eggs declined significantly from 33% (CI = 24.0–42.9) during 1998–1999 to 15% (CI = 8.0–22.0) during 2006–2008 (Figure 14). Although the percentage of outbreaks caused by Salmonella attributed to pork increased over the study period, this change was not significant.
Outbreaks caused by Salmonella serotype Enteritidis were attributed commonly to eggs (64%; CI = 56.4–71.7) and poultry (18%; CI = 12.1–24.9) (Figure 15). Poultry was also the commodity implicated most commonly in outbreaks caused by serotype Typhimurium (36%; CI = 21.9–49), but poultry was not implicated significantly more often than pork or dairy (Figure 16).
The largest percentage of foodborne disease outbreaks caused by STEC was attributed to beef (58%; CI = 50–66.7) (Figure 17). Leafy vegetables were the second most common food commodity associated with outbreaks caused by STEC (17%; CI = 10.9–23.2), but this percentage was not significantly greater than the percentages for dairy or for fruits/nuts, the next most common commodities. There were no significant changes in the observed percentage of outbreaks caused by STEC associated with any commodity during the surveillance period (Figure 18).
Beef was responsible for the highest percentage of outbreaks caused by Clostridium perfringens (41.3%; CI = 35.2–47.5), followed by poultry (30%; CI = 24.1–35.9), and pork (16.3%; CI = 11.7–21.1) (Figure 19). The percentage of outbreaks caused by Clostridium perfringens that was attributed to beef declined over time while poultry-associated outbreaks increased (Figure 20); however, these changes were not significant.
Discussion
Foodborne disease outbreaks remain an important public health burden in the United States. The average annual number of outbreaks reported to CDC during 1998–2008 was more than double the average annual number reported during 1973–1997. This increase reflects in part measures to enhance outbreak surveillance, including transitioning the system to electronic reporting and implementation of routine data cleaning and follow-up procedures with reporting states (4–6). The marked increase in the number of outbreaks reported in 1998 indicates that the increase was largely a surveillance artifact because of the transition to electronic reporting rather than a true increase in the number of foodborne disease outbreaks during 1997–1998 (7) (Figure 21).
Although the total number of foodborne disease outbreaks reported annually declined gradually within the period 1998–2008, there were no consistent national trends in outbreak reporting that contributed to this decline. For 26 of the 42 states evaluated, state outbreak reporting rates were fairly stable or increased in the second half of the surveillance period (2004–2008). A decline in the number of reported outbreaks by one of the most populous states (Florida) accounted for much of the overall decrease in outbreaks reported in 2008 compared with 1998. A portion of the decline in the number of reported outbreaks over this period reflects efforts to improve data quality in certain states, including Florida, by reducing the number of reports that do not meet the definition of a foodborne outbreak. However, this decline might represent a true decrease in the number of foodborne disease outbreaks.
Changes in the number of foodborne disease outbreaks reported by a state also might be caused by changes in resources at state and local health departments. The median number of outbreaks reported by each state was highest nationally in 2004, the year that federal emergency preparedness funding to states peaked (16). In 2006, states reported that 71% of their funding for epidemiologic capacity came from federal sources, and more recent reports have documented declines in capacity as this funding has decreased (17–19).
Among outbreaks with a single confirmed or suspected etiology, the number caused by viruses increased dramatically, with viruses replacing bacterial pathogens as the most common etiology group reported in foodborne disease outbreaks. This increase was likely in large part caused by increased norovirus diagnostic capacity in state health department laboratories (20) and improved strategies to obtain specimens for diagnostic testing (21). The number of outbreaks with unknown etiology decreased proportionately as the number of viral etiology outbreaks increased. The number of foodborne disease outbreaks confirmed to be caused by norovirus during this period highlights the importance of expanded laboratory diagnostics to elucidate outbreak etiologies. The fact that norovirus was among the leading cause of outbreaks across a wide range of foods and settings indicates that reliance solely on routine culture for enteric bacteria is inadequate during foodborne disease outbreak investigations. Since 1997, when CDC began a technical support program to assist state public health laboratories in using reverse transcription-polymerase chain reaction technology, the number of states with such capacity has increased steadily (20). Although all 50 states and the District of Columbia now have capacity for norovirus diagnostics at their respective state public health laboratories, resource limitations and competing priorities continue to hamper consistent, widespread application of these assays.
Although no significant trend was apparent, there were marked increases in norovirus outbreaks during 2004 and 2006, concurrent with the emergence of new norovirus strains within genogroup II genotype 4, which have been associated with worldwide increases in norovirus outbreaks (22). CaliciNet, CDC's laboratory network for genotyping noroviruses implicated in outbreaks, can help provide ongoing surveillance for the emergence of new norovirus strains and potentially identify links between outbreaks associated with common food vehicles. Information about CalciNet is available at http://www.cdc.gov/norovirus/php/reporting.html#surveillance.
The number of multistate foodborne disease outbreaks reported nearly doubled from 1998 to 2008, following the advent of PulseNet (available at http://www.cdc.gov/pulsenet), the national network of public health and food regulatory agencies that perform standardized molecular subtyping for enteric bacteria (23). Although multistate outbreaks represented only 1%–2% of all outbreaks with a known etiology, these outbreaks contributed disproportionately more deaths and hospitalizations than other outbreaks. Coordinated multistate outbreak investigations are resource-intensive at local, state, and federal levels. As molecular subtyping methods become more advanced and available for more pathogens, it is likely that the number of multistate outbreaks detected will continue to increase (23,24). However the vast majority of recognized outbreaks are still local, requiring epidemiology, laboratory, and environmental health capacity at the local and state levels.
Poultry and fish were the commodities associated most commonly with outbreaks; however, the most common food commodities varied by etiology group. For example, poultry and beef were associated most commonly with outbreaks caused by bacteria, leafy vegetables were implicated most commonly in viral outbreaks, and fish was implicated most commonly in scombroid and ciguatoxin outbreaks.
Different attribution percentages are estimated when the number of illnesses is used as the unit of attribution rather than the number of outbreaks. Specifically, when illnesses are used as the unit of attribution, food commodities associated commonly with frequent, small outbreaks have lower attribution percentages, and large but relatively rare outbreaks can drive attribution estimates. For example, although fish is the second most common cause of outbreaks attributed to a single food commodity, fish ranks eighth as a cause of outbreak-associated illnesses because scombroid and ciguatoxin outbreaks associated with fish tend to be small. In contrast, leafy vegetables are implicated commonly in large outbreaks caused by norovirus and are the second most common cause of outbreak-associated illnesses but ranked fifth as a cause of foodborne outbreaks. Other food commodities (e.g., fruits/nuts, vine-stalk vegetables, and dairy) also contribute to a relatively larger percentage of illnesses than outbreaks. These differences are highlighted by the results of a recently published analysis that used information from the outbreaks reported during this surveillance period to estimate the number of domestically acquired foodborne illnesses associated with each commodity (14). Based on the percentage of outbreak-related illnesses associated with each commodity rather than the percentage of outbreaks, the analysis attributed the majority of foodborne illnesses to leafy vegetables, dairy, fruits/nuts, and poultry.
This study examined changes in the percentages of outbreaks associated with specific food commodities over time. The increase in the number of outbreaks caused by norovirus during the surveillance period resulted in an increase over time in the percentage of outbreaks attributed to leafy vegetables. The significant decrease in the percentage of outbreaks attributed to eggs was largely the result of a decrease in the percentage of outbreaks caused by Salmonella attributed to eggs; the number of reported outbreaks caused by Salmonella serotype Enteritidis, a serotype strongly associated with eggs, decreased over the study period, and the number of outbreaks caused by Salmonella serotypes associated less strongly with eggs increased.
Significant changes in source attribution during the surveillance period were not detected among most food commodities. However, robust estimates of foodborne illness source attribution using outbreak data are limited by data quantity and quality. For example, approximately 40% of reports lacked information on implicated food vehicles. Moreover, only half of reported foods could be assigned to one of the 17 defined commodities used in this analysis, often because the implicated food contained ingredients from more than one commodity. This analysis did not use methods to assign foods containing more than one commodity as was done previously (14).
Limitations
The findings in this report are subject to at least three limitations. First, for many reports, information on certain aspects of the outbreak (e.g., the etiology or the implicated food vehicle) is missing or incomplete; conclusions drawn from outbreaks with a confirmed or suspected etiology or food vehicle might not apply to outbreaks of unknown etiology or food source. A lack of information about the specific contaminated ingredients in many of the reports also limited the ability to assign foods to one of the 17 commodities and thus to draw conclusions about the associations between specific food commodities and pathogens. Similarly, because outbreaks in some settings (e.g., restaurants and schools) are more likely to be recognized and investigated, data on the places where outbreaks occurred might not fully reflect the settings in which contaminated food is prepared and consumed. Second, only a small percentage of foodborne illnesses reported each year are identified as associated with outbreaks. For example, in FoodNet sites during 2008, only 7% of Salmonella illnesses and 26% of STEC O157 illnesses were part of a recognized outbreak (3). Outbreaks caused by certain pathogens or vehicles might be more likely to be recognized or investigated. In addition, some illnesses reported as sporadic likely are not recognized as being part of a reported outbreak or are part of undetected outbreaks. All outbreak-related illnesses might not be identified during an investigation, smaller outbreaks might not come to the attention of public health authorities, and some might not be investigated or reported to CDC. Whether the distributions of food vehicles and preparation and consumption settings implicated in foodborne disease outbreaks reflect the same sources of infection and settings of sporadic illnesses is unknown. Consequently, the impact of the assumption that the reported outbreaks and implicated food commodities are a random sample of all outbreaks occurring in the population is uncertain. Thus, interpretation of statistical differences in outbreak reporting and the implicated food commodities contributing to outbreak illnesses over time should be made with caution. Finally, CDC's outbreak surveillance database is dynamic; agencies can submit new reports and can change or delete previous reports whenever new information becomes available. Therefore, the results of this analysis represent data available at a single point in time and might differ from those published earlier or later.
Conclusion
Analysis of foodborne disease outbreak investigations reported by state and local health departments provides information that enhances understanding of the epidemiology of foodborne disease in the United States. These findings underline the importance of targeted prevention measures for the specific foods that are associated with the most outbreaks and illnesses (i.e., beef, poultry, fish, and produce) and provide insights into changes in causes of outbreaks over time (i.e., outbreaks associated with leafy vegetables and dairy increased during the surveillance period, while those associated with eggs decreased). Most foodborne illnesses are preventable, and timely investigation and reporting of foodborne disease outbreaks provides information that might help to reduce foodborne illnesses. Public health agencies, regulatory agencies, and the food industry can use these data to help target efforts to prevent contamination of foods on the farm, in processing, and in restaurants and homes. Continued surveillance for foodborne disease outbreaks is important to understand changes in the foods, settings, and pathogens associated with illness (25). An annual listing of foodborne disease outbreaks reported to CDC is available at http://wwwn.cdc.gov/foodborneoutbreaks.
References
- Scallan E, Griffin PM, Angulo FJ, Tauxe RV, Hoekstra RM. Foodborne illness acquired in the United States—unspecified agents. Emerg Infect Dis 2011;17:16–22.
- Scallan E, Hoekstra RM, Angulo FJ, et al. Foodborne illness acquired in the United States—major pathogens. Emerg Infect Dis 2011;17:7–15.
- CDC. Preliminary FoodNet Data on the incidence of infection with pathogens transmitted commonly through food—10 states, 2008. MMWR 2009;58:333–7.
- Bean NH, Griffin PM, Goulding JS, Ivey CB. Foodborne disease outbreaks, 5-year summary, 1983–1987. MMWR 1990;39(No. SS-1):15–23.
- Bean NH, Goulding JS, Lao C, Angulo FJ. Surveillance for foodborne-disease outbreaks—United States, 1988–1992. MMWR 1996;45(No. SS-5): 15–23.
- Olsen SJ, MacKinnon LC, Goulding JS, Bean NH, Slutsker L. Surveillance for foodborne-disease outbreaks—United States, 1993–1997. MMWR 2000;49(No. SS-1).
- Lynch M, Painter J, Woodruff R, Braden C. Surveillance for foodborne-disease outbreaks—United States, 1998–2002. MMWR 2006;55(No. SS-10).
- CDC. Surveillance for foodborne disease outbreaks—United States, 2006. MMWR 2009;58:609–15.
- CDC. Surveillance for foodborne disease outbreaks—United States, 2007. MMWR 2010;59:973–9.
- CDC. Surveillance for foodborne disease outbreaks—United States, 2008. MMWR 2011;60:1197–202.
- USCensus Bureau. Population estimates. Available at http://www.census.gov/popest/data/index.html. Accessed April 9, 2013.
- Bland M. An introduction to medical statistics. 3rd ed. London, United Kingdom: Oxford University Press; 2000.
- Painter JA, Ayers T, Woodruff R, et al. Recipes for foodborne outbreaks: a scheme for categorizing and grouping implicated foods. Foodborne Pathog Dis 2009;6:1259–64.
- Painter JA, Hoekstra RM, Ayers T, et al. Attribution of foodborne illnesses, hospitalizations, and deaths to food commodities by using outbreak data, United States, 1998–2008. Emerg Infect Dis 2013;19:407–15.
- Barker N. A practical introduction to the bootstrap using the SAS system. Available at http://www.lexjansen.com/phuse/2005/pk/pk02.pdf.
- CDC. The epidemiology workforce in state and local health departments—United States, 2010. MMWR 2012;61:205–8.
- Boulton ML, Lemmings J, Beck AJ. Assessment of epidemiology capacity in state health departments, 2001–2006. J Public Health Manag Pract 2009;15:328–36.
- American Public Health Association. The public health workforce shortage: left unchecked, will we be protected. Washington, DC: American Public Health Association; 2006. Available at http://www.apha.org/NR/rdonlyres/597828BF-9924-4B94-8821-135F665E9D45/0/PublicHealthWorkforceIssueBrief.pdf.
- National Association of County and City Health Officials. Local health department job losses and program cuts: findings from January/February 2010 Survey. Washington, DC: National Association of County and City Health Officials; 2012. Available at http://www.naccho.org/topics/infrastructure/lhdbudget/upload/Job-Losses-and-Program-Cuts-5-10.pdf.
- Widdowson MA, Sulka A, Bulens SN, et al. Norovirus and foodborne disease, United States, 1991–2000. Emerg Infect Dis 2005;11:95–102.
- Jones TF, Bulens SN, Gettner S, et al. Use of stool collection kits delivered to patients can improve confirmation of etiology in foodborne disease outbreaks. Clin Infect Dis 2004;39:1454–9.
- Siebenga JJ, Vennema H, Zheng DP, et al. Norovirus illness is a global problem: emergence and spread of norovirus GII.4 variants, 2001–2007. J Infect Dis 2009;200:802–12.
- Vega E, Barclay L, Gregoricus N, Williams K, Lee D, Vinje J. Novel surveillance network for norovirus gastroenteritis outbreaks, United States. Emerg Infect Dis 2011;17:1389–95.
- Swaminathan B, Barrett TJ, Hunter SB, Tauxe RV. PulseNet: the molecular subtyping network for foodborne bacterial disease surveillance, United States. Emerg Infect Dis 2001;7:382–9.
- CDC. Surveillance for foodborne disease outbreaks—United States, 2009–2010. MMWR 2013;62:41–7.
* The term "pathogen-commodity pair" as used in this report includes reported etiologic agents that are not pathogens, including chemicals and toxins (e.g., pesticides or ciguatoxin).
FIGURE 1. Number* and rate† of foodborne disease outbreaks, by year — Foodborne Disease Outbreak Surveillance System, United States, 1998–2008
* N = 13,405.
† Per 1 million population.
Alternate Text: The figure above shows the number and rate of foodborne disease outbreaks in the United States, during 1998-2008, according to the Foodborne Disease Outbreak Surveillance System. A total of 13,405 foodborne disease outbreaks were reported during this period. Overall, the reported annual national rate of foodborne disease outbreaks was 4.2 outbreaks per 1 million population, ranging from a low of 3.3 in 2005 to a high of 4.8 in 2000.
FIGURE 2. Average annual rate* of foodborne disease outbreaks and number of outbreaks per state† — Foodborne Disease Outbreak Surveillance System, United States, 1998–2008
* Per 1 million population. Cutpoints for outbreak rate categories determined using Jenks Natural Breaks Optimization in ArcGIS.
† N = 14,205. Number on each state is the number of outbreaks reported. Includes 128 multistate outbreaks that are assigned as an outbreak to each state involved. Excludes 25 outbreaks reported by Guam, 26 reported by Puerto Rico, and 2 reported by the Republic of Palau.
Alternate Text: The figure above shows the average annual rate of foodborne disease outbreaks and number of outbreaks per state in the United States, during 1998-2008, according to the Foodborne Disease Outbreak Surveillance System. A total of 14,205 outbreaks were reported; this figure includes 128 multistate outbreaks that were assigned as an outbreak to each state involved. The total number of outbreaks reported by each state during 1998-2008 varied (range: 22-2,055; annual median: 116).
FIGURE 3. Percentage of foodborne disease outbreak reports that included at least one confirmed or suspected etiology, by year — Foodborne Disease Outbreak Surveillance System, United States, 1998–2008*
* N = 7,998.
Alternate Text: The figure above shows the percentage of foodborne disease outbreak reports that included at least one confirmed or suspected etiology in the United States, during 1998-2008, according to the Foodborne Disease Outbreak Surveillance System. The percentage of outbreaks for which an etiology was confirmed or suspected increased from 40% in 1998 to 67% in 2002, after which it remained level.
FIGURE 4. Percentage of confirmed and suspected foodborne disease outbreaks, by etiology group and year — Foodborne Disease Outbreak Surveillance System, United States, 1998–2008*
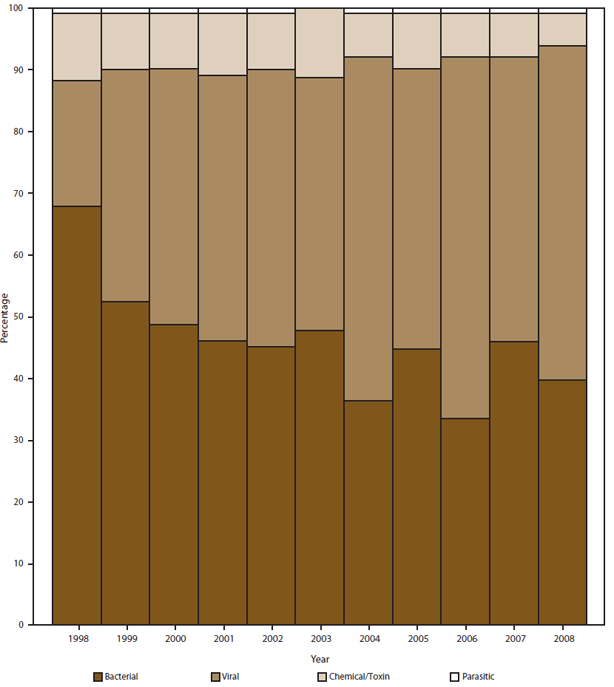
* N = 7,998; does not include 368 multiple etiology outbreaks.
Alternate Text: The figure above shows by etiology group the percentage of confirmed and suspected foodborne disease outbreaks that occurred in the United States during 1998-2008, according to the Foodborne Disease Outbreak Surveillance System. Etiology groups are bacterial, viral, chemical, and parasitic. A total of 7,998 outbreaks were reported; this figure excludes 368 multiple etiology outbreaks.
FIGURE 5. Percentage of Salmonella outbreaks caused by the four most common Salmonella serotypes — Foodborne Disease Outbreak Surveillance System, United States, 1998–2008
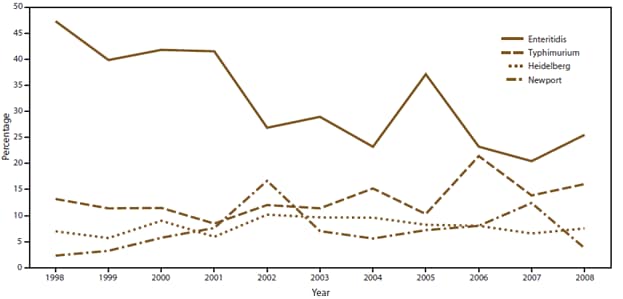
Alternate Text: The figure above shows the percentage of outbreaks caused by Salmonella attributed to the four most common serotypes in the United States, during 1998-2008, according to the Foodborne Disease Outbreak Surveillance System. Percentages varied by serotype. Although the percentage of outbreaks with a confirmed single etiology that were caused by Salmonella remained relatively constant over time (22% during 1998-2000 and 19% during 2006-2008), the percentage of outbreaks caused by Salmonella serotype Enteritidis decreased from 44% during 1998-2000 to 24% during 2006-2008.
FIGURE 6. Number* of multistate foodborne disease outbreaks, by year and pathogen — Foodborne Disease Outbreak Surveillance System, United States, 1998–2008
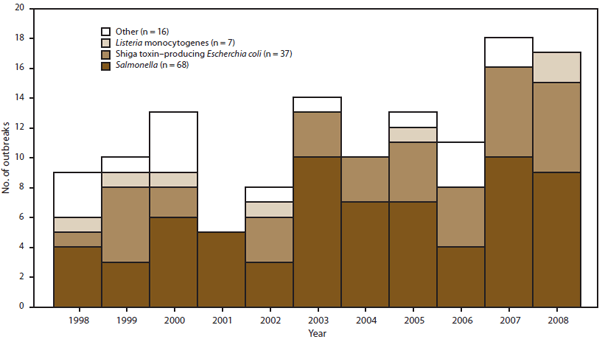
* N = 128.
Alternate Text: The figure above shows by year and pathogen the number of multistate foodborne disease outbreaks that occurred in the United States, during 1998-2008, according to the Foodborne Disease Outbreak Surveillance System. A total of 128 multistate outbreaks occurred during this period. The annual number of multistate outbreaks reported increased from nine in 1998 to 17 in 2008.
FIGURE 7. Median number of foodborne disease outbreaks reported by each state and estimated interquartile range, by year — Foodborne Disease Outbreak Surveillance System, United States, 1998–2008
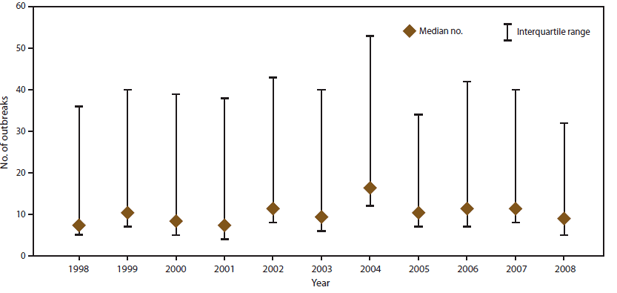
Alternate Text: The figure above shows the median number and interquartile range of foodborne outbreaks reported by each state during 1998-2008, according to the Foodborne Disease Outbreak Surveillance System. Median numbers and interquartile ranges varied by year.
FIGURE 8. Percentage of foodborne disease outbreak reports that included at least one implicated food, by year — Foodborne Disease Outbreak Surveillance System, United States, 1998–2008*
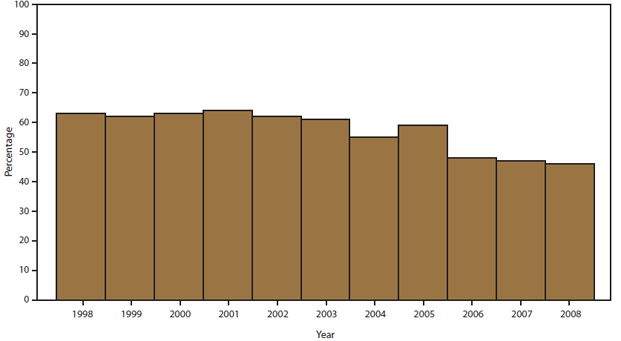
* Of 13,405 outbreaks during 1998–2008, an implicated food was reported for 7,724 outbreaks.
Alternate Text: The figure above shows the percentage of foodborne disease outbreak reports that included at least one implicated food in the United States during 1998-2008, according to the Foodborne Disease Outbreak Surveillance System. Of the 13,405 outbreaks reported during this period, a food was reported for 7,724 outbreaks. Percentages varied by year. The percentage of outbreaks with an implicated food decreased from 63% in 1998 to 46% in 2008.
FIGURE 9. Estimated mean percentage and 95% confidence intervals of foodborne disease outbreaks attributed to each food commodity — Foodborne Disease Outbreak Surveillance System, United States, 1998–2008*
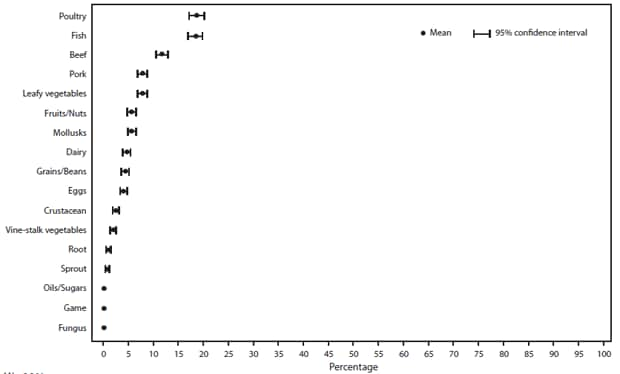
* N = 3,264.
Alternate Text: The figure above shows estimated mean percentage and 95% confidence intervals of foodborne disease outbreaks attributed to each food commodity in the United States during 1998-2008, according to the Foodborne Disease Outbreak Surveillance System. Mean and confidence interval varied by food commodity. The commodities implicated most commonly in outbreaks were poultry (19%), fish (19%), and beef (12%).
FIGURE 10. Estimated mean percentage and 95% confidence intervals of foodborne disease outbreaks attributed to each food commodity, by year interval — Foodborne Disease Outbreak Surveillance System, United States, 1998–2008*
Alternate Text: The figure above shows estimated mean percentage and 95% confidence intervals of foodborne disease outbreaks attributed to each food commodity in the United States during 1998-2008, according to the Foodborne Disease Outbreak Surveillance System, United States, 1998-2008. Mean and confidence interval varied by food commodity.
FIGURE 10. (Continued) Estimated mean percentage and 95% confidence intervals of foodborne disease outbreaks attributed to each food commodity, by year interval — Foodborne Disease Outbreak Surveillance System, United States, 1998–2008*
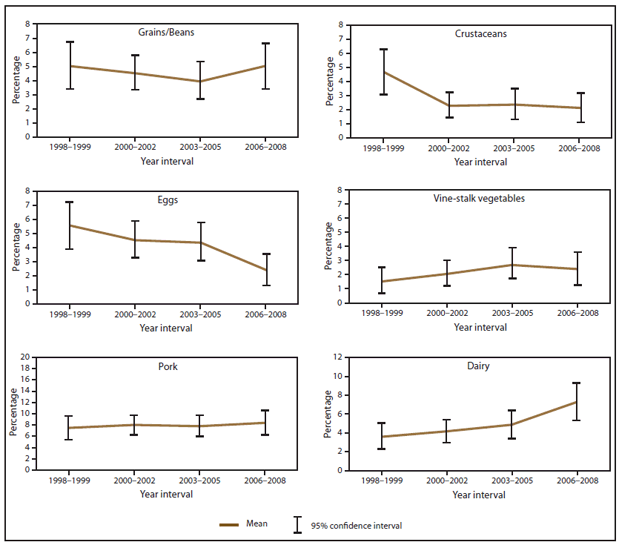
* 1998–1999 = 665 outbreaks; 2000–2002 = 1,029 outbreaks; 2003–2005 = 857 outbreaks; 2006–2008 = 713 outbreaks.
Alternate Text: The figure above shows estimated mean percentage and 95% confidence intervals of foodborne disease outbreaks attributed to each food commodity in the United States during 1998-2008, according to the Foodborne Disease Outbreak Surveillance System, United States, 1998-2008. Mean and confidence interval varied by food commodity.
FIGURE 11. Estimated mean percentage and 95% confidence intervals of foodborne disease outbreaks caused by norovirus attributed to each food commodity — Foodborne Disease Outbreak Surveillance System, United States, 1998–2008*
* N = 439.
Alternate Text: The figure above shows estimated mean percentage and 95% confidence intervals of foodborne disease outbreaks caused by norovirus attributed to each food commodity in the United States during 1998-2008, according to the Foodborne Disease Outbreak Surveillance System. Mean and confidence interval varied by food commodity.
FIGURE 12. Estimated mean percentage and 95% confidence intervals of foodborne disease outbreaks caused by norovirus attributed to selected food commodities, by year interval — Foodborne Disease Outbreak Surveillance System, United States, 1998–2008*
* 1998–1999 = 43 outbreaks; 2000–2002 = 132 outbreaks; 2003–2005 = 135 outbreaks; 2006–2008 = 129 outbreaks.
Alternate Text: The figure above shows estimated mean percentage and 95% confidence intervals of foodborne disease outbreaks caused by norovirus attributed to selected food commodities in the United States during 1998-2008, according to the Foodborne Disease Outbreak Surveillance System. Mean and confidence interval varied by food commodity.
FIGURE 13. Estimated mean percentage and 95% confidence intervals of foodborne disease outbreaks caused by Salmonella attributed to each food commodity — Foodborne Disease Outbreak Surveillance System, United States, 1998–2008*
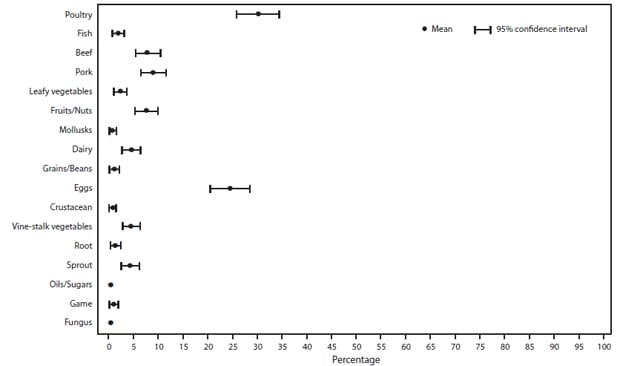
* N = 484.
Alternate Text: The figure above shows estimated mean percentage and 95% confidence intervals of foodborne disease outbreaks caused by Salmonella enterica attributed to each food commodity in the United States,during 1998-2008, according to the Foodborne Disease Outbreak Surveillance System. Mean and confidence interval varied by food commodity.
FIGURE 14. Estimated mean percentage and 95% confidence intervals of foodborne disease outbreaks caused by Salmonella attributed to selected food commodities, by year interval — Foodborne Disease Outbreak Surveillance System, United States, 1998–2008*
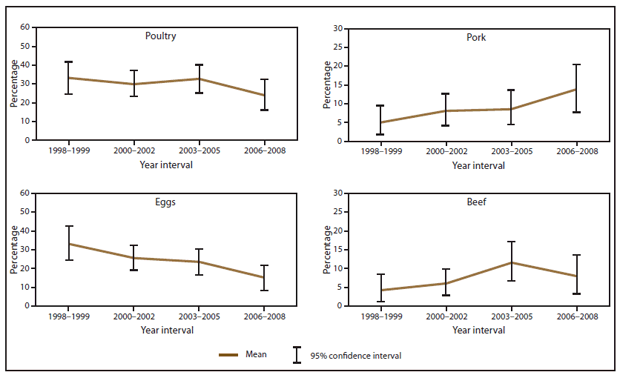
* 1998–1999 = 97 outbreaks; 2000–2002 = 148 outbreaks; 2003–2005 = 138 outbreaks; 2006–2008 = 101 outbreaks.
Alternate Text: The figure above shows estimated mean percentage and 95% confidence intervals of foodborne disease outbreaks caused by Salmonella enterica attributed to selected food commodities in the United State, during 1998-2008, according to the Foodborne Disease Outbreak Surveillance System. Mean and confidence interval varied by food commodity.
FIGURE 15. Estimated mean percentage and 95% confidence intervals of foodborne disease outbreaks caused by Salmonella serotype Enteritidis attributed to each food commodity — Foodborne Disease Outbreak Surveillance System, United States, 1998–2008*
* N = 144.
Alternate Text: The figure above shows estimated mean percentage and 95% confidence intervals of foodborne disease outbreaks caused by Salmonella enterica serotype Enteritidis attributed to each food commodity in the United States during 1998-2008, according to the Foodborne Disease Outbreak Surveillance System. Mean and confidence interval varied by food commodity
FIGURE 16. Estimated mean percentage and 95% confidence intervals of foodborne disease outbreaks caused by Salmonella serotype Typhimurium attributed to each food commodity — Foodborne Disease Outbreak Surveillance System, United States, 1998–2008*
* N = 51.
Alternate Text: The figure above shows estimated mean percentage and 95% confidence intervals of foodborne disease outbreaks caused by Salmonella enterica serotype Typhimurium attributed to each food commodity in the United States during 1998-2008, according to the Foodborne Disease Outbreak Surveillance System, United States. Mean and confidence interval varied by food commodity
FIGURE 17. Estimated mean percentage and 95% confidence intervals of foodborne disease outbreaks caused by Shiga toxin–producing Escherichia coli O157 attributed to each food commodity — Foodborne Disease Outbreak Surveillance System, United States, 1998–2008*
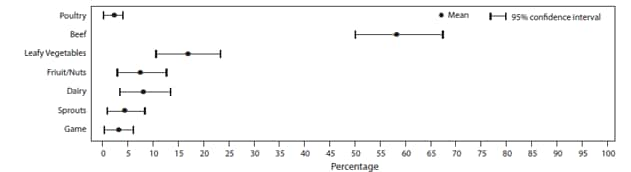
* N = 133.
Alternate Text: The figure above shows estimated mean percentage and 95% confidence intervals of foodborne disease outbreaks caused by Shiga toxin-producing Escherichia coli attributed to each food commodity in the United States during 1998-2008, according to the Foodborne Disease Outbreak Surveillance System. Mean and confidence interval varied by food commodity.
FIGURE 18. Estimated mean percentage and 95% confidence intervals of foodborne disease outbreaks caused by Shiga toxin–producing Escherichia coli O157 attributed to selected food commodities, by year interval — Foodborne Disease Outbreak Surveillance System, United States, 1998–2008*
* 1998–1999 = 25 outbreaks; 2000–2002 = 28 outbreaks; 2003–2005 = 26 outbreaks; 2006–2008 = 54 outbreaks.
Alternate Text: The figure above shows estimated mean percentage and 95% confidence intervals of foodborne disease outbreaks caused by Shiga toxin-producing Escherichia coli O157 attributed to selected food commodities in the United States during 1998-2008, according to the Foodborne Disease Outbreak Surveillance System. Mean and confidence interval varied by food commodity.
FIGURE 19. Estimated mean percentage and 95% confidence intervals of foodborne disease outbreaks caused by Clostridium perfringens attributed to each food commodity — Foodborne Disease Outbreak Surveillance System, United States, 1998–2008*
* N = 234.
Alternate Text: The figure above shows estimated mean percentage and 95% confidence intervals of foodborne disease outbreaks caused by Clostridium perfringens attributed to each food commodity in the United States during 1998-2008, according to the Foodborne Disease Outbreak Surveillance System. Mean and confidence interval varied by food commodity.
FIGURE 20. Estimated mean percentage and 95% confidence intervals of foodborne disease outbreaks caused by Clostridium perfringens attributed to selected food commodities — Foodborne Disease Outbreak Surveillance System, United States, 1998–2008*
* 1998–1999 = 39 outbreaks; 2000–2002 = 74 outbreaks; 2003–2005 = 68 outbreaks; 2006–2008 = 53 outbreaks.
Alternate Text: The figure above shows estimated mean percentage and 95% confidence intervals of foodborne disease outbreaks caused by Clostridium perfringens attributed to selected food commodities in the United States during 1998-2008, according to the Foodborne Disease Outbreak Surveillance System. Mean and confidence interval varied by food commodity
FIGURE 21. Number of reported foodborne disease outbreaks, by year — Foodborne Disease Outbreak Surveillance System, United States, 1973–2008*
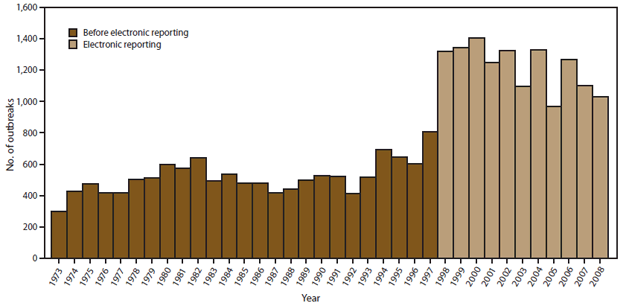
* N = 26,335.
Alternate Text: The figure above shows the number of foodborne disease outbreaks reported each year during 1973-2008, according to the Foodborne Disease Outbreak Surveillance System. The number of reported cases increased substantially with the advent of electronic reporting in 1998.
|
TABLE 1. Number and percentage of foodborne outbreaks and outbreak-associated illnesses, hospitalizations, and deaths, by etiology* — Foodborne Disease Outbreak Surveillance System, United States, 1998–2008 |
||||||||||||||||
|---|---|---|---|---|---|---|---|---|---|---|---|---|---|---|---|---|
|
Etiology |
Outbreaks |
Illnesses |
Hospitalizations |
Deaths |
||||||||||||
|
CE |
SE |
Total† |
CE |
SE |
Total† |
CE |
SE |
Total† |
CE |
SE |
Total† |
|||||
|
No. |
(%) |
No. |
(%) |
No. |
(%) |
No. |
(%) |
|||||||||
|
Bacterial |
||||||||||||||||
|
Bacillus cereus |
56 |
179 |
235 |
(3) |
881 |
1,169 |
2,050 |
(1) |
7 |
10 |
17 |
(0) |
0 |
0 |
0 |
(0) |
|
Brucella spp§ |
4 |
0 |
4 |
(0) |
14 |
0 |
14 |
(0) |
6 |
0 |
6 |
(0) |
0 |
0 |
0 |
(0) |
|
Campylobacter jejuni |
121 |
19 |
140 |
(2) |
4,503 |
78 |
4,581 |
(2) |
84 |
10 |
94 |
(1) |
0 |
0 |
0 |
(0) |
|
Campylobacter spp |
46 |
22 |
68 |
(1) |
509 |
96 |
605 |
(0) |
28 |
7 |
35 |
(0) |
0 |
0 |
0 |
(0) |
|
Clostridium botulinum |
29 |
4 |
33 |
(0) |
106 |
15 |
121 |
(0) |
84 |
4 |
88 |
(1) |
5 |
1 |
6 |
(3) |
|
Clostridium perfringens |
253 |
283 |
536 |
(7) |
13,182 |
7,862 |
21,044 |
(10) |
74 |
14 |
88 |
(1) |
5 |
3 |
8 |
(4) |
|
Escherichia coli, Enterotoxigenic |
13 |
6 |
19 |
(0) |
1,400 |
647 |
2,047 |
(1) |
11 |
3 |
14 |
(0) |
0 |
0 |
0 |
(0) |
|
Escherichia coli, Shiga toxin–producing |
286 |
22 |
308 |
(4) |
6,306 |
319 |
6,625 |
(3) |
1,238 |
33 |
1,271 |
(16) |
21 |
1 |
22 |
(11) |
|
Escherichia coli, other |
1 |
3 |
4 |
(0) |
12 |
10 |
22 |
(0) |
0 |
8 |
8 |
(0) |
0 |
0 |
0 |
(0) |
|
Listeria |
24 |
1 |
25 |
(0) |
350 |
3 |
353 |
(0) |
216 |
0 |
216 |
(3) |
48 |
0 |
48 |
(25) |
|
Salmonella |
1,291 |
158 |
1,449 |
(18) |
37,394 |
1,732 |
39,126 |
(19) |
3,952 |
82 |
4,034 |
(50) |
58 |
2 |
60 |
(31) |
|
Shigella flexneri |
18 |
2 |
20 |
(0) |
1,189 |
4 |
1,193 |
(1) |
55 |
1 |
56 |
(1) |
0 |
0 |
0 |
(0) |
|
Shigella sonnei |
86 |
10 |
96 |
(1) |
4,663 |
248 |
4,911 |
(2) |
117 |
4 |
121 |
(1) |
1 |
0 |
1 |
(1) |
|
Shigella spp |
14 |
4 |
18 |
(0) |
251 |
209 |
460 |
(0) |
19 |
2 |
21 |
(0) |
0 |
0 |
0 |
(0) |
|
Staphylococcus enterotoxin |
167 |
291 |
458 |
(6) |
4,818 |
1,977 |
6,795 |
(3) |
296 |
37 |
333 |
(4) |
3 |
0 |
3 |
(2) |
|
Vibrio parahaemolyticus |
37 |
34 |
71 |
(1) |
1,056 |
165 |
1,221 |
(1) |
22 |
3 |
25 |
(0) |
0 |
0 |
0 |
(0) |
|
Vibrio spp |
5 |
8 |
13 |
(0) |
16 |
17 |
33 |
(0) |
1 |
2 |
3 |
(0) |
0 |
0 |
0 |
(0) |
|
Yersinia enterocolitica |
11 |
0 |
11 |
(0) |
100 |
0 |
100 |
(0) |
8 |
0 |
8 |
(0) |
0 |
0 |
0 |
(0) |
|
Other bacterial |
4 |
101 |
105 |
(1) |
77 |
715 |
792 |
(0) |
4 |
4 |
8 |
(0) |
0 |
0 |
0 |
(0) |
|
Total bacterial |
2,466 |
1,147 |
3,613 |
(45) |
76,827 |
15,266 |
92,093 |
(45) |
6,222 |
224 |
6,446 |
(80) |
141 |
7 |
148 |
(77) |
|
Viral |
||||||||||||||||
|
Astrovirus |
1 |
0 |
1 |
(0) |
14 |
0 |
14 |
(0) |
0 |
0 |
0 |
(0) |
0 |
0 |
0 |
(0) |
|
Hepatitis A |
75 |
1 |
76 |
(1) |
2138 |
4 |
2142 |
(1) |
268 |
0 |
268 |
(3) |
8 |
0 |
8 |
(4) |
|
Norovirus |
1,974 |
1,470 |
3,444 |
(43) |
72,337 |
28,315 |
100,652 |
(49) |
791 |
237 |
1,028 |
(13) |
5 |
0 |
5 |
(3) |
|
Rotavirus |
3 |
7 |
10 |
(0) |
146 |
82 |
228 |
(0) |
0 |
4 |
4 |
(0) |
6 |
1 |
7 |
(4) |
|
Other viral |
8 |
94 |
102 |
(1) |
510 |
2,543 |
3,053 |
(1) |
7 |
18 |
25 |
(0) |
0 |
0 |
0 |
(0) |
|
Total viral |
2,061 |
1,572 |
3,633 |
(45) |
75,145 |
30,944 |
106,089 |
(52) |
1,066 |
259 |
1,325 |
(16) |
19 |
1 |
20 |
(10) |
|
Chemical and toxin |
||||||||||||||||
|
Ciguatoxin |
152 |
23 |
175 |
(2) |
615 |
90 |
705 |
(0) |
65 |
4 |
69 |
(1) |
1 |
0 |
1 |
(1) |
|
Cleaning agents |
0 |
5 |
5 |
(0) |
0 |
18 |
18 |
(0) |
0 |
0 |
0 |
(0) |
0 |
0 |
0 |
(0) |
|
Heavy metals |
8 |
1 |
9 |
(0) |
98 |
6 |
104 |
(0) |
1 |
0 |
1 |
(0) |
0 |
0 |
0 |
(0) |
|
Monosodium glutamate |
1 |
0 |
1 |
(0) |
2 |
0 |
2 |
(0) |
0 |
0 |
0 |
(0) |
0 |
0 |
0 |
(0) |
|
Mycotoxins |
11 |
5 |
16 |
(0) |
72 |
56 |
128 |
(0) |
39 |
11 |
50 |
(1) |
2 |
1 |
3 |
(2) |
|
Neurotoxic shellfish poison |
3 |
3 |
6 |
(0) |
19 |
7 |
26 |
(0) |
10 |
1 |
11 |
(0) |
0 |
0 |
0 |
(0) |
|
Paralytic shellfish poison |
9 |
3 |
12 |
(0) |
28 |
28 |
56 |
(0) |
17 |
7 |
24 |
(0) |
0 |
0 |
0 |
(0) |
|
Pesticides |
2 |
0 |
2 |
(0) |
45 |
0 |
45 |
(0) |
3 |
0 |
3 |
(0) |
0 |
0 |
0 |
(0) |
|
Plant/Herbal toxins |
2 |
1 |
3 |
(0) |
21 |
4 |
25 |
(0) |
7 |
4 |
11 |
(0) |
0 |
0 |
0 |
(0) |
|
Puffer fish tetrodotoxin |
1 |
1 |
2 |
(0) |
2 |
2 |
4 |
(0) |
1 |
2 |
3 |
(0) |
0 |
0 |
0 |
(0) |
|
Scombroid toxin/Histamine |
262 |
71 |
333 |
(4) |
1,042 |
341 |
1,383 |
(1) |
46 |
13 |
59 |
(1) |
0 |
0 |
0 |
(0) |
|
Other chemical |
17 |
97 |
114 |
(1) |
485 |
747 |
1,232 |
(1) |
37 |
7 |
44 |
(1) |
1 |
0 |
1 |
(1) |
|
Other natural toxins |
4 |
3 |
7 |
(0) |
11 |
12 |
23 |
(0) |
4 |
0 |
4 |
(0) |
0 |
0 |
0 |
(0) |
|
Total chemical and toxin |
472 |
213 |
685 |
(9) |
2,440 |
1,311 |
3,751 |
(2) |
230 |
49 |
279 |
(3) |
4 |
1 |
5 |
(3) |
|
Parasitic |
||||||||||||||||
|
Anisaksis |
1 |
0 |
1 |
(0) |
14 |
0 |
14 |
(0) |
0 |
0 |
0 |
(0) |
0 |
0 |
0 |
(0) |
|
Cryptosporidium parvum |
8 |
2 |
10 |
(0) |
308 |
14 |
322 |
(0) |
5 |
0 |
5 |
(0) |
0 |
0 |
0 |
(0) |
|
Cryptosporidium spp |
5 |
0 |
5 |
(0) |
46 |
0 |
46 |
(0) |
2 |
0 |
2 |
(0) |
0 |
0 |
0 |
(0) |
|
Cyclospora cayetanensis |
21 |
3 |
24 |
(0) |
1,289 |
37 |
1,326 |
(1) |
15 |
0 |
15 |
(0) |
0 |
0 |
0 |
(0) |
|
Giardia lamblia |
15 |
1 |
16 |
(0) |
342 |
4 |
346 |
(0) |
0 |
0 |
0 |
(0) |
0 |
0 |
0 |
(0) |
|
Trichinella spiralis |
9 |
0 |
9 |
(0) |
40 |
0 |
40 |
(0) |
9 |
0 |
9 |
(0) |
0 |
0 |
0 |
(0) |
|
Other parasitic |
1 |
1 |
2 |
(0) |
18 |
3 |
21 |
(0) |
2 |
1 |
3 |
(0) |
0 |
0 |
0 |
(0) |
|
Total parasitic |
60 |
7 |
67 |
(1) |
2,057 |
58 |
2115 |
(1) |
33 |
1 |
34 |
(0) |
0 |
0 |
0 |
(0) |
|
Known etiology ¶ |
5,059 |
2,939 |
7,998 |
(60) |
156,469 |
47,579 |
204,048 |
(75) |
7,551 |
533 |
8,084 |
(89) |
164 |
9 |
173 |
(87) |
|
Unknown etiology** |
— †† |
— |
5,039 |
(38) |
— |
— |
60,702 |
(22) |
— |
— |
689 |
(8) |
— |
— |
24 |
(12) |
|
Multiple etiology |
93 |
275 |
368 |
(3) |
4,616 |
3,754 |
8,370 |
(3) |
281 |
55 |
336 |
(4) |
0 |
3 |
3 |
(2) |
|
Total |
5,152 |
3,214 |
13,405 |
(100) |
161,085 |
51,333 |
273,120 |
(100) |
7,832 |
588 |
9,109 |
(100) |
164 |
12 |
200 |
(100) |
|
Abbreviations: CE = confirmed etiology; SE = suspected etiology. * Laboratory and clinical guidelines for confirming an etiology of a foodborne disease outbreak are specific for each bacterial, chemical/toxin, parasitic, and viral agent. Suspected etiologies are those that do not meet the confirmation guidelines (available at http://www.cdc.gov/outbreaknet/references_resources/guide_confirming_diagnosis.html). † Because of rounding procedures, numbers might not add up to the etiology category total or the known etiology total. § Includes all species of a pathogen not otherwise specified individually. ¶ The denominator for the total etiology percentages is the known etiology total. The denominator for the known etiology, unknown etiology, and multiple etiologies percentages is the total. ** An etiologic agent was not confirmed or suspected based on clinical, laboratory, or epidemiologic information. †† No outbreaks in the data reported fall in this category. |
||||||||||||||||
|
TABLE 2. Number of foodborne disease outbreaks and outbreak-associated illnesses, by etiology* and number of places where food was prepared† Foodborne Disease Outbreak Surveillance System, United States, 1998–2008 |
||||||||
|---|---|---|---|---|---|---|---|---|
|
Etiology |
Total attributed to a single preparation location |
Total attributed to multiple preparation locations |
Total attributed to preparation location not known or reported |
Total |
||||
|
No. outbreaks |
No. illnesses |
No. outbreaks |
No. illnesses |
No. outbreaks |
No. illnesses |
No. outbreaks |
No. illnesses |
|
|
Bacterial |
||||||||
|
Bacillus cereus |
220 |
1,803 |
6 |
100 |
9 |
147 |
235 |
2,050 |
|
Brucella spp |
4 |
14 |
— |
— |
— |
— |
4 |
14 |
|
Campylobacter jejuni |
115 |
3,881 |
13 |
606 |
12 |
94 |
140 |
4,581 |
|
Campylobacter spp |
56 |
435 |
5 |
130 |
7 |
40 |
68 |
605 |
|
Clostridium botulinum |
31 |
114 |
1 |
5 |
1 |
2 |
33 |
121 |
|
Clostridium perfringens |
475 |
18,094 |
51 |
2,551 |
10 |
399 |
536 |
21,044 |
|
Escherichia coli, Enterotoxigenic |
14 |
1,832 |
5 |
215 |
— |
— |
19 |
2,047 |
|
Escherichia coli, Shiga toxin–producing |
231 |
4,952 |
46 |
1,211 |
31 |
462 |
308 |
6,625 |
|
Escherichia coli, other |
4 |
22 |
— |
— |
— |
— |
4 |
22 |
|
Listeria |
17 |
250 |
5 |
86 |
3 |
17 |
25 |
353 |
|
Salmonella |
1,147 |
28,468 |
160 |
6,196 |
142 |
4,462 |
1,449 |
39,126 |
|
Shigella flexneri |
18 |
1,142 |
1 |
49 |
1 |
2 |
20 |
1,193 |
|
Shigella sonnei |
72 |
2,564 |
3 |
675 |
21 |
1,672 |
96 |
4,911 |
|
Shigella spp |
14 |
365 |
2 |
56 |
2 |
39 |
18 |
460 |
|
Staphylococcus enterotoxin |
433 |
5,594 |
23 |
542 |
13 |
659 |
469 |
6,795 |
|
Vibrio parahaemolyticus |
63 |
934 |
3 |
266 |
5 |
21 |
71 |
1,221 |
|
Vibrio spp |
12 |
30 |
— |
— |
1 |
3 |
13 |
33 |
|
Yersinia enterocolitica |
8 |
60 |
1 |
4 |
2 |
36 |
11 |
100 |
|
Other bacterial |
88 |
722 |
3 |
44 |
3 |
26 |
94 |
792 |
|
Total bacterial |
3,022 |
71,276 |
328 |
12,736 |
263 |
8,081 |
3,613 |
92,093 |
|
Viral |
||||||||
|
Astrovirus |
1 |
14 |
— |
— |
— |
— |
1 |
14 |
|
Hepatitis A |
60 |
1,903 |
4 |
28 |
12 |
211 |
76 |
2,142 |
|
Norovirus |
2,930 |
82,779 |
373 |
12,017 |
141 |
5,856 |
3,444 |
100,652 |
|
Rotavirus |
9 |
212 |
— |
— |
1 |
16 |
10 |
228 |
|
Other viral |
87 |
2,383 |
6 |
333 |
9 |
337 |
102 |
3,053 |
|
Total viral |
3,087 |
87,291 |
383 |
12,378 |
163 |
6,420 |
3,633 |
106,089 |
|
Chemical and toxin |
||||||||
|
Ciguatoxin |
166 |
663 |
3 |
12 |
6 |
30 |
175 |
705 |
|
Cleaning agents |
5 |
18 |
— |
— |
— |
— |
5 |
18 |
|
Heavy metals |
8 |
102 |
1 |
2 |
— |
— |
9 |
104 |
|
Monosodium glutamate |
1 |
2 |
— |
— |
— |
— |
1 |
2 |
|
Mycotoxins |
14 |
123 |
— |
— |
2 |
5 |
16 |
128 |
|
Neurotoxic shellfish poison |
6 |
26 |
— |
— |
— |
— |
6 |
26 |
|
Paralytic shellfish poison |
9 |
46 |
— |
— |
3 |
10 |
12 |
56 |
|
Pesticides |
2 |
45 |
— |
— |
— |
— |
2 |
45 |
|
Plant/Herbal toxins |
2 |
10 |
— |
— |
1 |
15 |
3 |
25 |
|
Puffer fish tetrodotoxin |
2 |
4 |
— |
— |
— |
— |
2 |
4 |
|
Scombroid toxin/Histamine |
318 |
1,257 |
5 |
66 |
10 |
60 |
333 |
1,383 |
|
Other chemical |
111 |
1,222 |
1 |
2 |
2 |
8 |
114 |
1,232 |
|
Other natural toxins |
6 |
17 |
— |
— |
1 |
6 |
7 |
23 |
|
Total chemical and toxin |
650 |
3,535 |
10 |
82 |
25 |
134 |
685 |
3,751 |
|
Parasitic |
||||||||
|
Anisaksis |
1 |
14 |
— |
— |
— |
— |
1 |
14 |
|
Cryptosporidium spp |
7 |
300 |
1 |
9 |
7 |
59 |
15 |
368 |
|
Cyclospora cayetanensis |
18 |
1,133 |
5 |
176 |
1 |
17 |
24 |
1,326 |
|
Giardia lamblia |
13 |
325 |
1 |
15 |
2 |
6 |
16 |
346 |
|
Trichinella spiralis |
8 |
33 |
1 |
7 |
— |
— |
9 |
40 |
|
Other parasitic |
1 |
3 |
1 |
18 |
— |
— |
2 |
21 |
|
Total parasitic |
48 |
1,808 |
9 |
225 |
10 |
82 |
67 |
2,115 |
|
Known etiology¶ |
6,807 |
163,910 |
730 |
25,421 |
461 |
14,717 |
7,998 |
204,048 |
|
Unknown etiology** |
4,492 |
48,899 |
245 |
4,419 |
302 |
7,384 |
5,039 |
60,702 |
|
Multiple etiology |
328 |
6,788 |
32 |
1,335 |
8 |
247 |
368 |
8,370 |
|
Total |
11,627 |
162,300 |
1,007 |
25,421 |
771 |
16,327 |
13,405 |
273,120 |
|
* Laboratory and clinical guidelines for confirming an etiology of a foodborne disease outbreak are specific for each bacterial, chemical/toxin, parasitic, and viral agent. Suspected etiologies are those that do not meet the confirmation guidelines (available at http://www.cdc.gov/outbreaknet/references_resources/guide_confirming_diagnosis.html). † Reported settings were grouped as follows: restaurant or deli, private home, catering or banquet facility, institutional, other commercial setting, hospital or nursing home, and other private setting (see Table 4). § No outbreaks in the data reported fall in this category. ¶ The denominator for the total etiology percentages is the known etiology total. The denominator for the known etiology, unknown etiology, and multiple etiologies percentages is the total. ** An etiologic agent was not confirmed or suspected based on clinical, laboratory, or epidemiologic information. |
||||||||
|
TABLE 3. Number of foodborne disease outbreaks and outbreak-associated illnesses, by etiology* and place where food was prepared† — Foodborne Disease Outbreak Surveillance System, United States, 1998–2008 |
||||||||||||||||
|---|---|---|---|---|---|---|---|---|---|---|---|---|---|---|---|---|
|
Etiology |
Restaurant or deli |
Private home |
Caterer or banquet facility |
Institutional |
Other commercial setting |
Hospital or nursing home |
Other private setting |
Other |
||||||||
|
NO |
NI |
NO |
NI |
NO |
NI |
NO |
NI |
NO |
NI |
NO |
NI |
NO |
NI |
NO |
NI |
|
|
Bacterial |
||||||||||||||||
|
Bacillus cereus |
189 |
1,062 |
5 |
40 |
8 |
199 |
7 |
337 |
2 |
10 |
— § |
— |
4 |
55 |
5 |
100 |
|
Brucella spp |
— |
— |
— |
— |
— |
— |
— |
— |
3 |
10 |
— |
— |
— |
— |
1 |
4 |
|
Campylobacter jejuni |
40 |
643 |
19 |
185 |
6 |
96 |
7 |
2,032 |
11 |
328 |
— |
— |
4 |
89 |
28 |
508 |
|
Campylobacter spp |
25 |
172 |
6 |
24 |
2 |
14 |
2 |
66 |
4 |
20 |
— |
— |
2 |
24 |
15 |
115 |
|
Clostridium botulinum |
— |
— |
29 |
94 |
— |
— |
— |
— |
1 |
4 |
— |
— |
1 |
16 |
— |
— |
|
Clostridium perfringens |
267 |
4,417 |
39 |
822 |
78 |
4,255 |
51 |
7,043 |
8 |
120 |
3 |
52 |
6 |
146 |
23 |
1,239 |
|
Escherichia coli, Enterotoxigenic |
7 |
154 |
— |
— |
4 |
1,033 |
1 |
300 |
— |
— |
— |
— |
— |
— |
2 |
345 |
|
Escherichia coli, Shiga toxin–producing |
86 |
2,241 |
57 |
953 |
2 |
33 |
28 |
849 |
18 |
269 |
3 |
51 |
10 |
161 |
27 |
395 |
|
Escherichia coli, other |
2 |
7 |
1 |
12 |
— |
— |
— |
— |
1 |
3 |
— |
— |
— |
— |
— |
— |
|
Listeria |
3 |
35 |
2 |
12 |
— |
— |
— |
— |
8 |
79 |
2 |
11 |
— |
— |
2 |
113 |
|
Salmonella |
623 |
13,098 |
232 |
3,510 |
46 |
1,711 |
61 |
3,651 |
51 |
2,550 |
32 |
622 |
23 |
774 |
79 |
2,552 |
|
Shigella flexneri |
16 |
1,083 |
— |
— |
— |
— |
— |
— |
— |
— |
— |
— |
1 |
52 |
1 |
7 |
|
Shigella sonnei |
49 |
1,597 |
9 |
128 |
4 |
75 |
6 |
220 |
1 |
494 |
— |
— |
2 |
31 |
1 |
19 |
|
Shigella spp |
10 |
116 |
— |
— |
— |
— |
1 |
200 |
— |
— |
— |
— |
— |
— |
3 |
49 |
|
Staphylococcus enterotoxin |
312 |
2,163 |
32 |
717 |
21 |
881 |
27 |
782 |
18 |
192 |
3 |
109 |
11 |
478 |
9 |
272 |
|
Vibrio parahaemolyticus |
50 |
467 |
6 |
19 |
— |
— |
— |
— |
2 |
4 |
— |
— |
1 |
14 |
4 |
430 |
|
Vibrio spp |
9 |
20 |
1 |
6 |
— |
— |
— |
— |
— |
— |
— |
— |
— |
— |
2 |
4 |
|
Yersinia enterocolitica |
2 |
14 |
5 |
32 |
1 |
14 |
— |
— |
— |
— |
— |
— |
— |
— |
— |
— |
|
Other bacterial |
63 |
423 |
6 |
92 |
3 |
99 |
2 |
47 |
8 |
31 |
1 |
6 |
— |
— |
5 |
24 |
|
Total bacterial |
1,753 |
27,712 |
449 |
6,646 |
175 |
8,410 |
193 |
15,527 |
136 |
4,114 |
44 |
851 |
65 |
1,840 |
207 |
6,176 |
|
Viral |
||||||||||||||||
|
Astrovirus |
1 |
14 |
— |
— |
— |
— |
— |
— |
— |
— |
— |
— |
— |
— |
— |
— |
|
Hepatitis A |
49 |
1,832 |
1 |
2 |
1 |
8 |
3 |
15 |
2 |
6 |
— |
— |
— |
— |
4 |
40 |
|
Norovirus |
1,885 |
41,354 |
183 |
2,988 |
318 |
11,714 |
184 |
11,860 |
67 |
1,451 |
83 |
3,366 |
22 |
645 |
188 |
9,401 |
|
Rotavirus |
5 |
42 |
— |
— |
1 |
30 |
1 |
108 |
— |
— |
2 |
32 |
— |
— |
— |
— |
|
Other viral |
52 |
980 |
3 |
44 |
16 |
839 |
1 |
18 |
2 |
25 |
3 |
48 |
— |
— |
10 |
429 |
|
Total viral |
1,992 |
44,222 |
187 |
3,034 |
336 |
12,591 |
189 |
12,001 |
71 |
1,482 |
88 |
3,446 |
22 |
645 |
202 |
9,870 |
|
Chemical and toxin |
||||||||||||||||
|
Ciguatoxin |
19 |
137 |
135 |
468 |
— |
— |
5 |
16 |
3 |
10 |
— |
— |
1 |
3 |
3 |
29 |
|
Cleaning agents |
3 |
7 |
— |
— |
— |
— |
1 |
4 |
— |
— |
— |
— |
— |
— |
1 |
7 |
|
Heavy metals |
3 |
18 |
1 |
6 |
— |
— |
1 |
21 |
3 |
57 |
— |
— |
— |
— |
— |
— |
|
Monosodium glutamate |
1 |
2 |
— |
— |
— |
— |
— |
— |
— |
— |
— |
— |
— |
— |
— |
— |
|
Mycotoxins |
— |
— |
11 |
48 |
— |
— |
1 |
29 |
2 |
46 |
— |
— |
— |
— |
— |
— |
|
Neurotoxic shellfish poison |
1 |
2 |
5 |
24 |
— |
— |
— |
— |
— |
— |
— |
— |
— |
— |
— |
— |
|
Paralytic shellfish poison |
— |
— |
8 |
40 |
— |
— |
— |
— |
— |
— |
— |
— |
— |
— |
1 |
6 |
|
Pesticides |
1 |
31 |
1 |
14 |
— |
— |
— |
— |
— |
— |
— |
— |
— |
— |
— |
— |
|
Plant/Herbal toxins |
— |
— |
2 |
10 |
— |
— |
— |
— |
— |
— |
— |
— |
— |
— |
— |
— |
|
Puffer fish tetrodotoxin |
1 |
2 |
1 |
2 |
— |
— |
— |
— |
— |
— |
— |
— |
— |
— |
— |
— |
|
Scombroid toxin/Histamine |
256 |
876 |
26 |
77 |
3 |
34 |
11 |
112 |
8 |
30 |
2 |
7 |
1 |
8 |
11 |
113 |
|
Other chemical |
63 |
373 |
10 |
57 |
2 |
33 |
11 |
427 |
14 |
124 |
— |
— |
2 |
149 |
9 |
59 |
|
Other natural toxins |
3 |
8 |
3 |
9 |
— |
— |
— |
— |
— |
— |
— |
— |
— |
— |
— |
— |
|
Total chemical and toxin |
351 |
1,456 |
203 |
755 |
5 |
67 |
30 |
609 |
30 |
267 |
2 |
7 |
4 |
160 |
25 |
214 |
|
Parasitic |
||||||||||||||||
|
Anisaksis |
— |
— |
1 |
14 |
— |
— |
— |
— |
— |
— |
— |
— |
— |
— |
— |
— |
|
Cryptosporidium spp |
1 |
12 |
2 |
13 |
1 |
37 |
— |
— |
1 |
6 |
— |
— |
— |
— |
2 |
232 |
|
Cyclospora cayetanensis |
7 |
737 |
2 |
7 |
5 |
236 |
— |
— |
2 |
11 |
1 |
116 |
— |
— |
1 |
26 |
|
Giardia lamblia |
6 |
92 |
2 |
9 |
— |
— |
2 |
86 |
— |
— |
— |
— |
1 |
48 |
2 |
90 |
|
Trichinella spiralis |
— |
— |
4 |
14 |
— |
— |
— |
— |
— |
— |
— |
— |
— |
— |
4 |
19 |
|
Other parasitic |
— |
— |
— |
— |
— |
— |
— |
— |
1 |
3 |
— |
— |
— |
— |
— |
— |
|
Total parasitic |
14 |
841 |
11 |
57 |
6 |
273 |
2 |
86 |
4 |
20 |
1 |
116 |
1 |
48 |
9 |
367 |
|
Known etiology¶ |
4,110 |
74,231 |
850 |
10,492 |
522 |
21,341 |
414 |
28,223 |
241 |
5,883 |
135 |
4,420 |
92 |
2,693 |
443 |
16,627 |
|
Unknown etiology** |
3,608 |
25,407 |
180 |
1,896 |
245 |
6,028 |
160 |
10,067 |
106 |
1,140 |
18 |
361 |
12 |
333 |
163 |
3,667 |
|
Multiple etiology |
221 |
2,453 |
28 |
574 |
27 |
1,483 |
17 |
1,043 |
15 |
432 |
2 |
150 |
4 |
79 |
14 |
574 |
|
Total |
7,939 |
102,091 |
1,058 |
12,962 |
794 |
28,852 |
591 |
39,333 |
362 |
7,455 |
155 |
4,931 |
108 |
3,105 |
620 |
20,868 |
|
Abbreviations: NO = number of outbreaks; NI = number of illnesses. * Laboratory and clinical guidelines for confirming an etiology of a foodborne disease outbreak are specific for each bacterial, chemical/toxin, parasitic, and viral agent. Suspected etiologies are those that do not meet the confirmation guidelines (available at http://www.cdc.gov/outbreaknet/references_resources/guide_confirming_diagnosis.html). † Reported settings were grouped as follows: restaurant or deli, private home, catering or banquet facility, institutional, other commercial setting, hospital or nursing home, and other private setting (see Table 4). § No outbreaks in the data reported fall in this category. ¶ The denominator for the total etiology percentages is the known etiology total. The denominator for the known etiology, unknown etiology, and multiple etiologies percentages is the total. ** An etiologic agent was not confirmed or suspected based on clinical, laboratory, or epidemiologic information. |
||||||||||||||||
|
TABLE 6. Number of foodborne disease outbreaks and outbreak-associated Illnesses, by etiology* and food commodity status — Foodborne Disease Outbreak Surveillance System, United States, 1998–2008 |
||||||||
|---|---|---|---|---|---|---|---|---|
|
Etiology |
Outbreaks (illnesses) |
|||||||
|
Attributed to a single commodity |
Attributed to food vehicle containing >1 commodity |
Not attributed to a commodity |
Total |
|||||
|
No. outbreaks |
No. illnesses |
No. outbreaks |
No. illnesses |
No. outbreaks |
No. illnesses |
No. outbreaks |
No. illnesses |
|
|
Bacterial |
||||||||
|
Bacillus cereus |
77 |
807 |
119 |
838 |
39 |
405 |
235 |
2,050 |
|
Brucella spp |
4 |
14 |
— † |
— |
— |
— |
4 |
14 |
|
Campylobacter jejuni |
77 |
3,726 |
23 |
430 |
40 |
425 |
140 |
4,581 |
|
Campylobacter spp |
27 |
193 |
11 |
110 |
30 |
302 |
68 |
605 |
|
Clostridium botulinum |
18 |
55 |
9 |
44 |
6 |
22 |
33 |
121 |
|
Clostridium perfringens |
234 |
9,109 |
226 |
9,681 |
76 |
2,254 |
536 |
21,044 |
|
Escherichia coli, Enterotoxigenic |
2 |
366 |
8 |
1,450 |
9 |
231 |
19 |
2,047 |
|
Escherichia coli, Shiga toxin–producing |
133 |
3,818 |
60 |
978 |
115 |
1,829 |
308 |
6,625 |
|
Escherichia coli, other |
1 |
12 |
2 |
7 |
1 |
3 |
4 |
22 |
|
Listeria |
14 |
206 |
6 |
119 |
5 |
28 |
25 |
353 |
|
Salmonella |
484 |
15,743 |
392 |
13,488 |
573 |
9,895 |
1,449 |
39,126 |
|
Shigella flexneri |
4 |
948 |
6 |
134 |
10 |
111 |
20 |
1,193 |
|
Shigella sonnei |
17 |
913 |
27 |
1,566 |
52 |
2,432 |
96 |
4,911 |
|
Shigella spp |
4 |
10 |
4 |
290 |
10 |
160 |
18 |
460 |
|
Staphylococcus enterotoxin |
146 |
2,553 |
232 |
3,234 |
91 |
1,008 |
469 |
6,795 |
|
Vibrio parahaemolyticus |
54 |
1,115 |
15 |
102 |
2 |
4 |
71 |
1,221 |
|
Vibrio spp |
11 |
28 |
1 |
2 |
1 |
3 |
13 |
33 |
|
Yersinia enterocolitica |
7 |
68 |
1 |
9 |
3 |
23 |
11 |
100 |
|
Other bacterial |
17 |
253 |
30 |
295 |
47 |
244 |
94 |
792 |
|
Total bacterial |
1,331 |
39,937 |
1,172 |
32,777 |
1,110 |
19,379 |
3,613 |
92,093 |
|
Viral |
|
|
|
|
|
|
||
|
Astrovirus |
— |
— |
— |
— |
1 |
14 |
1 |
14 |
|
Hepatitis A |
13 |
1,140 |
15 |
176 |
48 |
826 |
76 |
2,142 |
|
Norovirus |
439 |
11,814 |
977 |
28,901 |
2,028 |
59,937 |
3,444 |
100,652 |
|
Rotavirus |
2 |
7 |
3 |
141 |
5 |
80 |
10 |
228 |
|
Other viral |
12 |
150 |
22 |
393 |
68 |
2,510 |
102 |
3,053 |
|
Total viral |
466 |
13,111 |
1,017 |
29,611 |
2,150 |
63,367 |
3,633 |
106,089 |
|
Chemical and toxin |
|
|
|
|
|
|
||
|
Ciguatoxin |
172 |
696 |
2 |
7 |
1 |
2 |
175 |
705 |
|
Cleaning agents |
— |
— |
1 |
3 |
4 |
15 |
5 |
18 |
|
Heavy metals |
3 |
33 |
3 |
10 |
3 |
61 |
9 |
104 |
|
Monosodium glutamate |
— |
— |
— |
— |
1 |
2 |
1 |
2 |
|
Mycotoxins |
15 |
121 |
1 |
7 |
— |
— |
16 |
128 |
|
Neurotoxic shellfish poison |
5 |
24 |
1 |
2 |
— |
— |
6 |
26 |
|
Paralytic shellfish poison |
12 |
56 |
— |
— |
— |
— |
12 |
56 |
|
Pesticides |
1 |
14 |
1 |
31 |
— |
— |
2 |
45 |
|
Plant/Herbal toxins |
1 |
6 |
1 |
15 |
1 |
4 |
3 |
25 |
|
Puffer fish tetrodotoxin |
— |
— |
2 |
4 |
— |
— |
2 |
4 |
|
Scombroid toxin/Histamine |
318 |
1,330 |
14 |
51 |
1 |
2 |
333 |
1,383 |
|
Other chemical |
31 |
244 |
39 |
404 |
44 |
584 |
114 |
1,232 |
|
Other natural toxins |
6 |
17 |
— |
— |
1 |
6 |
7 |
23 |
|
Total chemical and toxin |
564 |
2,541 |
65 |
534 |
56 |
676 |
685 |
3,751 |
|
Parasitic |
|
|
|
|
|
|
||
|
Anisaksis |
1 |
14 |
— |
— |
— |
— |
1 |
14 |
|
Cryptosporidium parvum |
1 |
144 |
1 |
8 |
8 |
170 |
10 |
322 |
|
Cryptosporidium spp |
— |
— |
1 |
5 |
4 |
41 |
5 |
46 |
|
Cyclospora cayetanensis |
12 |
938 |
5 |
229 |
7 |
159 |
24 |
1,326 |
|
Giardia lamblia |
1 |
3 |
3 |
71 |
12 |
272 |
16 |
346 |
|
Trichinella spiralis |
7 |
35 |
1 |
3 |
1 |
2 |
9 |
40 |
|
Other parasitic |
1 |
18 |
1 |
3 |
— |
— |
2 |
21 |
|
Total parasitic |
23 |
1,152 |
12 |
319 |
32 |
644 |
67 |
2,115 |
|
Known etiology§ |
2,384 |
56,741 |
2,266 |
63,241 |
3,348 |
84,066 |
7,998 |
204,048 |
|
Unknown etiology¶ |
791 |
8,318 |
1,528 |
16,553 |
2,720 |
35,831 |
5,039 |
60,702 |
|
Multiple etiology |
89 |
2,693 |
129 |
3,246 |
150 |
2,431 |
368 |
8,370 |
|
Total |
3,264 |
67,752 |
3,923 |
83,040 |
6,218 |
122,328 |
13,405 |
273,120 |
|
* Laboratory and clinical guidelines for confirming an etiology of a foodborne disease outbreak are specific for each bacterial, chemical/toxin, parasitic, and viral agent. Suspected etiologies are those that do not meet the confirmation guidelines (available at http://www.cdc.gov/outbreaknet/references_resources/guide_confirming_diagnosis.html). † No outbreaks in the data reported fall in this category. § The denominator for the total etiology percentages is the known etiology total. The denominator for the known etiology, unknown etiology, and multiple etiologies percentages is the total. ¶ An etiologic agent was not confirmed or suspected based on clinical, laboratory, or epidemiologic information. |
||||||||
|
TABLE 7. Number of foodborne disease outbreaks and outbreak-associated illnesses attributed to aquatic animals, by etiology* — Foodborne Disease Outbreak Surveillance System, United States, 1998–2008 |
||||||
|---|---|---|---|---|---|---|
|
Etiology |
Fish |
Shellfish |
||||
|
Crustacean |
Mollusks |
|||||
|
No. outbreaks |
No. illnesses |
No. outbreaks |
No. illnesses |
No. outbreaks |
No. illnesses |
|
|
Bacterial |
||||||
|
Bacillus cereus |
2 |
9 |
1 |
118 |
— † |
— |
|
Brucella spp |
— |
— |
— |
— |
— |
— |
|
Campylobacter jejuni |
— |
— |
— |
— |
3 |
273 |
|
Campylobacter spp |
1 |
3 |
— |
— |
— |
— |
|
Clostridium botulinum |
10 |
32 |
— |
— |
— |
— |
|
Clostridium perfringens |
— |
— |
1 |
55 |
— |
— |
|
Escherichia coli, Enterotoxigenic |
— |
— |
— |
— |
— |
— |
|
Escherichia coli, Shiga toxin–producing |
— |
— |
— |
— |
— |
— |
|
Escherichia coli, other |
— |
— |
— |
— |
1 |
12 |
|
Listeria |
— |
— |
— |
— |
— |
— |
|
Salmonella |
9 |
223 |
3 |
13 |
3 |
31 |
|
Shigella flexneri |
— |
— |
— |
— |
— |
— |
|
Shigella sonnei |
2 |
55 |
— |
— |
— |
— |
|
Shigella spp |
— |
— |
— |
— |
2 |
6 |
|
Staphylococcus enterotoxin |
5 |
12 |
6 |
31 |
5 |
16 |
|
Vibrio parahaemolyticus |
— |
— |
15 |
242 |
38 |
826 |
|
Vibrio spp |
1 |
2 |
1 |
6 |
9 |
20 |
|
Yersinia enterocolitica |
— |
— |
— |
— |
— |
— |
|
Other bacterial |
1 |
5 |
— |
— |
3 |
8 |
|
Total bacterial |
31 |
341 |
27 |
465 |
64 |
1,192 |
|
Viral |
|
|
|
|
|
|
|
Astrovirus |
— |
— |
— |
— |
— |
— |
|
Hepatitis A |
— |
— |
— |
— |
2 |
46 |
|
Norovirus |
6 |
453 |
4 |
62 |
55 |
751 |
|
Rotavirus |
1 |
5 |
— |
— |
1 |
2 |
|
Other viral |
— |
— |
1 |
3 |
3 |
21 |
|
Total viral |
7 |
458 |
5 |
65 |
61 |
820 |
|
Chemical and toxin |
|
|
|
|
|
|
|
Ciguatoxin |
172 |
696 |
— |
— |
— |
— |
|
Cleaning agents |
— |
— |
— |
— |
— |
— |
|
Heavy metals |
1 |
2 |
— |
— |
— |
— |
|
Monosodium glutamate |
— |
— |
— |
— |
— |
— |
|
Mycotoxins |
— |
— |
— |
— |
— |
— |
|
Neurotoxic shellfish poison |
— |
— |
1 |
2 |
4 |
22 |
|
Paralytic shellfish poison |
5 |
30 |
— |
— |
7 |
26 |
|
Pesticides |
— |
— |
— |
— |
— |
— |
|
Plant/Herbal toxins |
— |
— |
— |
— |
— |
— |
|
Puffer fish tetrodotoxin |
— |
— |
— |
— |
— |
— |
|
Scombroid toxin/Histamine |
317 |
1,321 |
1 |
9 |
— |
— |
|
Other chemical |
8 |
40 |
2 |
5 |
— |
— |
|
Other natural toxins |
3 |
9 |
— |
— |
— |
— |
|
Total chemical and toxin |
506 |
2,098 |
4 |
16 |
11 |
48 |
|
Parasitic |
|
|
|
|
|
|
|
Anisaksis |
1 |
14 |
— |
— |
— |
— |
|
Cryptosporidium parvum |
— |
— |
— |
— |
— |
— |
|
Cyclospora cayetanensis |
— |
— |
— |
— |
— |
— |
|
Giardia lamblia |
— |
— |
— |
— |
1 |
3 |
|
Trichinella spiralis |
— |
— |
— |
— |
— |
— |
|
Other parasitic |
— |
— |
1 |
18 |
— |
— |
|
Total parasitic |
1 |
14 |
1 |
18 |
1 |
3 |
|
Known etiology§ |
545 |
2,911 |
37 |
564 |
137 |
2,063 |
|
Unknown etiology¶ |
58 |
267 |
50 |
291 |
53 |
283 |
|
Multiple etiology |
5 |
141 |
2 |
12 |
2 |
147 |
|
Total |
608 |
3,319 |
89 |
867 |
192 |
2,493 |
|
* Laboratory and clinical guidelines for confirming an etiology of a foodborne disease outbreak are specific for each bacterial, chemical/toxin, parasitic, and viral agent. Suspected etiologies are those that do not meet the confirmation guidelines (available at http://www.cdc.gov/outbreaknet/references_resources/guide_confirming_diagnosis.html). † No outbreaks in the data reported fall in this category. § The denominator for the total etiology percentages is the known etiology total. The denominator for the known etiology, unknown etiology, and multiple etiologies percentages is the total. ¶ An etiologic agent was not confirmed or suspected based on clinical, laboratory, or epidemiologic information. |
||||||
|
TABLE 8. Number of foodborne disease outbreaks and outbreak-associated illnesses attributed to land animals, by etiology* — Foodborne Disease Outbreak Surveillance System, United States, 1998–2008 |
||||||||||||
|---|---|---|---|---|---|---|---|---|---|---|---|---|
|
Etiology |
Dairy |
Eggs |
Beef |
Game |
Pork |
Poultry |
||||||
|
No. outbreaks |
No. illnesses |
No. outbreaks |
No. illnesses |
No. outbreaks |
No. illnesses |
No. outbreaks |
No. illnesses |
No. outbreaks |
No. illnesses |
No. outbreaks |
No. illnesses |
|
|
Bacterial |
||||||||||||
|
Bacillus cereus |
2 |
18 |
— † |
— |
4 |
100 |
— |
— |
4 |
94 |
15 |
132 |
|
Brucella spp |
4 |
14 |
— |
— |
— |
— |
— |
— |
— |
— |
— |
— |
|
Campylobacter jejuni |
46 |
2,690 |
— |
— |
— |
— |
1 |
2 |
— |
— |
16 |
110 |
|
Campylobacter spp |
16 |
87 |
— |
— |
— |
— |
— |
— |
1 |
27 |
6 |
53 |
|
Clostridium botulinum |
— |
— |
— |
— |
— |
— |
1 |
4 |
|
|
|
|
|
Clostridium perfringens |
1 |
24 |
2 |
38 |
96 |
2,963 |
— |
— |
38 |
972 |
71 |
3,452 |
|
Escherichia coli, Enterotoxigenic |
|
|
— |
— |
— |
— |
— |
— |
— |
— |
— |
— |
|
Escherichia coli, Shiga toxin–producing |
11 |
324 |
— |
— |
78 |
1,611 |
4 |
25 |
— |
— |
2 |
38 |
|
Escherichia coli, other |
— |
— |
— |
— |
— |
— |
— |
— |
— |
— |
|
|
|
Listeria |
6 |
52 |
— |
— |
1 |
4 |
— |
— |
1 |
3 |
5 |
127 |
|
Salmonella |
21 |
682 |
117 |
2,938 |
37 |
1,138 |
4 |
48 |
43 |
1,043 |
145 |
2,580 |
|
Shigella flexneri |
1 |
7 |
— |
— |
1 |
49 |
— |
— |
— |
— |
— |
— |
|
Shigella sonnei |
1 |
77 |
1 |
5 |
2 |
32 |
— |
— |
— |
— |
4 |
54 |
|
Shigella spp |
1 |
2 |
— |
— |
— |
— |
— |
— |
1 |
2 |
— |
— |
|
Staphylococcus enterotoxin |
4 |
15 |
1 |
15 |
18 |
278 |
2 |
9 |
56 |
1,420 |
39 |
655 |
|
Vibrio parahaemolyticus |
— |
— |
— |
— |
— |
— |
— |
— |
— |
— |
1 |
47 |
|
Vibrio spp |
— |
— |
— |
— |
— |
— |
— |
— |
— |
— |
— |
— |
|
Yersinia enterocolitica |
— |
— |
— |
— |
— |
— |
— |
— |
7 |
68 |
— |
— |
|
Other bacterial |
2 |
8 |
— |
— |
4 |
119 |
— |
— |
1 |
16 |
5 |
82 |
|
Total bacterial |
116 |
4,000 |
121 |
2,996 |
241 |
6,294 |
12 |
88 |
152 |
3,645 |
309 |
7,330 |
|
Viral |
|
|
|
|
|
|
|
|
|
|
|
|
|
Astrovirus |
— |
— |
— |
— |
— |
— |
— |
— |
— |
— |
— |
— |
|
Hepatitis A |
— |
— |
— |
— |
— |
— |
— |
— |
— |
— |
— |
— |
|
Norovirus |
16 |
862 |
3 |
61 |
25 |
398 |
1 |
17 |
26 |
564 |
40 |
645 |
|
Rotavirus |
— |
— |
— |
— |
— |
— |
— |
— |
— |
— |
— |
— |
|
Other viral |
1 |
6 |
— |
— |
1 |
2 |
— |
— |
— |
— |
— |
— |
|
Total viral |
17 |
868 |
3 |
61 |
26 |
400 |
1 |
17 |
26 |
564 |
40 |
645 |
|
Chemical and toxin |
|
|
|
|
|
|
|
|
|
|
|
|
|
Ciguatoxin |
— |
— |
— |
— |
— |
— |
— |
— |
— |
— |
— |
— |
|
Cleaning agents |
— |
— |
— |
— |
— |
— |
— |
— |
— |
— |
— |
— |
|
Heavy metals |
— |
— |
— |
— |
— |
— |
— |
— |
— |
— |
— |
— |
|
Monosodium glutamate |
— |
— |
— |
— |
— |
— |
— |
— |
— |
— |
— |
— |
|
Mycotoxins |
— |
— |
— |
— |
— |
— |
— |
— |
— |
— |
— |
— |
|
Neurotoxic shellfish poison |
— |
— |
— |
— |
— |
— |
— |
— |
— |
— |
— |
— |
|
Paralytic shellfish poison |
— |
— |
— |
— |
— |
— |
— |
— |
— |
— |
— |
— |
|
Pesticides |
— |
— |
— |
— |
— |
— |
— |
— |
— |
— |
— |
— |
|
Plant/Herbal toxins |
— |
— |
— |
— |
— |
— |
— |
— |
— |
— |
— |
— |
|
Puffer fish tetrodotoxin |
— |
— |
— |
— |
— |
— |
— |
— |
— |
— |
— |
— |
|
Scombroid toxin/Histamine |
— |
— |
— |
— |
— |
— |
— |
— |
— |
— |
— |
— |
|
Other chemical |
— |
— |
— |
— |
— |
— |
1 |
15 |
— |
— |
3 |
116 |
|
Other natural toxins |
— |
— |
— |
— |
— |
— |
— |
— |
1 |
2 |
|
|
|
Total chemical and toxin |
— |
— |
— |
— |
— |
— |
1 |
15 |
1 |
2 |
3 |
116 |
|
Parasitic |
|
|
|
|
|
|
|
|
|
|
|
|
|
Anisaksis |
— |
— |
— |
— |
— |
— |
— |
— |
— |
— |
— |
— |
|
Cryptosporidium parvum |
— |
— |
— |
— |
— |
— |
— |
— |
— |
— |
— |
— |
|
Cyclospora cayetanensis |
— |
— |
— |
— |
— |
— |
— |
— |
— |
— |
— |
— |
|
Giardia lamblia |
— |
— |
— |
— |
— |
— |
— |
— |
— |
— |
— |
— |
|
Trichinella spiralis |
— |
— |
— |
— |
— |
— |
6 |
28 |
1 |
7 |
— |
— |
|
Other parasitic |
— |
— |
— |
— |
— |
— |
— |
— |
— |
— |
— |
— |
|
Total parasitic |
— |
— |
— |
— |
— |
— |
6 |
28 |
1 |
7 |
— |
— |
|
Known etiology§ |
133 |
4,868 |
124 |
3,057 |
267 |
6,694 |
20 |
148 |
180 |
4,218 |
352 |
8,091 |
|
Unknown etiology¶ |
25 |
153 |
13 |
93 |
108 |
1,110 |
1 |
2 |
70 |
761 |
235 |
2,588 |
|
Multiple etiology |
3 |
110 |
1 |
157 |
14 |
229 |
— |
— |
10 |
150 |
29 |
623 |
|
Total |
161 |
5,131 |
138 |
3,307 |
389 |
8,033 |
21 |
150 |
260 |
5,129 |
616 |
11,302 |
|
* Laboratory and clinical guidelines for confirming an etiology of a foodborne disease outbreak are specific for each bacterial, chemical/toxin, parasitic, and viral agent. Suspected etiologies are those that do not meet the confirmation guidelines (available at http://www.cdc.gov/outbreaknet/references_resources/guide_confirming_diagnosis.html). † No outbreaks in the data reported fall in this category. § The denominator for the total etiology percentages is the known etiology total. The denominator for the known etiology, unknown etiology, and multiple etiologies percentages is the total. ¶ An etiologic agent was not confirmed or suspected based on clinical, laboratory, or epidemiologic information. |
||||||||||||
|
TABLE 9. Number of foodborne disease outbreaks and outbreak-associated illnesses attributed to plants, by etiology* and food commodity — Foodborne Disease Outbreak Surveillance System, United States, 1998–2008 |
||||||||||||||||
|---|---|---|---|---|---|---|---|---|---|---|---|---|---|---|---|---|
|
Etiology |
Grains/Beans |
Oil/Sugar |
Fruits/Nuts |
Fungus |
Leafy vegetables |
Root |
Sprout |
Vine-stalk vegetables |
||||||||
|
No. outbreaks |
No. illnesses |
No. outbreaks |
No. illnesses |
No. outbreaks |
No. illnesses |
No. outbreaks |
No. illnesses |
No. outbreaks |
No. illnesses |
No. outbreaks |
No. illnesses |
No. outbreaks |
No. illnesses |
No. outbreaks |
No. illnesses |
|
|
Bacterial |
||||||||||||||||
|
Bacillus cereus |
44 |
281 |
—† |
— |
— |
— |
— |
— |
— |
— |
4 |
51 |
— |
— |
1 |
4 |
|
Brucella spp |
— |
— |
— |
— |
— |
— |
— |
— |
— |
— |
|
|
— |
— |
— |
— |
|
Campylobacter jejuni |
2 |
123 |
— |
— |
2 |
29 |
— |
— |
6 |
363 |
1 |
136 |
— |
— |
— |
— |
|
Campylobacter spp |
— |
— |
1 |
3 |
— |
— |
— |
— |
1 |
7 |
— |
— |
— |
— |
1 |
13 |
|
Clostridium botulinum |
1 |
2 |
— |
— |
— |
— |
1 |
2 |
— |
— |
2 |
6 |
— |
— |
3 |
9 |
|
Clostridium perfringens |
16 |
457 |
— |
— |
— |
— |
— |
— |
1 |
33 |
— |
— |
— |
— |
8 |
1,115 |
|
Escherichia coli, Enterotoxigenic |
— |
— |
— |
— |
— |
— |
— |
— |
1 |
66 |
— |
— |
— |
— |
1 |
300 |
|
Escherichia coli, Shiga toxin–producing |
— |
— |
— |
— |
10 |
891 |
— |
— |
22 |
874 |
— |
— |
6 |
55 |
— |
— |
|
Escherichia coli, other |
— |
— |
— |
— |
— |
— |
— |
— |
— |
— |
— |
— |
— |
— |
— |
— |
|
Listeria |
— |
— |
— |
— |
— |
— |
— |
— |
— |
— |
— |
— |
1 |
20 |
— |
— |
|
Salmonella |
5 |
259 |
1 |
14 |
36 |
2,359 |
1 |
10 |
11 |
306 |
6 |
172 |
21 |
711 |
21 |
3,216 |
|
Shigella flexneri |
— |
— |
— |
— |
— |
— |
— |
— |
1 |
6 |
— |
— |
— |
— |
1 |
886 |
|
Shigella sonnei |
1 |
11 |
— |
— |
1 |
56 |
— |
— |
5 |
623 |
— |
— |
— |
— |
— |
— |
|
Shigella spp |
— |
— |
— |
— |
— |
— |
— |
— |
— |
— |
— |
— |
— |
— |
— |
— |
|
Staphylococcus enterotoxin |
3 |
14 |
— |
— |
1 |
2 |
— |
— |
1 |
50 |
4 |
34 |
— |
— |
1 |
2 |
|
Vibrio parahaemolyticus |
— |
— |
— |
— |
— |
— |
— |
— |
— |
— |
— |
— |
— |
— |
— |
— |
|
Vibrio spp |
— |
— |
— |
— |
— |
— |
— |
— |
— |
— |
— |
— |
— |
— |
— |
— |
|
Yersinia enterocolitica |
— |
— |
— |
— |
— |
— |
— |
— |
— |
— |
— |
— |
— |
— |
— |
— |
|
Other bacterial |
— |
— |
— |
— |
— |
— |
— |
— |
— |
— |
1 |
15 |
— |
— |
— |
— |
|
Total bacterial |
72 |
1,147 |
2 |
17 |
50 |
3,337 |
2 |
12 |
49 |
2,328 |
18 |
414 |
28 |
786 |
37 |
5,545 |
|
Viral |
|
|
|
|
|
|
|
|
|
|
|
|
|
|
|
|
|
Astrovirus |
— |
— |
— |
— |
— |
— |
— |
— |
— |
— |
— |
— |
— |
— |
— |
— |
|
Hepatitis A |
— |
— |
— |
— |
3 |
40 |
— |
— |
6 |
734 |
1 |
297 |
— |
— |
1 |
23 |
|
Norovirus |
13 |
157 |
8 |
291 |
76 |
2,816 |
1 |
16 |
141 |
4,011 |
10 |
263 |
— |
— |
14 |
447 |
|
Rotavirus |
— |
— |
— |
— |
— |
— |
— |
— |
— |
— |
— |
— |
— |
— |
— |
— |
|
Other viral |
— |
— |
— |
— |
1 |
32 |
— |
— |
— |
— |
— |
— |
— |
— |
1 |
3 |
|
Total viral |
13 |
157 |
8 |
291 |
80 |
2,888 |
1 |
16 |
150 |
4,822 |
12 |
566 |
— |
— |
16 |
473 |
|
Chemical and toxin |
|
|
|
|
|
|
|
|
|
|
|
|
|
|
|
|
|
Ciguatoxin |
— |
— |
— |
— |
— |
— |
— |
— |
— |
— |
— |
— |
— |
— |
— |
— |
|
Cleaning agents |
— |
— |
— |
— |
— |
— |
— |
— |
— |
— |
— |
— |
— |
— |
— |
— |
|
Heavy metals |
— |
— |
1 |
10 |
1 |
21 |
— |
— |
— |
— |
— |
— |
— |
— |
— |
— |
|
Monosodium glutamate |
— |
— |
— |
— |
— |
— |
— |
— |
— |
— |
— |
— |
— |
— |
— |
— |
|
Mycotoxins |
— |
— |
— |
— |
3 |
75 |
12 |
46 |
— |
— |
— |
— |
— |
— |
— |
— |
|
Neurotoxic shellfish poison |
— |
— |
— |
— |
— |
— |
— |
— |
— |
— |
— |
— |
— |
— |
— |
— |
|
Paralytic shellfish poison |
— |
— |
— |
— |
— |
— |
— |
— |
— |
— |
— |
— |
— |
— |
— |
— |
|
Pesticides |
— |
— |
— |
— |
— |
— |
— |
— |
1 |
14 |
— |
— |
— |
— |
— |
— |
|
Plant/Herbal toxins |
— |
— |
— |
— |
— |
— |
— |
— |
1 |
6 |
— |
— |
— |
— |
— |
— |
|
Puffer fish tetrodotoxin |
— |
— |
— |
— |
— |
— |
— |
— |
— |
— |
— |
— |
— |
— |
— |
— |
|
Scombroid toxin/Histamine |
— |
— |
— |
— |
— |
— |
— |
— |
— |
— |
— |
— |
— |
— |
— |
— |
|
Other chemical |
3 |
24 |
6 |
13 |
6 |
20 |
1 |
2 |
— |
— |
— |
— |
— |
— |
1 |
9 |
|
Other natural toxins |
|
|
|
|
1 |
4 |
|
— |
— |
— |
1 |
2 |
— |
— |
— |
— |
|
Total chemical and toxin |
3 |
24 |
7 |
23 |
11 |
120 |
13 |
48 |
2 |
20 |
1 |
2 |
— |
— |
1 |
9 |
|
Parasitic |
|
|
|
|
|
|
|
|
|
|
|
|
|
|
|
|
|
Anisakiasis |
— |
— |
— |
— |
— |
— |
— |
— |
— |
— |
— |
— |
— |
— |
— |
— |
|
Cryptosporidium parvum |
— |
— |
— |
— |
1 |
144 |
— |
— |
— |
— |
— |
— |
— |
— |
— |
— |
|
Cyclospora cayetanensis |
1 |
4 |
— |
— |
7 |
269 |
— |
— |
4 |
665 |
— |
— |
— |
— |
— |
— |
|
Giardia lamblia |
— |
— |
— |
— |
— |
— |
— |
— |
— |
— |
— |
— |
— |
— |
— |
— |
|
Trichinella spiralis |
— |
— |
— |
— |
— |
— |
— |
— |
— |
— |
— |
— |
— |
— |
— |
— |
|
Other parasitic |
— |
— |
— |
— |
— |
— |
— |
— |
— |
— |
— |
— |
— |
— |
— |
— |
|
Total parasitic |
1 |
4 |
— |
— |
8 |
413 |
— |
— |
4 |
665 |
— |
— |
— |
— |
— |
— |
|
Known etiology§ |
89 |
1,332 |
17 |
331 |
149 |
6,758 |
16 |
76 |
205 |
7,835 |
31 |
982 |
28 |
786 |
54 |
6,027 |
|
Unknown etiology¶ |
51 |
693 |
7 |
81 |
38 |
402 |
3 |
31 |
53 |
958 |
10 |
104 |
1 |
2 |
15 |
499 |
|
Multiple etiology |
11 |
139 |
— |
— |
4 |
430 |
— |
— |
4 |
43 |
1 |
35 |
1 |
40 |
2 |
437 |
|
Total |
151 |
2,164 |
24 |
412 |
191 |
7,590 |
19 |
107 |
262 |
8,836 |
42 |
1,121 |
30 |
828 |
71 |
6,963 |
|
* Laboratory and clinical guidelines for confirming an etiology of a foodborne disease outbreak are specific for each bacterial, chemical/toxin, parasitic, and viral agent. Suspected etiologies are those that do not meet the confirmation guidelines (available at http://www.cdc.gov/outbreaknet/references_resources/guide_confirming_diagnosis.html). † No outbreaks in the data reported fall in this category. § The denominator for the total etiology percentages is the known etiology total. The denominator for the known etiology, unknown etiology, and multiple etiologies percentages is the total. ¶ An etiologic agent was not confirmed or suspected based on clinical, laboratory, or epidemiologic information. |
||||||||||||||||
Use of trade names and commercial sources is for identification only and does not imply endorsement by the U.S. Department of Health and Human Services.
References to non-CDC sites on the Internet are provided as a service to MMWR readers and do not constitute or imply endorsement of these organizations or their programs by CDC or the U.S.
Department of Health and Human Services. CDC is not responsible for the content of pages found at these sites. URL addresses listed in MMWR were current as of the date of publication.
All MMWR HTML versions of articles are electronic conversions from typeset documents. This conversion might result in character translation or format errors in the HTML version.
Users are referred to the electronic PDF version (http://www.cdc.gov/mmwr) and/or the original MMWR paper copy for printable versions of official text, figures, and tables. An original paper copy of this issue can be obtained from the Superintendent of Documents, U.S. Government Printing Office (GPO), Washington, DC 20402-9371;
telephone: (202) 512-1800. Contact GPO for current prices.
**Questions or messages regarding errors in formatting should be addressed to mmwrq@cdc.gov.
