 |
|
|
|
|
|
|
|
|
|
|
|
|
|
|
|
|
||||
| ||||||||||
|
|
|
|
|
Persons using assistive technology might not be able to fully access information in this file. For assistance, please send e-mail to: mmwrq@cdc.gov. Type 508 Accommodation and the title of the report in the subject line of e-mail. Surveillance for Foodborne-Disease Outbreaks --- United States, 1998--2002Michael Lynch, MD
Corresponding author: Michael Lynch, MD, Division of Foodborne, Bacterial, and Mycotic Diseases, National Center for Zoonotic, Vector-Borne, and Enteric Diseases (proposed), 1600 Clifton Road, NE, MS A-38, Atlanta, GA 30333. Telephone: 404-639-2206; Fax: 404-639-2205; E-mail: mlynch1@cdc.gov. AbstractProblem/Condition: Since 1973, CDC has maintained a collaborative surveillance program for collection and periodic reporting of data on the occurrence and causes of foodborne-disease outbreaks (FBDOs) in the United States. Reporting Period Covered: 1998--2002. Description of System: The Foodborne Disease Outbreak Surveillance System reviews data on FBDOs, defined as the occurrence of two or more cases of a similar illness resulting from the ingestion of a common food. State and local public health departments have primary responsibility for identifying and investigating FBDOs. State, local, and territorial health departments use a standard form to report these outbreaks to CDC. In 1998, CDC implemented enhanced surveillance for FBDOs by increasing communication with state, local, and territorial health departments and revising the outbreak report form. Since 2001, reports of FBDOs are submitted through a web application on the Internet called the electronic Foodborne Outbreak Reporting System (eFORS). Results: During 1998--2002, a total of 6,647 outbreaks of foodborne disease were reported (1,314 in 1998, 1,343 in 1999, 1,417 in 2000, 1,243 in 2001, and 1,330 in 2002). These outbreaks caused a reported 128,370 persons to become ill. Among 2,167 (33%) outbreaks for which the etiology was determined, bacterial pathogens caused the largest percentage of outbreaks (55%) and the largest percentage of cases (55%). Among bacterial pathogens, Salmonella serotype Enteritidis accounted for the largest number of outbreaks and outbreak-related cases; Listeria monocytogenes accounted for the majority of deaths of any pathogen. Viral pathogens, predominantly norovirus, caused 33% of outbreaks and 41% of cases; the proportion of outbreaks attributed to viral agents increased from 16% in 1998 to 42% in 2002. Chemical agents caused 10% of outbreaks and 2% of cases, and parasites caused 1% of outbreaks and 1% of cases. Interpretation: Following implementation of measures to enhance outbreak surveillance, the annual number of FBDOs reported to CDC increased during this period compared with previous years. Viral pathogens accounted for an increased proportion of outbreaks each year during this reporting period and a higher proportion of outbreaks of known etiology during this reporting period than preceding reporting periods, probably reflecting the increased availability of improved viral diagnostic tests. S. Enteritidis continued to be a major cause of illness and L. monocytogenes was a major cause of death. In addition, multistate outbreaks caused by contaminated produce and outbreaks caused by Escherichia coli O157:H7 remained prominent. Public Health Actions: Methods to detect FBDOs are improving, and several changes to improve the ease and timeliness of reporting FBDO data have been implemented (e.g., a revised form to simplify FBDO reporting by state health departments and improved electronic reporting methods). State and local health departments continue to investigate and report FBDOs as part of efforts to better understand and define the epidemiology of foodborne disease in the United States. At the regional and national levels, surveillance data provide an indication of the etiologic agents, vehicles of transmission, and contributing factors associated with FBDOs and help direct public health actions to reduce illness and death caused by FBDOs. IntroductionThe reporting of foodborne and waterborne diseases in the United States began approximately 80 years ago when state and territorial health officers, concerned about the high morbidity and mortality caused by typhoid fever and infantile diarrhea, recommended that cases of "enteric fever" be investigated and reported. The purpose of investigating and reporting these cases was to obtain information about the role of food, milk, and water in outbreaks of intestinal illness as the basis for public health action. Beginning in 1925, the U.S. Public Health Service (PHS) published summaries of outbreaks of gastrointestinal illness attributed to milk (1). In 1938, PHS added summaries of outbreaks caused by all foods. These early surveillance efforts led to the enactment of important public health measures (e.g., the Pasteurized Milk Ordinance) that resulted in decreased incidence of enteric diseases, particularly those transmitted by milk and water (2). During 1951--1960, the National Office of Vital Statistics reviewed reports of outbreaks of foodborne illness and published annual summaries in Public Health Reports. In 1961, CDC assumed responsibility for publishing reports about foodborne illness. During 1961--1965, CDC stopped publishing annual reviews but reported pertinent statistics and detailed individual investigations in MMWR. The current system of surveillance for outbreaks of foodborne and waterborne diseases began in 1966, when reports of enteric disease outbreaks attributed to microbial or chemical contamination of food or water were incorporated into an annual summary. Since 1966, the quality of investigative reports has improved greatly, with more active participation by state and federal epidemiologists in outbreak investigations. Outbreaks of waterborne diseases and foodborne diseases have been reported in separate annual summaries since 1978 because of increased interest and activity in surveillance for waterborne diseases. Previous summaries of data reported to the Foodborne Disease Outbreak Surveillance System were published for 1983--1987 (3), 1988--1992 (4), and 1993--1997 (5). Outbreak surveillance has served three purposes:
This report summarizes epidemiologic data on FBDOs reported to CDC during 1998--2002. MethodsSources of Data for the Foodborne Disease Outbreak Surveillance SystemAgencies use a standard form (CDC form 52.13, Investigation of a Foodborne Outbreak) to report FBDOs to CDC. In 1998, CDC increased communication with state, local, and territorial health departments to enhance surveillance for FBDOs, including formal confirmation procedures to finalize reports from each state each year. This led to a substantial increase in the number of reports, resulting in a surveillance discontinuity during 1997--1998. A revised form became effective in 1999. The revised form expanded the range of food items, places, and contributing factors that could be reported. In 2001, state, local, and territorial health departments began submitting reports through a web-based version of this form. This web-based outbreak surveillance system is called the Electronic Foodborne Outbreak Reporting System (eFORS). This report summarizes data collected with both the paper and web-based forms (Appendix A). The majority of reports are submitted by state, local, and territorial health departments; however, they also can be submitted by federal agencies and other sources. Reporting officials use published criteria to determine whether a specific etiologic agent has been confirmed for an outbreak (Appendix B) and submit reasons that reported food vehicles were implicated. Implicated food vehicles for all reasons are included in this report. Definition of TermsAn FBDO is defined as the occurrence of two or more cases of a similar illness resulting from the ingestion of a food in common. Laboratory or clinical guidelines for confirming an etiology of a FBDO outbreak vary for bacterial, chemical, parasitic, and viral agents (Appendix B). An outbreak in which more than one etiologic agent was confirmed is categorized as attributable to multiple etiologies. Food vehicles identified in outbreak investigations that can be classified into a single commodity are classified into one of 12 major food commodity categories. Some reported food vehicles cannot be categorized in a single commodity category and are listed as unclassifiable. Outbreaks in which more than one implicated food is reported or the implicated food contains ingredients from multiple commodities are classified as attributable to complex food vehicles. Exclusions from and Limitations of the Surveillance SystemThe findings in this report are subject to at least four limitations. First, several types of outbreaks are excluded from the Foodborne Disease Outbreak Surveillance System, such as outbreaks that occur on cruise ships (these are summarized and published periodically in scientific publications) (6); outbreaks in which the food was eaten outside the United States, even if the illness occurred within the United States; and outbreaks that are traced to water intended for drinking (these are reported to the Waterborne Disease Outbreak Reporting System). In addition, FBDOs are excluded from the surveillance system if the route of transmission from the contaminated food to the infected persons is indirect. For example, in 1988, chitterlings (pig intestines) were the ultimate source of a cluster of Yersinia enterocolitica infections among several infants; however, this outbreak was not included because the infants did not eat the chitterlings (7). Similarly, outbreaks that occur as result of direct contact with animals are excluded. Second, for many reports, information on certain aspects of the outbreak, such as the etiology, the implicated food vehicle, or the factors that might have contributed to the outbreak, is missing or incomplete. The category of "unknown etiology" is broad. Outbreaks with some etiologic information might not meet guidelines for confirmation and are presented in this report as "unknown etiology." Clinical and descriptive epidemiologic information that suggests etiologic categories for outbreaks of unknown etiology have not been used in this report (8). Third, food vehicles are reported by investigating agencies as individual food items in varying levels of details (e.g., milk, 2% milk, pasteurized 2% milk). A particular reported food item with multiple ingredients could be classified under several food commodity categories; however, in this surveillance summary, the reported food item for each outbreak is classified under only one food commodity category. Food items that cannot be classified under one food commodity category are counted as unclassifiable. As a result, the reported number of outbreaks attributed to one food vehicle category might not include all outbreaks attributable to a particular food ingredient in that food. Finally, no standard criteria exist for classifying a death as being FBDO-related. This determination is made by the reporting agency. How Data Are PresentedIn this report, 1998--2002 data on foodborne-disease outbreaks are presented as follows:
ResultsDuring 1998--2002, the annual number of reported outbreaks ranged from 1,243 to 1,417 (Tables 2--6). The average annual number of outbreaks reported during this period (1,329) was substantially greater than the average annual number of outbreaks reported during 1993--1997 (550) (Figure 1). The average number of cases per outbreak during 1998--2002 (19) was lower than the average number of cases per outbreak during 1993--1997 (31). During 1998--2002, a total of 2,167 (33%) of the 6,647 outbreaks reported to CDC had a known etiology; these outbreaks accounted for 68,981 (54%) of 128,370 illnesses (Table 1). Of the 2,167 outbreaks with a known etiology, 55% (55% of illnesses) were caused by bacterial pathogens, 33% (41% of illnesses) by viruses, 10% (2% of illnesses) by chemical agents, and 1% (1% of illnesses) by parasites. The proportion of outbreaks with known etiology attributable to viruses increased from 16% in 1998 to 42% in 2002. In the majority (67%) of outbreaks, the etiology was not determined. However, the proportion of outbreaks for which an etiology was determined increased during the reporting period, from 28% in 1998 to 37% in 2002. Local investigators might report factors they believe contributed to the outbreak. These factors are grouped into those that investigators believed led to contamination of the food, those that allowed proliferation of the pathogen in the food, and those that contributed to survival of the pathogen in the food. During 1998--2002, at least one contributing factor was reported in 3,072 (46%) outbreaks. The most commonly reported contamination factor that contributed to FBDOs was "bare-handed contact by handler/worker/preparer" (Table 19). For outbreaks caused by bacterial pathogens "raw product/ingredient contaminated by pathogens from animal or environment" was the most commonly reported contamination factor. The most commonly reported proliferation factor was "allowing foods to remain at room or warm outdoor temperature for several hours"; the most common survivability factor was "insufficient time and/or temperature during initial cooking/heat processing." In the majority of foodborne outbreaks during this period, food was eaten outside the home (Table 8). Restaurants were the most commonly reported place where food was eaten. Many outbreaks caused by Salmonella or norovirus occurred at a school or nursing home. In outbreaks caused by ciguatoxin and L. monocytogenes, food was more commonly reported to have been eaten at a private home. During this period, notable outbreaks were reported that were caused by ground beef contaminated with E. coli O157:H7 (9) and fresh produce contaminated with Salmonella, E. coli O157:H7, Cyclospora cayetanensis, or hepatitis A (Tables 14--18). Multidrug-resistant strains of Salmonella caused outbreaks linked to unpasteurized milk and ground beef. A large multistate outbreak of listeriosis caused by contaminated deli meat led to one of the largest food recalls in the United States (10). Scombrotoxin (fish-derived histaminic agent) caused the majority of outbreaks attributable to a chemical etiology. The majority of these outbreaks was associated with tuna, although several were associated with nonscombroidae fish, including 10 outbreaks associated with escolar. Unexpected vehicles of transmission (e.g., dry cereal [11], parsley [12], and mangoes [13]) also were reported. During 1998--2002, norovirus caused 657 (30%) of the 2,167 FBDOs with a known etiology and 39% of all outbreak-related cases in these outbreaks. S. Enteritidis, the most frequently reported bacterial cause of FBDOs, caused 204 outbreaks, accounting for 9% of outbreaks for which an etiology was determined. Eggs caused more S. Enteritidis outbreaks than any other food vehicle. L. monocytogenes resulted in 38 outbreak-related deaths among 256 cases, more deaths, and a higher case-fatality rate (15%) than any other pathogen. DiscussionFoodborne-Disease Outbreaks, 1998--2002The annual number of FBDOs reported to CDC increased during this period compared with previous years, following implementation of measures to enhance outbreak surveillance (3--5). Certain observations suggest that the increase in outbreak reports probably represents the effect of enhanced surveillance rather than a true increase in the occurrence of FBDOs. First, after a marked increase during 1997--1998 with implementation of enhanced surveillance, the number of reported outbreaks remained within a relatively narrow range. Second, the number of cases of foodborne infections identified through routine surveillance, of which outbreak cases are a part, decreased or remained stable during this period (14). Finally, the average size of reported outbreaks during 1998--2002 was smaller than the average size of outbreaks during 1993--1997, indicating that a substantial portion of the increase in reported outbreaks might be caused by smaller outbreaks that were not reported in previous years. Because of this increased reporting, comparisons of the number of reported FBDOs attributable to a specific etiology or vehicle of transmission between this period and previous reporting periods are difficult to make. Comparisons of the proportion of FBDOs related to specific causes are less likely to be influenced by the effect of enhanced surveillance but should be made with caution. As in previous years, bacterial pathogens caused the majority of outbreaks and infections among outbreaks with a known etiology (3--5). Viral pathogens accounted for a much greater proportion of outbreaks and infections than in previous years, probably because of the increased availability of methods to diagnose viral agents. Although 67% of reported FBDOs during 1998--2002 were of unknown etiology, the proportion of outbreaks of unknown etiology decreased during 1998--2002. Much of this decrease is attributed to increased norovirus diagnostic capacity in state health department laboratories (15) and improved strategies to obtain diagnostic specimens (16). With continued improvements in epidemiologic and laboratory investigations, the proportion of outbreaks of unknown etiology might decrease further. Of FBDOs with a known etiology, multistate outbreaks caused by contaminated produce and outbreaks caused by E. coli O157:H7 remained prominent. Investigation of several multistate outbreaks attributed to L. monocytogenes, detected by linking information from molecular subtyping of isolates from several states, led to recalls of implicated products (10,17,18). Although S. Enteritidis continued to be a major cause of illness and death, it caused a much smaller proportion of outbreaks for which an etiology was known than in the past. The decrease in outbreaks attributed to S. Enteritidis parallels the decrease in S. Enteritidis infections reported to the National Salmonella Surveillance System and might reflect the role of Egg Quality Assurance Programs and other public health interventions in reducing the incidence of S. Enteritidis infection (19). Persons can decrease their risk for egg-associated infections caused by S. Enteritidis by not eating raw or undercooked eggs. Nursing homes, hospitals, and commercial kitchens should use pasteurized egg products for all recipes requiring pooled or lightly cooked eggs (20). Interpretation of Data from the Foodborne Disease Outbreak Surveillance SystemFoodborne diseases cause an estimated 76 million illnesses and 5,000 deaths in the United States each year (21). Although foodborne diseases are common, only a fraction of these illnesses are routinely reported to CDC because a complex chain of events must occur before a foodborne infection is reported; a break at any point in the chain will result in a case not being reported. In addition, the majority of reported foodborne illnesses are sporadic; only a small number are identified as being part of an outbreak and reported through the Foodborne Disease Outbreak Surveillance System. For example, Salmonella infection causes an estimated 1.4 million foodborne illnesses annually (22). However, during 1998--2002, a total of 164,044 Salmonella infections (approximately 32,000 annually) were reported through the National Salmonella Surveillance System (23--27), which is a passive, public health laboratory-based system. During the same period, 585 recognized outbreaks of Salmonella infection resulting in 16,821 illnesses were reported through the Foodborne Disease Outbreak Surveillance System, not all of which were necessarily culture-confirmed. Therefore, the system represents only a fraction of the burden of foodborne disease. The number of outbreaks summarized in this report represents a small proportion of the outbreaks that actually occurred during the surveillance period. Some outbreaks are never recognized, and those that are recognized frequently go unreported. The likelihood that public health authorities are alerted about an outbreak depends on many factors, including its size and the severity of illnesses; consumer and physician awareness, interest, and motivation to report the incident; and the resources and disease surveillance activities of state and local public health and environmental agencies. Outbreaks that are most likely to be brought to the attention of public health authorities include those that are large, interstate, or restaurant-associated or that can cause serious illness, hospitalization, or death. The degree of underreporting might vary by etiology; therefore, this report provides limited information about the absolute or relative incidence of foodborne-disease outbreaks related to specific causes. For example, foodborne diseases characterized by short incubation periods (e.g., those caused by a chemical agent or staphylococcal enterotoxin) are more likely to be recognized as common source FBDOs than are diseases with longer incubation periods (e.g., hepatitis A). Outbreaks involving less commonly identified pathogens (e.g., Bacillus cereus, enterotoxigenic E. coli, or Giardia intestinalis) are less likely to have a confirmed etiology because these organisms are not always considered in clinical, epidemiologic, and laboratory investigations of FBDOs. The objective of this report is to present simple analyses of the data on outbreaks of foodborne disease reported during 1998--2002. These data will continue to be analyzed in detail, along with other relevant data, to answer specific questions of public health importance, and findings will be published in the scientific literature. Specifically, a more detailed analysis of outbreak data to estimate the attribution of illness to specific food commodities would take into account the burden of illness attributed to specific etiologies and the attributable portion of those illnesses caused by particular food commodities. The simple frequencies of outbreaks caused by certain food commodities presented here do not, by themselves, provide a good measure of the burden of illness associated with one food commodity compared with another. Future DirectionsMethods to detect FBDOs continue to improve. For example, two tools that have enhanced detection of FBDOs are the Statistical Outbreak Detection Algorithm (SODA) and the National Molecular Subtyping Network for Foodborne Disease Surveillance (PulseNet). SODA applies a statistical algorithm to data reported through CDC's National Salmonella, Shigella, and E. coli Surveillance Systems to identify substantial increases over a historical baseline for any given serotype (28). This technology can be used to help identify clusters or outbreaks. PulseNet is a national network of public health laboratories that perform pulsed-field gel electrophoresis (PFGE) analysis on bacteria that might be foodborne (29). PulseNet was initiated in four states in 1996 and reached full participation of all 50 states and several large cities by 2001. This network permits rapid comparison of PFGE patterns through an electronic database at CDC; closely related PFGE patterns suggest a common source. PulseNet has helped in the detection and investigation of outbreaks, particularly those that involve multiple states. An assessment of the impact of introducing PulseNet PFGE subtyping in one state indicated that it increased the number of detected outbreaks of E. coli O157:H7 by 40% (30). Several changes have improved the ease and timeliness of reporting. In October 1999, CDC issued a revised FBDO reporting form to simplify reporting by state health departments. In addition, eFORS was implemented in 2001 to help improve the timeliness of foodborne disease outbreak reporting. Upcoming versions of eFORS will include an automated search algorithm for more ready access to foodborne outbreak surveillance data. An annual listing of foodborne disease outbreaks reported to CDC is available at http://www.cdc.gov/foodborneoutbreaks/outbreak_data.htm. The investigation and reporting of FBDOs by state and local health departments are important steps in efforts to better understand and define the epidemiology of foodborne disease in the United States. At the regional and national levels, surveillance data provide an indication of the etiologic agents, vehicles of transmission, and contributing factors associated with FBDOs and help direct public health actions. Acknowledgments The authors would like to thank all State and Territorial Epidemiologists and, in particular, members of the Foodborne Disease Outbreak reporting network, who contributed reports of foodborne outbreak investigations included in this summary. References
Table 1 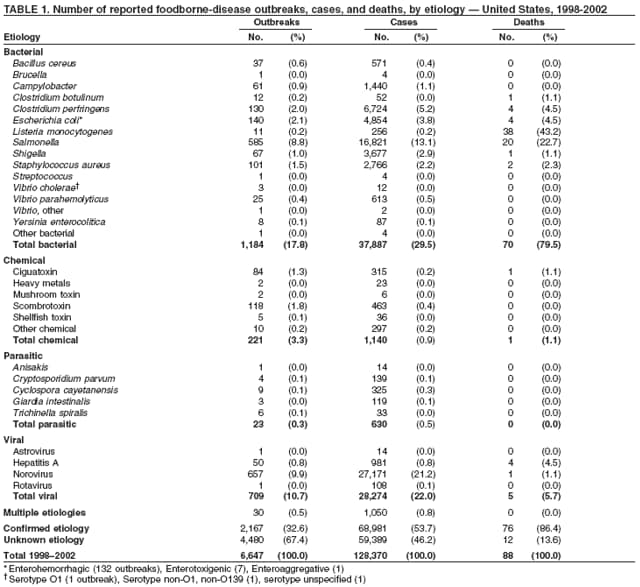 Return to top. Figure 1 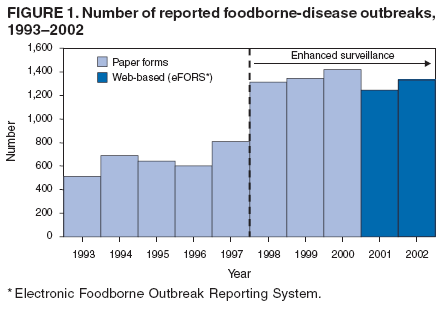 Return to top. Table 2 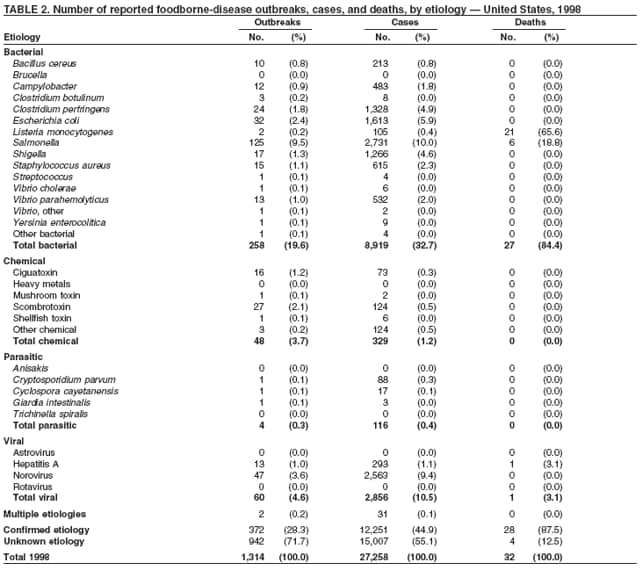 Return to top. Figure 2 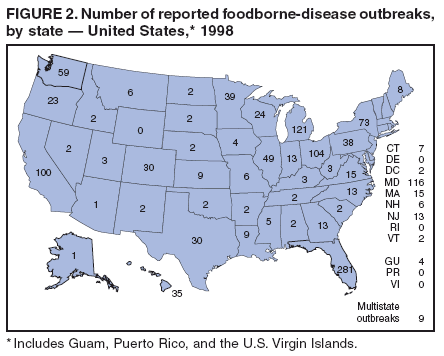 Return to top. Table 3 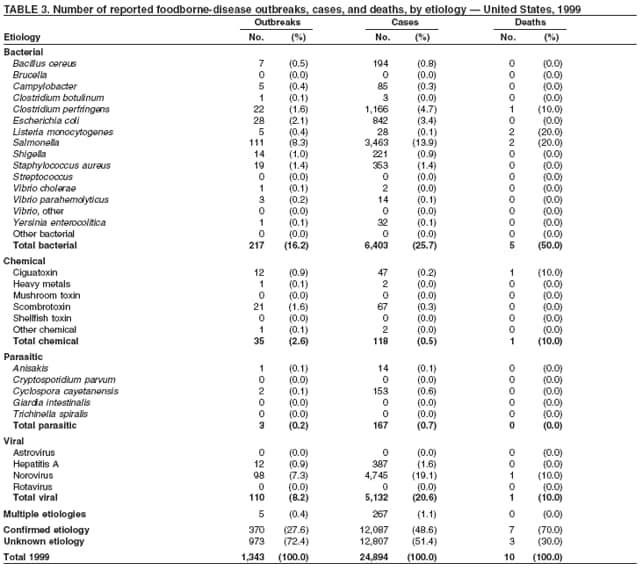 Return to top. Figure 3 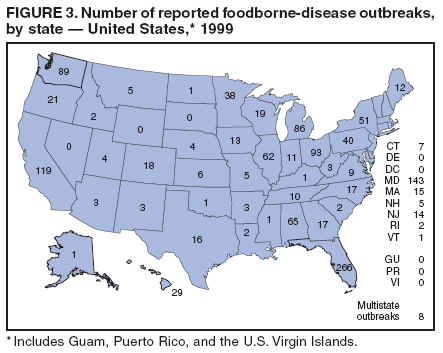 Return to top. Table 4  Return to top. Figure 4 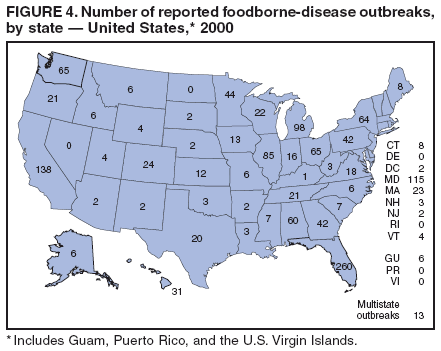 Return to top. Table 5 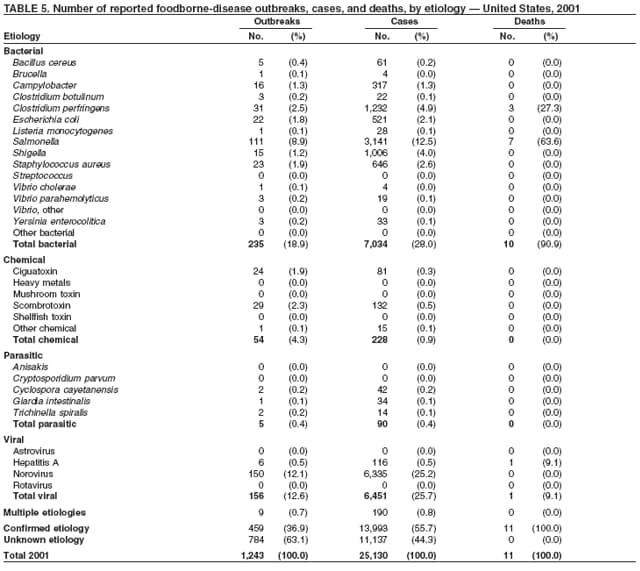 Return to top. Figure 5 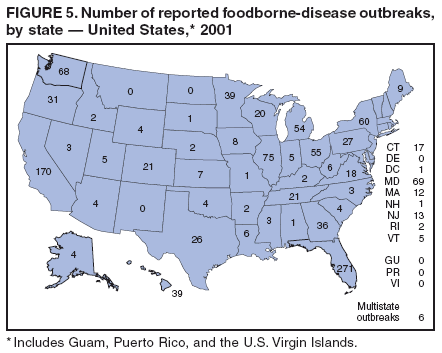 Return to top. Table 6  Return to top. Figure 6 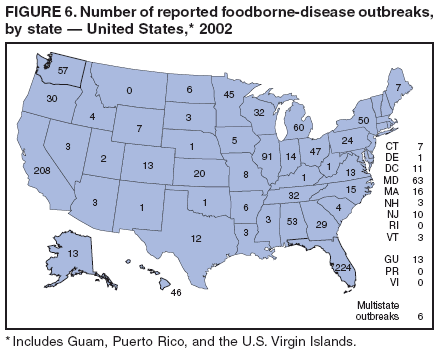 Return to top. Table 7 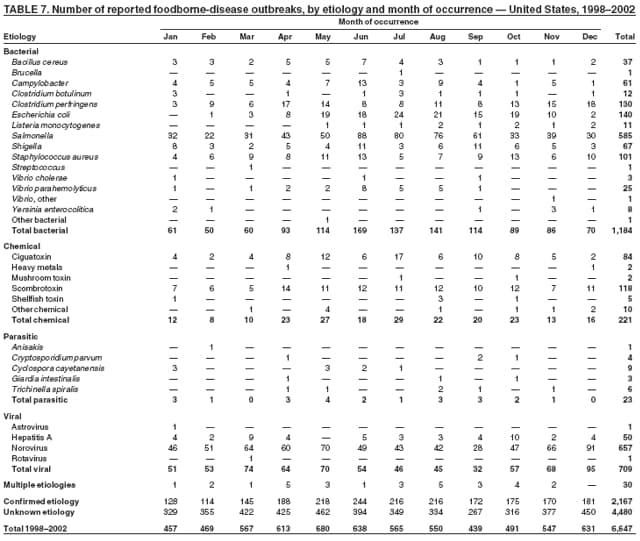 Return to top. Table 8 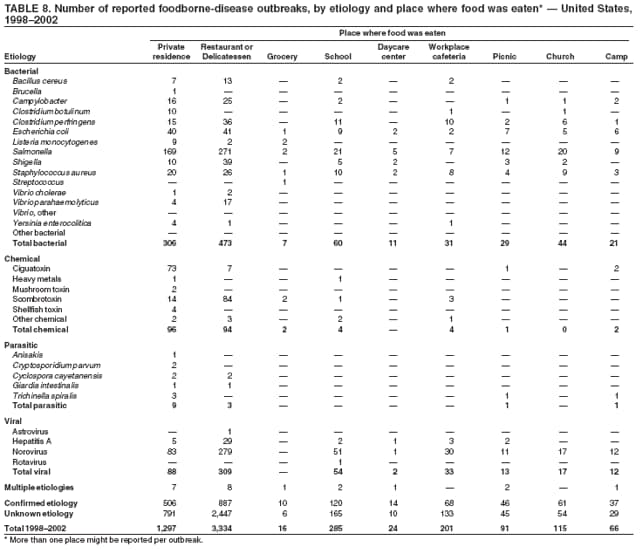 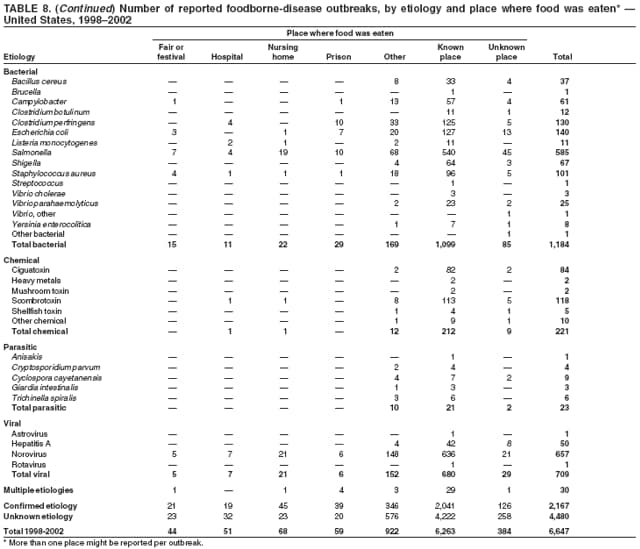 Return to top. Table 9 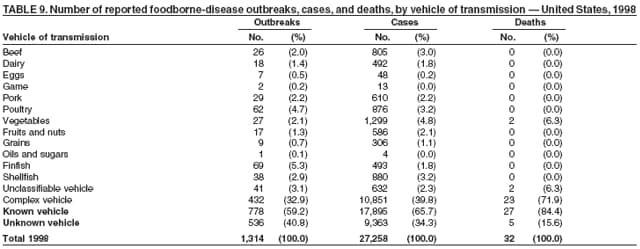 Return to top. Table 10 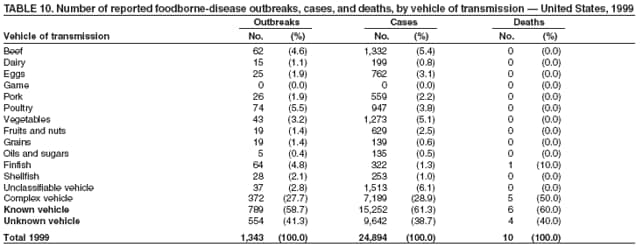 Return to top. Table 11 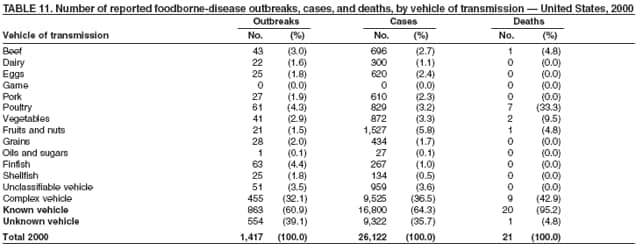 Return to top. Table 12 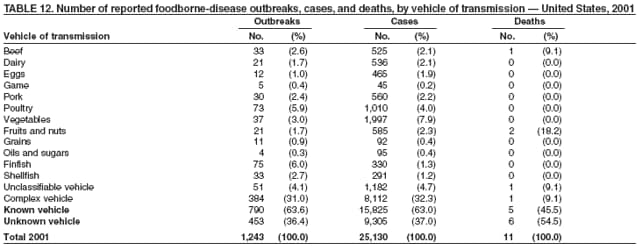 Return to top. Table 13 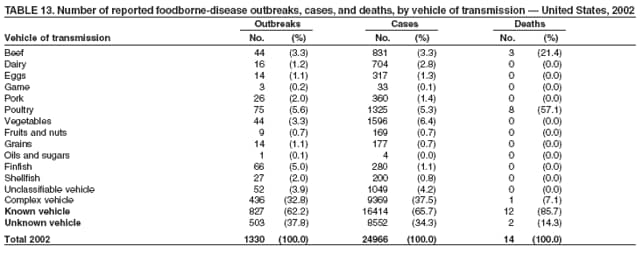 Return to top. Table 14 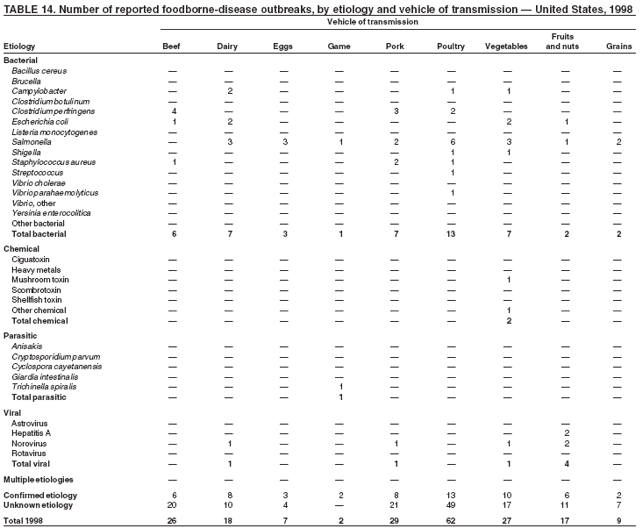 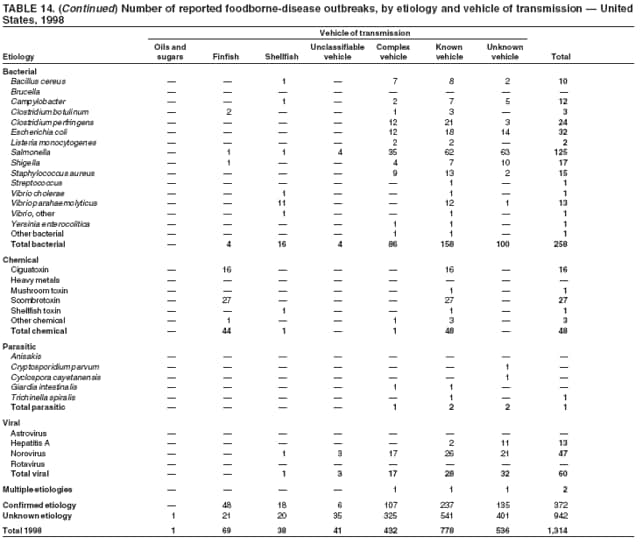 Return to top. Table 15 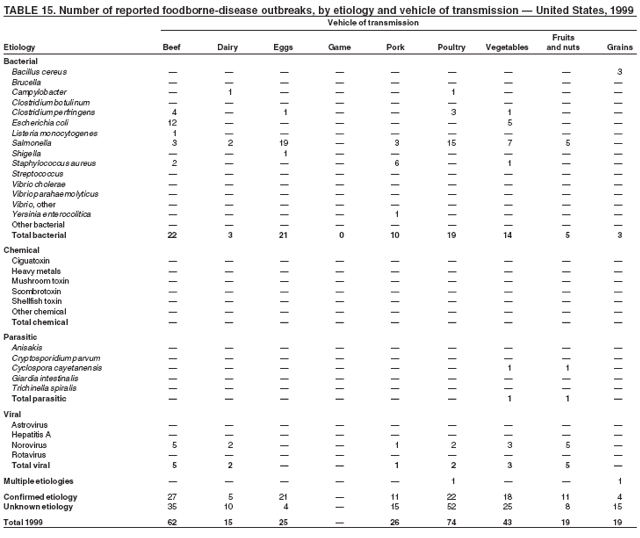  Return to top. Table 16 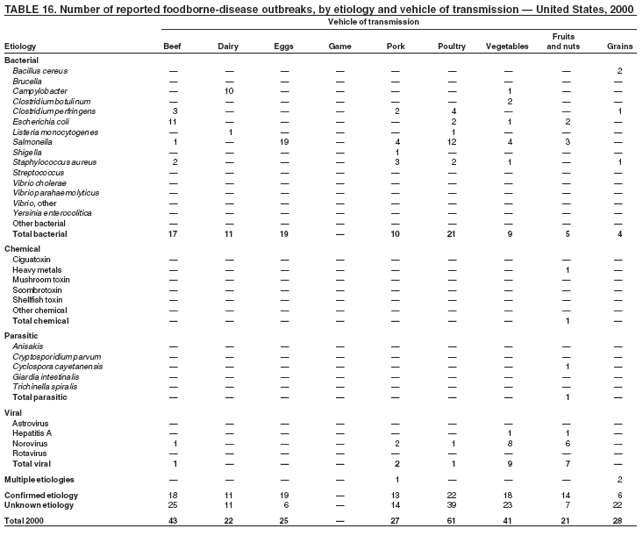  Return to top. Table 17 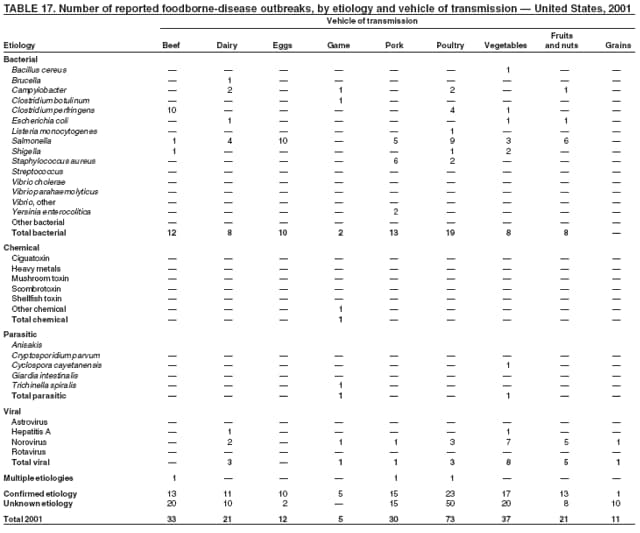  Return to top. Table 18 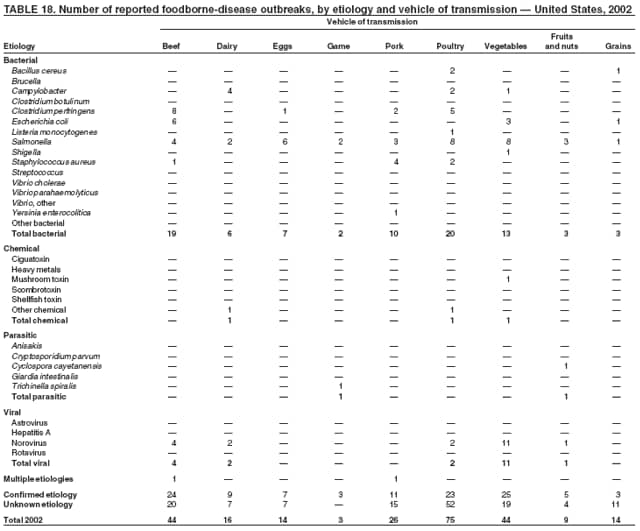 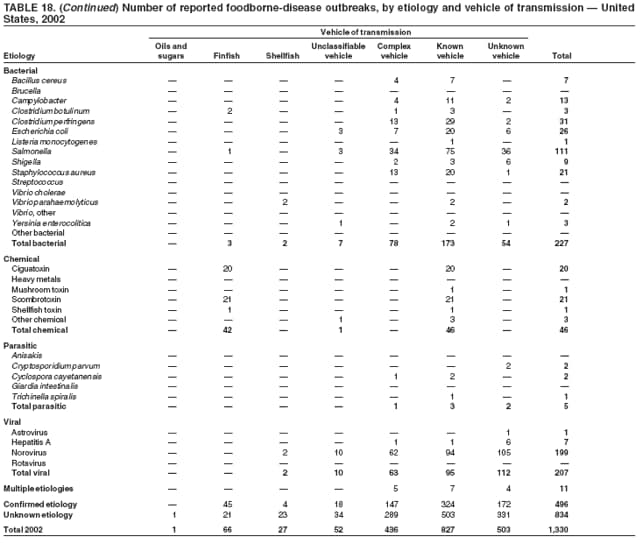 Return to top. Table 19 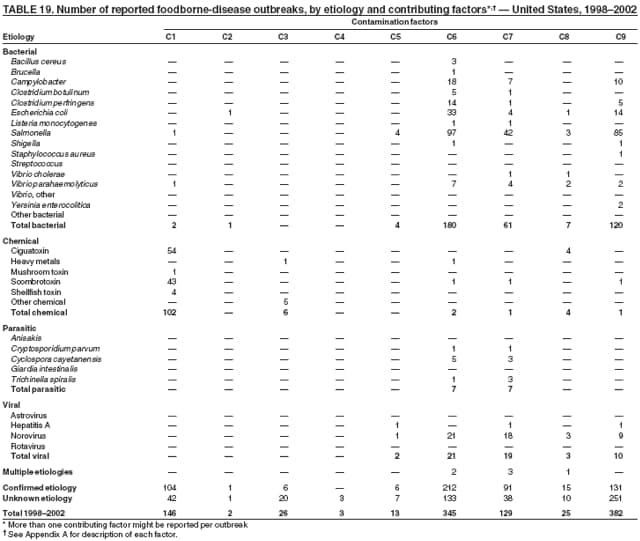 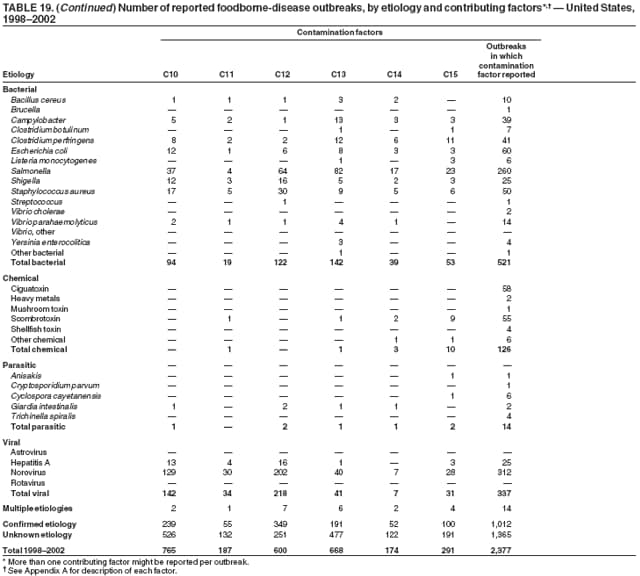 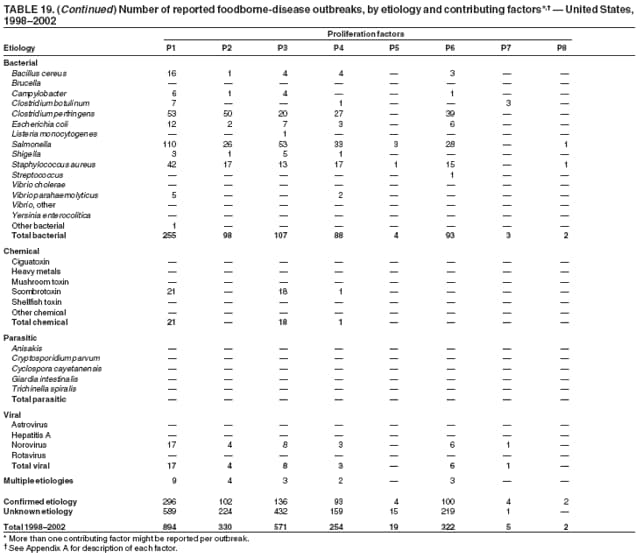 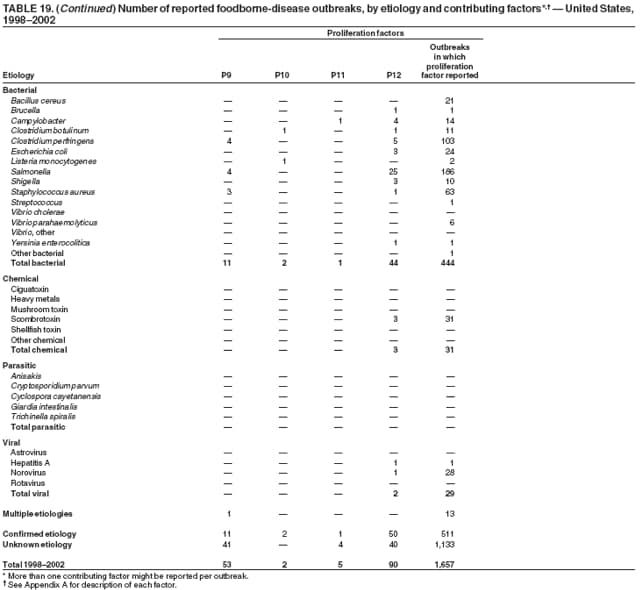 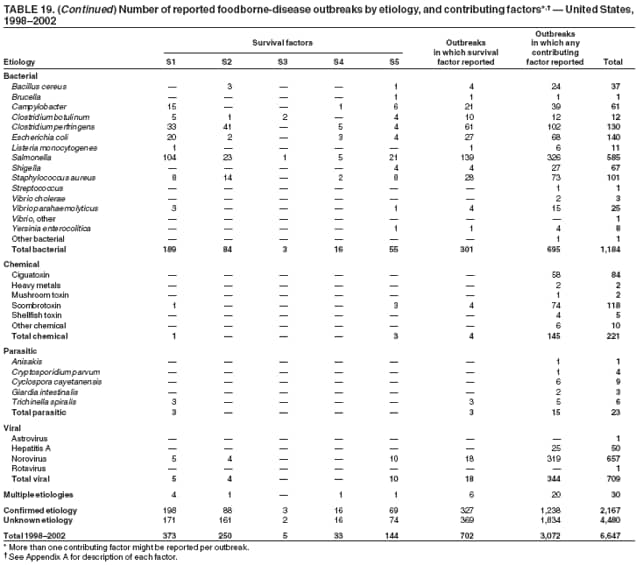 Return to top.
All MMWR HTML versions of articles are electronic conversions from ASCII text into HTML. This conversion may have resulted in character translation or format errors in the HTML version. Users should not rely on this HTML document, but are referred to the electronic PDF version and/or the original MMWR paper copy for the official text, figures, and tables. An original paper copy of this issue can be obtained from the Superintendent of Documents, U.S. Government Printing Office (GPO), Washington, DC 20402-9371; telephone: (202) 512-1800. Contact GPO for current prices. **Questions or messages regarding errors in formatting should be addressed to mmwrq@cdc.gov.Date last reviewed: 10/26/2006 |
|||||||||
|