Invasive Cancer Incidence and Survival — United States, 2012
, MSPH1; , MD1; , MPH1; , MPH1; , MPH1; , PhD1
Many factors contribute to changes in cancer incidence, including changes in risk exposures or changes in the use of cancer screening tests (1). To monitor changes in cancer incidence and assess progress toward achieving Healthy People 2020 objectives,* CDC analyzed data from U.S. Cancer Statistics (USCS) for 2012, the most recent data available. USCS includes high quality incidence data from CDC's National Program of Cancer Registries (NPCR) and the National Cancer Institute's Surveillance, Epidemiology, and End Results (SEER) program, survival data from NPCR, and mortality data from the National Vital Statistics System (2). In 2012, a total of 1,529,078 invasive cancers were reported to cancer registries in the United States (excluding Nevada), for an annual incidence rate of 440 cases per 100,000 persons. Cancer incidence rates were higher among males (483) than females (412), highest among blacks (446), and ranged by state, from 371 to 515 per 100,000 persons (355 in Puerto Rico). The proportion of persons with cancer who survived ≥5 years after diagnosis was 66%. The proportion was the same for males and females (66%) but lower among blacks (60%) compared with whites (66%). These cancer incidence, survival, and mortality surveillance data are continually tracked and used by states to effectively plan health care allocation and support services.
Invasive cancers are all cancers excluding in situ cancers (except in the urinary bladder) and basal and squamous cell skin cancers. Data on new cases of invasive cancer diagnosed in 2012 (the most recent year available) were obtained from population-based cancer registries affiliated with NPCR and SEER programs in each state, the District of Columbia (DC), and Puerto Rico (2). For comparability with past estimates, data for the United States were restricted to the states and DC, and data for Puerto Rico were analyzed separately. Data from DC and all states except Nevada met USCS publication criteria for 2012†; consequently, incidence data in this report cover 99% of the U.S. population. Cases were first classified by anatomic site using the International Classification of Diseases for Oncology, Third Edition.§ Cases with hematopoietic histologies were further classified using the World Health Organization Classification of Tumours of Haematopoietic and Lymphoid Tissues, Fourth Edition.¶ Breast cancers were characterized by stage at diagnosis using SEER Summary Staging Manual 2000**; late-stage cancers included those diagnosed after they had spread regionally or metastasized.
Population denominators for incidence rates were race-, ethnicity-, and sex-specific county population estimates from the U.S. Census, as modified by SEER and aggregated to the state and national level.†† Annual incidence rates per 100,000 population were age-adjusted to the 2000 U.S. standard population.
A subset of the USCS data set includes the 5-year relative survival rate, defined as the proportion of persons surviving ≥5 years after cancer diagnosis compared with the proportion of survivors expected in a comparable group of cancer-free persons. These estimates were based on data from NPCR-funded states that met USCS publication criteria and conducted active case follow-up or linkage with CDC's National Center for Health Statistics National Death Index (3). For this report, 27 states met these criteria, covering 59% of the U.S. population. The 5-year relative survival rates were calculated for cases of cancer diagnosed during 2001–2011 with follow-up through 2011.§§
In 2012, a total of 1,529,078 invasive cancers were diagnosed and reported to central cancer registries in the United States (excluding Nevada), including 767,366 among males and 761,712 among females (Table 1). The age-adjusted annual incidence for all cancers was 440 per 100,000 population: 483 per 100,000 in males and 412 per 100,000 in females. Among persons aged <20 years, 14,748 cancers were diagnosed in 2012 (Table 1). The rate per 100,000 persons for cancers diagnosed in 2012 increased with increasing age group (Table 1).
By cancer site, rates were highest for cancers of the female breast (122 per 100,000 females); prostate (105 per 100,000 males); lung and bronchus (60 per 100,000 persons); and colon and rectum (39 per 100,000 persons) (Table 1). These four sites accounted for approximately half of cancers diagnosed in 2012, including 224,147 female breast cancers, 177,489 prostate cancers, 210,828 lung and bronchus cancers, and 134,784 colon and rectum cancers. In 2012, cervical cancer incidence was 7 per 100,000 females, representing 12,042 reported cancers.
By state, in 2012, all-sites cancer incidence rates ranged from 371 to 515 per 100,000 persons (Figure). State site-specific cancer incidence rates ranged from 70 to 157 per 100,000 males for prostate cancer, 107 to 141 per 100,000 females for female breast cancer, 30 to 92 per 100,000 persons for lung cancer, 30 to 49 per 100,000 persons for colorectal cancer, and 4 to 10 per 100,000 females for cervical cancer (Figure). The Healthy People 2020 target for reducing colorectal cancer incidence (≤39.9 per 100,000 persons) was reached in 30 states and the target for reducing cervical cancer incidence (≤7.2 per 100,000 females) was reached in 27 states. Compared with the states and DC, cancer incidence rates in Puerto Rico in 2012 were lower for all-sites cancer (355 per 100,000 persons), lung cancer (18 per 100,000 persons), and female breast cancer (93 per 100,000 females), but higher for prostate cancer (151 per 100,000 males), colorectal cancer (43 per 100,000 persons), and cervical cancer (11 per 100,000 females) (Figure).
Among persons with cancer diagnosed during 2001–2011, the 5-year relative survival rate was 66% (Table 2). This percentage was similar for males and females. The 5-year relative survival was highest among persons who received a diagnosis of cancer before age 45 years (81%) and decreased with increasing age (Table 2). Among the most common cancer sites, 5-year relative survival was highest for prostate cancer (97%) and female breast cancer (88%), intermediate for colorectal cancer (64%), and lowest for lung cancer (18%) (Table 2). The 5-year relative survival after any cancer diagnosis was lower for blacks (60%) than for whites (66%), particularly black females (57%) compared with white females (66%) (Table 2).
Discussion
This report provides estimates of cancer incidence for 2012 in the United States and shows that Healthy People 2020 targets were achieved in 30 states for reduced colorectal cancer incidence and 27 states for reduced cervical cancer incidence. Compared with 2011 (2), fewer prostate cancer cases were reported to cancer registries in 2012, resulting in lower prostate cancer incidence rates and lower all-sites cancer incidence rates. Decreases in prostate cancer incidence likely reflect decreased use of the prostate-specific antigen (PSA) test, following the U.S. Preventive Services Task Force recommendation in 2008 against the use of this test for prostate cancer screening for men aged ≥75 years and the expansion of this recommendation in 2012 to men of all ages (4). On the basis of data from the National Health Interview Survey, in 2008, 32% of men had a PSA test in the past year compared with 24% in 2013 (5). PSA-based prostate cancer screening increases the probability of overdiagnosis, leading to unnecessary treatment (4). In this report, 97% of men who received a diagnosis of prostate cancer survived ≥5 years after diagnosis.
As of 2015, the U.S. Preventive Services Task Force recommends population-based screening for colorectal, female breast, and cervical cancers among persons at average risk and for lung cancer in persons at high risk, and recommends against population-based screening for prostate, ovarian, pancreatic, and testicular cancers among persons at average risk.¶¶ Even with efforts to deliver screening services at appropriate intervals, some persons do not follow recommended cancer screening guidelines, either receiving screening when it is not recommended or not getting screened as frequently, or at all, as recommended (6). Health care providers play an important role in ensuring that all persons receive the screening tests they need at the right time.*** Evidence-based public health approaches are available to increase both patient and provider adherence to screening recommendations, access to appropriate screening, and timely follow-up of abnormal results (6).
Cancer incidence and survival data guide the planning and evaluation of cancer prevention and control programs. For example, in Indiana, cancer registry data were used to highlight an increase in cancers related to obesity, underscoring the need to increase opportunities for physical activity through built environment strategies and school-based policy and systems change (7). These data also assist long-term planning for cancer diagnostic and treatment services. For example, linking Nebraska Cancer Registry data with Nebraska hospital discharge data found that lung cancer patients with multiple chronic conditions had lower survival, suggesting that these patients might need more intensive management of, and appropriate treatment for, both their cancer and other conditions (8). Finally, these data help public health officials set priorities for allocating health resources. For example, the Cancer Data Registry of Idaho indicated that colorectal and lung cancer incidence rates were higher in census tracts with a high proportion of uninsured persons, emphasizing the importance of reducing the number of persons who are uninsured in these areas (9). CDC annually provides cancer surveillance via several products, including USCS, CDC WONDER, State Cancer Facts, CDC's National Center for Health Statistics Research Data Centers, and the CDC Chronic Disease Indicators webtool.†††
The findings in this report are subject to at least three limitations. First, analyses based on race and ethnicity might be biased if race and ethnicity were systematically misclassified; ongoing efforts are made to ensure that this information is as accurate as possible.§§§ Second, delays in cancer reporting might result in an underestimation of certain cancers; reporting delays are more common for cancers such as melanoma and prostate cancer that are diagnosed and treated in nonhospital settings such as physicians' offices (10). Finally, relative survival rates could only be calculated for white and black racial groups because accurate life tables were not available for other racial/ethnic groups.
Public health officials use population-based cancer surveillance data to monitor cancer incidence, mortality, and survival to help guide the planning of health care allocation and support services. Maximizing efforts to prevent cancer, improve adherence to cancer screening recommendations, and assure timely and appropriate cancer care for all persons is needed to achieve the national cancer objectives set forth in Healthy People 2020.
Acknowledgment
State, regional, and Puerto Rico cancer registry personnel.
1Division of Cancer Prevention and Control, National Center for Chronic Disease Prevention and Health Promotion, CDC.
Corresponding author: S. Jane Henley, shenley@cdc.gov, 770-488-4157.
References
- Kohler BA, Sherman RL, Howlader N, et al. Annual report to the nation on the status of cancer, 1975–2011, featuring incidence of breast cancer subtypes by race/ethnicity, poverty, and state. J Natl Cancer Inst 2015;107:djv048.
- US Cancer Statistics Working Group. United States cancer statistics: 1999–2012 cancer incidence and mortality data. Atlanta, GA: US Department of Health and Human Services, CDC; 2015. Available at http://www.cdc.gov/uscs.
- Wilson RJ, Ryerson AB, Zhang K, Dong X. Relative survival analysis using the Centers for Disease Control and Prevention National Program of Cancer Registries surveillance system data, 2000–2007. J Registry Manag 2014;41:72–6.
- Moyer VA. Screening for prostate cancer: US Preventive Services Task Force recommendation statement. Ann Intern Med 2012;157:120–34.
- Li J, Berkowitz Z, Hall IJ. Decrease in prostate cancer testing following the US Preventive Services Task Force (USPSTF) recommendations. J Am Board Fam Med 2015;28:491–3.
- Sabatino SA, White MC, Thompson TD, Klabunde CN. Cancer screening test use—United States, 2013. MMWR Morb Mortal Wkly Rep 2015;64:464–8.
- Indiana State Department of Health. The burden of obesity related cancers and the promotion of physical activity in Indiana, 2014. Indianapolis, IN: Indiana State Department of Health; 2015. Available at http://www.in.gov/isdh/files/Obesity_Report_2014_(2).pdf.
- Islam KMM, Jiang X, Anggondowati T, Lin G, Ganti AK. Comorbidity and survival in lung cancer patients. Cancer Epidemiol Biomarkers Prev 2015;24:1079–85.
- Idaho Cancer Policy Action Committee. Cancer Data Registry of Idaho: using area-based measures to target disparities and guide policy initiatives. J Registry Manag 2015;42:27.
- Clegg LX, Feuer EJ, Midthune DN, Fay MP, Hankey BF. Impact of reporting delay and reporting error on cancer incidence rates and trends. J Natl Cancer Inst 2002;94:1537–45.
* As of 2015, Healthy People 2020 objectives included improving the proportion of persons surviving ≥5 years after cancer diagnosis to 71.7%, reducing colorectal cancer incidence to 39.9 per 100,000 persons, reducing late-stage breast cancer incidence to 42.1 per 100,000 females, and reducing cervical cancer incidence to 7.2 per 100,000 females. Additional information available at http://www.healthypeople.gov/2020/topicsobjectives2020/default.aspx.
† Cancer registries demonstrated that cancer incidence data were of high quality by meeting the six USCS publication criteria: 1) case ascertainment ≥90% complete; 2) ≤5% of cases ascertained solely on the basis of death certificate; 3) ≤3% of cases missing information on sex; 4) ≤3% of cases missing information on age; 5) ≤5% of cases missing information on race; and 6) ≥97% of registry's records passed a set of single-field and inter-field computerized edits that test the validity and logic of data components. Additional information available at http://www.cdc.gov/uscs.
§ Additional information available at http://codes.iarc.fr/.
¶ Additional information available at http://www.bloodjournal.org/content/117/19/5019?sso-checked=true#T1.
** Additional information available at http://seer.cancer.gov/tools/ssm.
†† Population estimates incorporate bridged single-race estimates derived from the original multiple race categories in the 2010 U.S. Census. Additional information available at http://seer.cancer.gov/popdata/index.html and http://www.census.gov/popest/methodology/index.html.
§§ Calculated using the Ederer II Actuarial method, which allows more recent diagnosis years to be included and adjusts for the shorter follow-up time.
¶¶ Additional information available at http://www.uspreventiveservicestaskforce.org/Page/Name/recommendations.
*** Additional information available at http://www.thecommunityguide.org/cancer/screening/client-oriented/index.html.
††† Additional information available at http://www.cdc.gov/cancer/npcr/datarelease.htm; http://wonder.cdc.gov; http://www.statecancerprofiles.cancer.gov/incidencerates/index.php; http://www.cdc.gov/rdc/b1datatype/dt131.htm; and http://www.cdc.gov/cdi.
§§§ Additional information available at http://www.cdc.gov/cancer/npcr/uscs/technical_notes/interpreting/race.htm.
Summary
What is already known on this topic?
Many factors contribute to changes in cancer incidence, including changes in risk exposures or changes in the use of cancer screening tests.
What is added by this report?
In 2012, a total of 1,529,078 new invasive cancers were diagnosed in the United States (excluding Nevada), for an annual incidence of 483 per 100,000 among males and 412 among females. All-sites cancer incidence rates ranged by state, from 371 to 515 per 100,000 persons, and was 355 per 100,000 persons in Puerto Rico. Fewer prostate cancer cases were reported to cancer registries in 2012 than in 2011, resulting in lower prostate cancer incidence rates and lower all-sites cancer incidence rates. Healthy People 2020 targets for reducing incidence rates were reached in 30 states for colorectal cancer and 27 states for cervical cancer. Approximately two of three persons survived ≥5 years after cancer diagnosis.
What are the implications for public health practice?
Public health officials use population-based cancer surveillance data to monitor cancer incidence, mortality, and survival to guide the planning of health care allocation and support services. Maximizing efforts to prevent cancer, to improve adherence to cancer screening recommendations, and to assure timely and appropriate cancer care for all persons is needed to achieve the national cancer objectives set forth in Healthy People 2020.
FIGURE. Age-adjusted rate* of invasive cancer by cancer site and jurisdiction — National Program of Cancer Registries and Surveillance, Epidemiology, and End Results Program, 50 States, the District of Columbia (DC), and Puerto Rico (PR), 2012
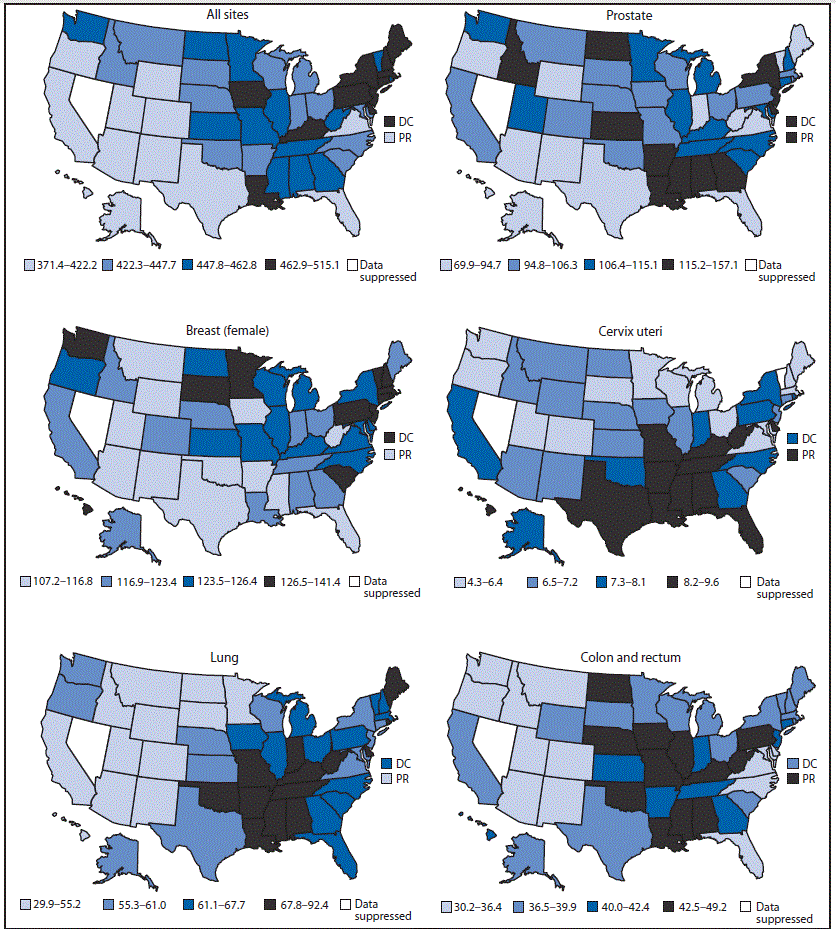
* Per 100,000 persons, age-adjusted to the 2000 U.S. standard population.
Alternate Text: The figure above is a map showing age-adjusted rate of invasive cancer by cancer site and jurisdiction for the 50 States, the District of Columbia, and Puerto Rico during 2012.
Use of trade names and commercial sources is for identification only and does not imply endorsement by the U.S. Department of
Health and Human Services.
References to non-CDC sites on the Internet are
provided as a service to MMWR readers and do not constitute or imply
endorsement of these organizations or their programs by CDC or the U.S.
Department of Health and Human Services. CDC is not responsible for the content
of pages found at these sites. URL addresses listed in MMWR were current as of
the date of publication.
All MMWR HTML versions of articles are electronic conversions from typeset documents.
This conversion might result in character translation or format errors in the HTML version.
Users are referred to the electronic PDF version (http://www.cdc.gov/mmwr)
and/or the original MMWR paper copy for printable versions of official text, figures, and tables.
An original paper copy of this issue can be obtained from the Superintendent of Documents, U.S.
Government Printing Office (GPO), Washington, DC 20402-9371;
telephone: (202) 512-1800. Contact GPO for current prices.
**Questions or messages regarding errors in formatting should be addressed to
mmwrq@cdc.gov.
