Content on this page was developed during the 2009-2010 H1N1 pandemic and has not been updated.
- The H1N1 virus that caused that pandemic is now a regular human flu virus and continues to circulate seasonally worldwide.
- The English language content on this website is being archived for historic and reference purposes only.
- For current, updated information on seasonal flu, including information about H1N1, see the CDC Seasonal Flu website.
As of April 16, 2010, the Aggregate Hospitalizations and Deaths Reporting Activity (AHDRA) has concluded for the 2009-2010 flu season. AHDRA reporting will resume for the 2010-2011 season in October 2010. |
Questions & Answers
Flu-Related Hospitalizations and Deaths in the United States from April 2009 – January 30, 2010
April 16, 2010 11:00 AM ET
This Q&A provides updated information about flu-related hospitalizations and deaths in the United States reported to CDC from April 2009 – January 30, 2010.
Surveillance
When the 2009 H1N1 flu virus was first detected in mid-April 2009, CDC worked with states to collect, compile and analyze information related to the outbreak. Initially, states reported 2009 H1N1 cases, hospitalizations and deaths to CDC. However, on July 24, 2009 states discontinued reporting of individual cases of 2009 H1N1 because as the 2009 H1N1 outbreak expanded, individual case counts become increasingly impractical and not representative of the true extent of the outbreak. Reporting of hospitalizations and deaths continued. On August 30, 2009, in anticipation of the upcoming flu season, CDC revised reporting requirements to include all laboratory-confirmed and syndromic flu-related hospitalizations and deaths (not just 2009 H1N1) and formalized this into a web-based "Aggregate Hospitalizations and Deaths Reporting Activity" (AHDRA). Because experts acknowledge that individual reports of hospitalizations and deaths likely represent an undercount of what is occurring in actuality, CDC also developed a method to estimate the full burden of 2009 H1N1 disease – cases, hospitalizations and deaths – in the United States. The methodology to derive these estimates is based in part on extrapolation from AHDRA data. However, the intent of AHDRA is to track trends (both increasing and decreasing) in influenza-associated hospitalizations and deaths by state. Reporting to AHDRA is voluntary by states (participation may vary, but about 35 states report laboratory confirmed hospitalizations and deaths each week on average). AHDRA serves as a supplement to CDC’s pre-existing influenza surveillance systems. See more information on AHDRA.
On July 31, 2009, CDC first posted a summary of key 2009 H1N1 disease characteristics based on information gathered during the first weeks of the 2009 H1N1 outbreak in “2009 H1N1 Early Outbreak and Disease Characteristics,” including information related to hospitalizations and deaths from 2009 H1N1. This web page provides a summary update of information related to laboratory-confirmed influenza-associated hospitalizations and deaths reported to CDC from April 2009 through January 30, 2010.
How many cases of 2009 H1N1 flu have been reported in the United States?
AHDRA does not collect individual case information; it only collects information related to flu-related hospitalizations and deaths. Early in the 2009 H1N1 outbreak, CDC did collect information related to 2009 H1N1 cases, but on July 24, 2009, states discontinued reporting of individual cases of 2009 H1N1 because as the outbreak expanded, individual case counts become increasingly impractical and not representative of the true extent of disease. For this reason, definitive counts of how many people have become infected with 2009 H1N1 are not available. However, CDC developed a method to provide an estimated range of the total number of 2009 H1N1 cases, hospitalizations and deaths in the United States. See the latest CDC estimates on 2009 H1N1 cases, hospitalizations and deaths.
Is there a breakdown by age of people infected with 2009 H1N1?
This information is not available through AHDRA since this system does not collect information related to individual cases of flu. However, CDC developed a method to estimate 2009 H1N1 cases, hospitalizations and deaths. CDC estimates that the largest number of 2009 H1N1 infections occurred in people 18-64 years of age. The next largest age group is children 0-17 years of age. The smallest number of 2009 H1N1 infections are estimated to have occurred in people 65 years of age and older. This data suggests that people 65 and older are less likely to get infected with 2009 H1N1. However, data on the death rate by age group (see question entitled “How many people have died from 2009 H1N1” below) shows that if people 65 and older become infected with 2009 H1N1, they are more likely to die than children and young adults in the 0-4 years and 5-24 years age groups.
How many people have been hospitalized from 2009 H1N1 since April?
From April 2009 to January 30, 2010, states have reported a total of 49,008 flu-related laboratory-confirmed hospitalizations to CDC. However, experts acknowledge that individual reports of 2009 H1N1-associated hospitalizations likely represent an undercount of what is occurring in actuality in the United States. To form a better picture of the actual number of hospitalizations associated with 2009 H1N1 illness in the United States, CDC developed a method to estimate 2009 H1N1 cases, hospitalizations and deaths.
How have different age groups been impacted by the pandemic in terms of hospitalization rates in the United States as reported through AHDRA?
Graph A (below) shows the estimated flu hospitalization rate (inclusive of both 2009 H1N1 and seasonal flu) in the United States by age group from April 15 to January 30, 2010. These estimates are based on the 49,008* hospitalizations that were reported to CDC during this time period. The reported hospitalization rate per 100,000** people was highest among children in the 0 to 4 years of age group. The hospitalization rate of children in the 0 to 4 age group with flu illness was 58.76 children per 100,000. The next highest reported hospitalization rate was in the 5 to 24 years of age group, which had a hospitalization rate of 22.64 per 100,000 people. The hospitalization rate for people in the 25 to 49 years of age group was 16.19 per 100,000 people. The hospitalization rate for people 50 to 64 years of age was 22.17 per 100,000 people, and the hospitalization rate for people 65 years and older was lowest at 16.01 per 100,000. The overall hospitalization rate associated with 2009 H1N1 across all age groups was 22.24 per 100,000 people.
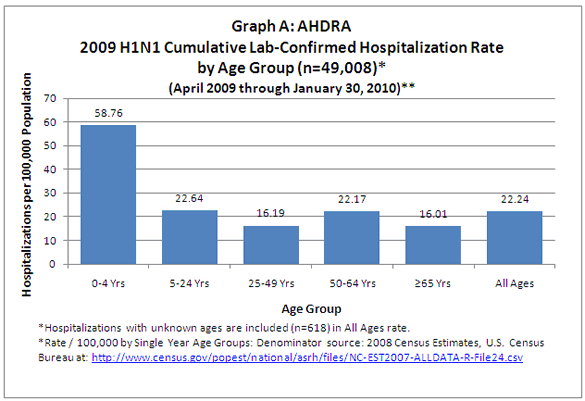
*Of the total population of hospitalizations (n=49,008) 618 cases were omitted from this analysis due to missing ages.
**The denominator in these calculations is derived from national population census data and is comprised of states that reported using a laboratory-confirmed surveillance definition. From April-August, 2009, this was the entire U.S. population. From August 2009 to the present, the denominator included the populations of only those states (on average, 35) that elected to continue reporting using a laboratory-confirmed surveillance definition. Because only a fraction of people with influenza symptoms are likely to have been tested for 2009 H1N1 or seasonal flu, these rates underestimate the actual rates. However, the relative difference in rates between age groups is what is most important about these data.
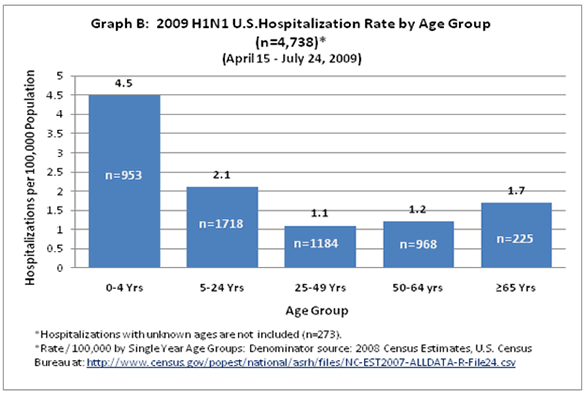
Graph B shows the hospitalization rates by age group reported by CDC early in the pandemic, using data collected from April 15 – July 24, 2009. The data shown in Graph A (dated April 15 – January 30, 2010) confirms that young children 0-4 years of age still have the highest rates of flu-associated hospitalizations compared to other age groups. In fact, children 0-4 years old are about two and a half times more likely to be hospitalized than people 5-24 years old, who have the second highest risk of flu-related hospitalization, according to the cumulative AHDRA hospitalization numbers. Children in the 0-4 age group were at highest risk of hospitalization early on in the pandemic as well, as depicted in Graph B (April 15 – July 24, 2009).
The overall pattern of hospitalization rates, as depicted in Graphs A and B, remains similar. However, a shift has occurred in the flu-associated hospitalization rates in people 65 years of age and older. Early in the pandemic, as shown in Graph B, people 65 years of age and older had a higher chance of being hospitalized due to 2009 H1N1 illness than people in the 25-49 years or 50-64 years age groups. Current data, as shown in Graph A, indicates that people 65 and older have the lowest flu-associated hospitalization rates. For more information on hospitalization rates from April 15 – July 24, 2009, see 2009 H1N1 Early Outbreak and Disease Characteristics.
How many people have died from 2009 H1N1?
States reported 2,498* flu-related deaths to CDC during April 2009 through January 30, 2010. However, experts acknowledge that individual reports of 2009 H1N1 associated deaths likely represent an undercount of what is actually occurring in the United States. To form a better picture of the actual number of hospitalizations associated with 2009 H1N1 illness in the United States, CDC developed a method to estimate 2009 H1N1 cases, hospitalizations and deaths.
How have different age groups been affected by 2009 H1N1 flu and seasonal flu in terms of death rates as reported to AHDRA?
Graph C (below) shows the estimated flu-associated death rates as reported by states from April 15 to January 30, 2010.
These estimates are based on the 2,498* deaths that were reported to CDC during this time period. The reported death rate per 100,000** people was highest among adults in the 50-65 years of age group. The death rate of adults in the 50 to 64 years of age group with 2009 H1N1 flu illness was 1.69 adults per 100,000. The next highest reported death rate was in the 25-49 years of age group, which had a death rate of 1.03 per 100,000 people. The death rate for people in the 65 years and older age group was 1.02 per 100,000 people. The death rate for people 5-24 years of age was 0.5 per 100,000 people, and the death rate for children 0-4 years of age was lowest at 0.47 per 100,000. The overall death rate associated with 2009 H1N1 was 0.97 per 100,000 persons across all age groups.
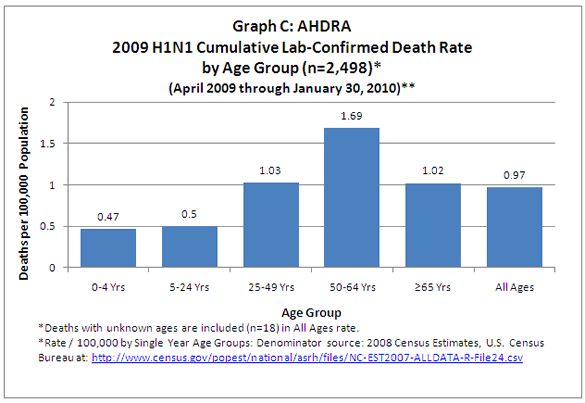
*Of the total population of deaths (n=2,498) 18 cases were omitted from this analysis due to missing ages.
**The denominator in these calculations is derived from national population census data and is comprised of states that reported using a laboratory-confirmed surveillance definition. From April-August, 2009, this was the entire U.S. population. From August 2009 to the present, the denominator included the populations of only those states (on average, 35) that elected to continue reporting using a laboratory-confirmed surveillance definition. Because only a fraction of people with influenza symptoms are likely to have been tested for 2009 H1N1 or seasonal flu, these rates underestimate the actual rates. However, the relative difference in rates between age groups is what is most important about these data.
Get email updates
To receive weekly email updates about this site, enter your email address:
Contact Us:
- Centers for Disease Control and Prevention
1600 Clifton Rd
Atlanta, GA 30333 - 800-CDC-INFO
(800-232-4636)
TTY: (888) 232-6348 - Contact CDC-INFO
