Asthma as the Underlying Cause of Death
Asthma deaths have decreased over time and varied by demographic characteristics.
Particularly among children and young adults, deaths due to asthma are rare and are thought to be largely preventable. National asthma guidelines recommend early treatment and supportive efforts that focus on providing quality health care and patient education to patients who are at high risk of asthma-related death.
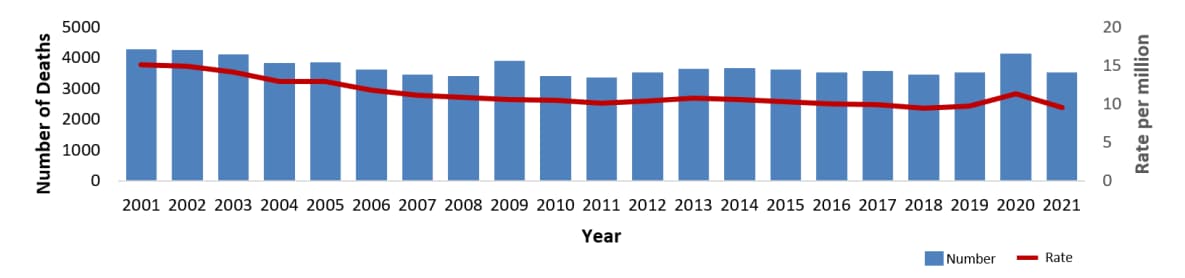
Number and age-adjusted rate of asthma deaths by year, United States 2001-2021
Asthma Deaths Decreased
The rate of asthma deaths decreased from 15 per million in 2001 (n=4,269) to 10.6 per million (n=3,517) in 2021. The rate of asthma deaths was higher in 2020 compared with 2019 and 2021. This increase may have been due to the increase in deaths due to the COVID-19 pandemic.
Other Key Findings
- Adults were more than six times more likely than children to die from asthma.
- The asthma death rate was highest among the 65 years and older age group compared with all other age groups.
- Females had a higher death rate compared with males.
- Non-Hispanic blacks were nearly three to four times more likely to die from asthma compared with other race and ethnic groups (non-Hispanic white, non-Hispanic other, and Hispanics).
- Among children, boys and non-Hispanic blacks were more likely to die from asthma.
- Among adults, non-Hispanic blacks and women were more likely to die from asthma.
CDC’s National Asthma Control Program (NACP) was created in 1999 to help the millions of people with asthma in the United States gain control over their disease. The NACP conducts national asthma surveillance and funds states to help them improve their asthma surveillance and to focus efforts and resources where they are needed.
2001-2021 Asthma Deaths by Demographic Characteristics
| Total | Child | Adult | ||
|---|---|---|---|---|
| Rate | Rate (SE) | Rate (SE) | Rate (SE) | |
| Total | Crude | 10.6 (0.2) | 2.0 (0.2) | 13.1 (0.2) |
| Age-adj* | 9.5 (0.2) | 2.0 (0.2) | 12.0 (0.2) | |
| Sex | ||||
| Male | Crude | 8.7 (0.2) | 2.4 (0.3) | 10.6 (0.3) |
| Age-adj* | 8.4 (0.2) | — | 10.2 (0.3) | |
| Female | Crude | 12.5 (0.3) | 1.6 (0.2) | 15.4 (0.3) |
| Age-adj* | 10.5 (0.2) | — | 13.7 (0.3) | |
| Race/Ethnicity | ||||
| White (NH) | Crude | 9.8 (0.2) | 1.0 (0.2) | 11.8 (0.3) |
| Age-adj* | 7.7 (0.02) | 1.0 (0.2) | 9.8 (0.2) | |
| Black (NH) | Crude | 24.4 (0.8) | 7.7 (0.9) | 29.7 (1.0) |
| Age-adj* | 24.2 (0.8) | 7.8 (0.9) | 29.8 (1.0) | |
| Other (NH) | Crude | 6.3 (0.5) | Suppressed | 9.9 (0.8) |
| Age-adj* | 7.1 (0.5) | Suppressed | 8.8 (0.6) | |
| Hispanic | Crude | 5.8 (0.3) | 1.4 (0.3) | 7.8(0.4) |
| Age-adj* | 7.3 (0.4) | 1.4 (0.3) | 9.0 (0.5) | |
| Not Hispanic | Crude | 11.7 (0.2) | 2.2 (0.2) | 14.1 (0.3) |
| Age-adj* | 10.1 (0.2) | 2.2 (0.2) | 12.6 (0.2) | |
| Age Group (years) | ||||
| 0-4 | Crude | – | 1.4 (0.3) | – |
| 5-17 | Crude | – | 2.2 (0.2) | – |
| 18-34 | Crude | – | – | 5.4 (0.3) |
| 35 – 64 | Crude | – | – | 11.5 (0.3) |
| 65+ | Crude | – | – | 27.1 (0.8) |
Note: NH = Non-Hispanic, SE = Standard Error
Asthma deaths = ICD-10 codes J45-J46
Crude = Crude rate
Age-adj = Age-adjusted rate
Child = <17 years of age
Adult = >18+ years of ager
*Rates are age-adjusted to the 2000 standard population.
Other NH = American Indian, or Alaska Native, Asian, Native Hawaiian or Other Pacific Islander and more than one race
Suppressed = the counts fall between 1 and 9 deaths. Underlying Cause of Death 1999-2020 (cdc.gov)
Source: CDC WONDER, Underlying Cause of Death database, 2018–2021, by Single Race Categories (Underlying Cause of Death, 2018–2021, Single Race Request (cdc.gov))