Use of long-term control medication among persons with active asthma
Using long-term control medications daily helps prevent symptoms
Long-term control (LTC) medications help reduce airway inflammation, control chronic symptoms, and prevent asthma attacks. These medications do not relieve asthma symptoms quickly. To achieve and maintain control of asthma, most people must use LTC medications daily(EPR-3‡).
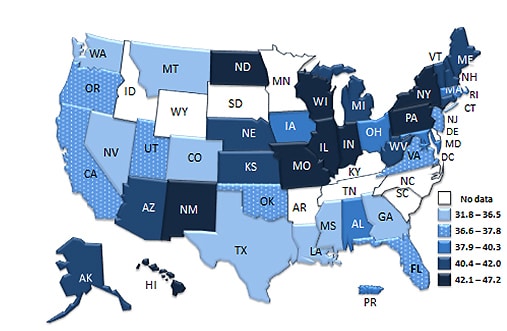
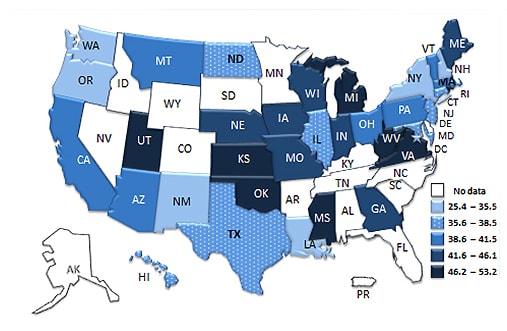
Nearly 39.0% of all adults§ and 40.2% of all children§ with self-reported active asthma used at least one kind of LTC medication in the past 3 months.
Percentage of Adults with Active Asthma Who Used LTC Medications

Percentage of Children with Active Asthma Who Used LTC Medications

The percentage of people with asthma who used LTC medications varied by state. Percentages of adults ranged from 31.8% in Mississippi to 47.2% in North Dakota. Percentages of children ranged from 25.4% in Oregon to 53.2% in Mississippi.
*Reported any of the following during the past year: asthma medication use, asthma symptoms, or doctor visits for asthma
‡ Expert Panel Report 3 (EPR-3): Guidelines for the Diagnosis and Management of Asthma-Summary Report 2007
§ Child=Age ≤17 years, Adults=Age 18 years and older
Download this AsthmaStats Factsheet [PDF – 229 KB] containing additional information.
CDC’s National Asthma Control Program was created in 1999 to help the millions of people with asthma in the United States gain control over their disease. The Program conducts national asthma surveillance and provides funds to states to help improve asthma surveillance and focus efforts and resources where they are needed.
| Use of LTC Medications | ||
|---|---|---|
| Adults with Active Asthma | Children with Active Asthma | |
| STATE | % | % |
| Total** | 39.0 | 40.2 |
| AL | 38.8 | — |
| AK | 40.4 | — |
| AZ | 41.5 | 40.7 |
| CA | 37.1 | 41.1 |
| CO | 33.3 | — |
| CT | 40.6 | 35.8 |
| DC | 39.0 | 33.5 |
| FL | 37.2 | — |
| GA | 33.5 | 43.7 |
| HI | 42.7 | 35.6 |
| IL | 42.1 | 36.6 |
| IN | 42.5 | 44.4 |
| IA | 38.2 | 42.2 |
| KS | 40.8 | 49.6 |
| LA | 34.3 | 34.5 |
| ME | 41.3 | 43.1 |
| MD | 38.3 | 37.5 |
| MA | 39.8 | 40.4 |
| MI | 40.4 | 47.5 |
| MS | 31.8 | 53.2 |
| MO | 42.6 | 45.1 |
| MT | 34.8 | 38.6 |
| NE | 41.9 | 45.5 |
| NV | 35.3 | — |
| NH | 40.8 | 30.3 |
| NJ | 37.7 | 38.1 |
| NM | 45.1 | 34.2 |
| NY | 44.4 | 34.9 |
| ND | 47.2 | 38.2 |
| OH | 37.9 | 40.4 |
| OK | 37.1 | 48.7 |
| OR | 37.7 | 25.4 |
| PA | 43.7 | 39.4 |
| RI | 38.2 | 48.4 |
| TX | 34.8 | 37.3 |
| UT | 36.6 | 46.2 |
| VT | 40.4 | 40.8 |
| VA | 37.0 | 51.7 |
| WA | 36.5 | 29.7 |
| WV | 41.4 | 53.1 |
| WI | 43.5 | 41.6 |
| U.S. Territory | ||
| PR | 37.4 | — |
** Includes 41 states for adults and 35 states for children, plus D.C., excludes Puerto Rico
— Data are not available