Flu Vaccination Among Children With Current Asthma, 2018–2020
Sixty-nine percent of children with current asthma received flu vaccination
Influenza virus infection (flu) can worsen asthma symptoms, trigger asthma attacks, and may lead to pneumonia.* Vaccination (shot or nasal spray) is the best protection against flu. Centers for Disease Control and Prevention (CDC) recommends that people 6 months of age and older get a flu vaccination† every year to protect against flu and complications from it. The flu nasal spray is approved only for ages 2–49 years.*
Sixty-nine percent of children with current asthma† received flu vaccination during 2018–2020. The vaccination percentage did not differ significantly by demographic characteristics (Table 1). The percentage of children (aged 0–17 years) with current asthma who had flu vaccination varied by state. The percentage ranged from 52.6% in Michigan to 91.2% in Connecticut (Table 2).
Percentage of Children With Current Asthma Who Received Flu Vaccination by Demographics, 2018–2020
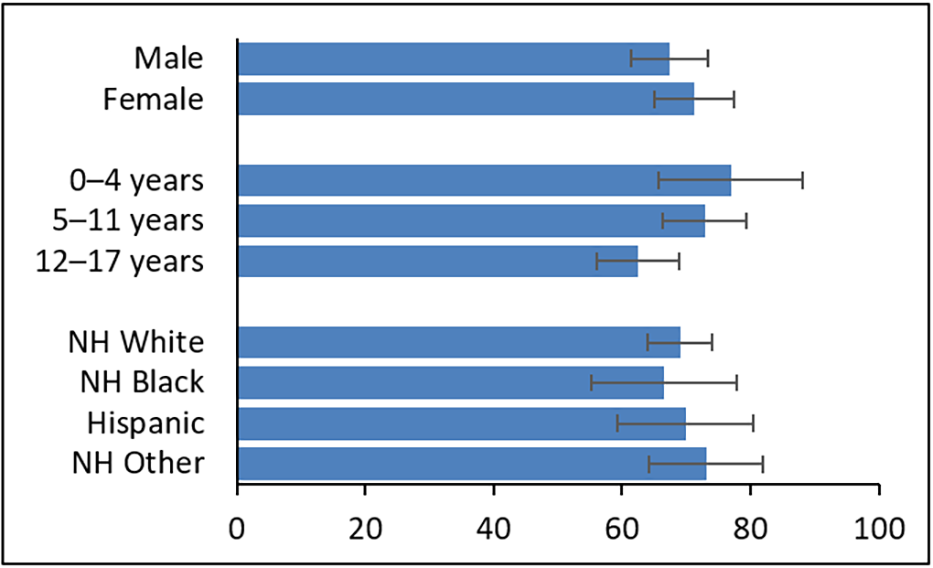
Table 1. Percentage of Children With Current Asthma Who Received Flu Vaccination by Demographics, 2018–2020
| Characteristics | Percent | 95% CI | SE | Y-error bar (=1.96*SE) |
|---|---|---|---|---|
| Male (sex at birth) |
67.4 | (61.0–73.1) | 3.10 | 6.1 |
| Female (sex at birth) |
71.2 | (64.6–77.1) | 3.19 | 6.3 |
| 0–4 years | 77.0 | (63.9–86.3) | 5.72 | 11.2 |
| 5–11 years | 72.9 | (66.0–78.9) | 3.32 | 6.5 |
| 12–17 years | 62.5 | (55.8–68.7) | 3.30 | 6.5 |
| NH White | 69.0 | (63.8–73.7) | 2.54 | 5.0 |
| NH Black | 66.6 | (54.5–76.8) | 5.76 | 11.3 |
| Hispanic | 69.9 | (58.4–79.3) | 5.39 | 10.6 |
| NH Other | 73.1 | (63.3–81.0) | 4.55 | 8.9 |
| STATE | % | % 95% CI | SE |
|---|---|---|---|
| Total§ | 69.0 | (64.5–73.2) | 2.20 |
| CA | 79.8 | (67.6–88.2) | 5.26 |
| CT | 91.2 | (85.4–94.8) | 2.34 |
| FL | 55.9 | (40.8–69.9) | 7.65 |
| GA | 57.5 | (41.3–72.2) | 8.12 |
| HI | 73.1 | (59.0–83.7) | 6.35 |
| IN | 62.3 | (48.5–74.4) | 6.76 |
| KS | 71.4 | (60.3–80.5) | 5.20 |
| ME | 74.2 | (62.0–83.5) | 5.51 |
| MI | 52.6 | (43.3–61.7) | 4.73 |
| MN | 73.8 | (64.5–81.4) | 4.32 |
| MO | 70.1 | (56.6–80.8) | 6.28 |
| MT | 54.3 | (37.8–69.9) | 8.47 |
| NE | 75.9 | (65.0–84.3) | 4.93 |
| NM | 67.4 | (50.1–81.0) | 8.08 |
| NY | 73.0 | (54.2–86.1) | 8.03 |
| OH | 71.1 | (59.1–80.7) | 5.55 |
| PA | 66.5 | (49.6–80.1) | 7.99 |
| RI | 80.4 | (63.5–90.6) | 6.90 |
| UT | 64.8 | (56.0–72.6) | 4.26 |
| VT | 72.4 | (61.0–81.5) | 5.29 |
| WI | 62.0 | (46.6–75.3) | 7.52 |
Abbreviation: NH, Non-Hispanic; SE, standard error; CI, confidence interval
Data Source: Behavioral Risk Factors Surveillance System (BRFSS)—Child Asthma Call-back Survey Data, 2018-2020 *https://www.cdc.gov/flu/asthma/index.htm
†Includes “yes” response to either question: “A flu shot is an influenza vaccine injected in your arm. During the past 12 months, did {CHILD’S NAME} had a flu shot?” or “A flu vaccine that is sprayed in the nose is called FluMistTM. During the past 12 months, did {he/she} have a flu vaccine that was sprayed in his/her nose?”
¶Includes persons who answered “yes” to the questions: “Have you ever been told by a doctor or other health professional that {CHILDName} had asthma?” and “Does {he/she} still have asthma?”
§Total includes the 21 participating states