Flu Vaccine among Adults with Current Asthma
More adults with asthma than adults without asthma reported having a flu vaccine
People with asthma are at high risk of complications from flu. Flu infection in the lungs can trigger asthma attacks, worsen asthma symptoms, and lead to pneumonia. CDC recommends that people 6 months of age and older get a flu vaccine every year to protect against getting the flu and complications from flu.
Percentage of flu vaccination among adults with asthma
Percentage of flu vaccination among adults
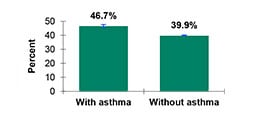
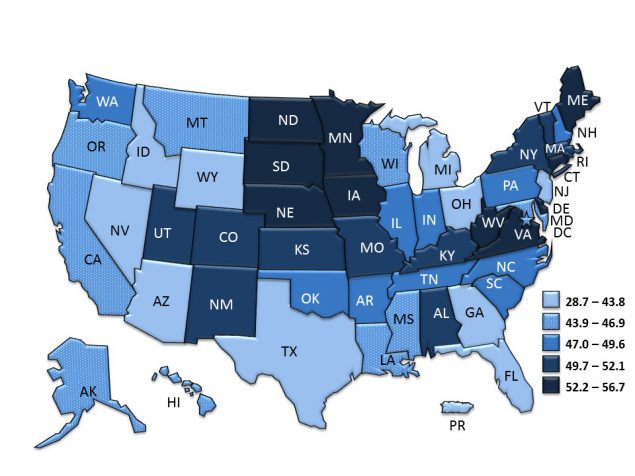
In 2015, a greater percentage of adults (aged 18 years and older) with asthma* reported having a flu vaccine in the past 12 months (46.7 %) than did adults without asthma (39.9%). Flu vaccination status varied by state. The percentage of adults with asthma who reported receiving a flu vaccine in the past 12 months ranged from 28.7% in Puerto Rico to 56.7% in Rhode Island (see table).
CDC’s National Asthma Control Program (NACP) was created in 1999 to help the millions of people with asthma in the United States gain control over their disease. The NACP conducts national asthma surveillance and funds states to help them improve their asthma surveillance and to focus efforts and resources where they are needed.
*Includes persons who answered “yes” to the questions: “Has a doctor, nurse, or other health professional EVER told you that you had asthma?” and “Do you still have asthma?”
†During the past 12 months, have you had either a flu shot or a flu vaccine that was sprayed in your nose?
| Flu Vaccination† among Adults with Asthma* | Flu Vaccination† among Adults without Asthma* | |
|---|---|---|
| STATE | % | % |
| U.S. Total§ | 46.7 | 39.9 |
| AL | 51.7 | 39.7 |
| AK | 46.7 | 34.5 |
| AZ | 40.0 | 33.2 |
| AR | 48.0 | 41.2 |
| CA | 45.5 | 36.9 |
| CO | 50.7 | 44.2 |
| CT | 53.5 | 45.3 |
| DE | 54.4 | 43.5 |
| DC | 46.0 | 39.8 |
| FL | 35.4 | 31.0 |
| GA | 42.7 | 35.6 |
| HI | 45.9 | 40.9 |
| ID | 39.8 | 35.3 |
| IL | 48.3 | 35.8 |
| IN | 47.5 | 37.6 |
| IA | 55.6 | 49.3 |
| KS | 51.5 | 41.7 |
| KY | 50.8 | 44.2 |
| LA | 45.8 | 38.6 |
| ME | 55.0 | 41.9 |
| MD | 46.5 | 42.7 |
| MA | 50.0 | 43.4 |
| MI | 42.8 | 35.4 |
| MN | 53.7 | 46.1 |
| MS | 45.4 | 40.1 |
| MO | 51.8 | 45.0 |
| MT | 44.5 | 40.0 |
| NE | 52.2 | 46.8 |
| NV | 33.9 | 31.9 |
| NH | 47.1 | 45.3 |
| NJ | 43.4 | 39.8 |
| NM | 50.1 | 39.1 |
| NY | 51.3 | 41.0 |
| NC | 47.6 | 47.7 |
| ND | 54.3 | 42.7 |
| OH | 40.1 | 37.8 |
| OK | 48.1 | 45.8 |
| OR | 45.5 | 39.1 |
| PA | 49.1 | 42.9 |
| RI | 56.7 | 46.6 |
| SC | 48.3 | 38.9 |
| SD | 52.9 | 54.1 |
| TN | 49.4 | 41.7 |
| TX | 43.6 | 43.2 |
| UT | 49.7 | 38.5 |
| VT | 50.4 | 43.0 |
| VA | 54.0 | 43.4 |
| WA | 49.3 | 42.6 |
| WV | 54.1 | 46.5 |
| WI | 46.3 | 36.8 |
| WY | 42.6 | 34.9 |
| U.S. Territories | ||
| GU | 30.8 | 29.7 |
| PR | 28.7 | 25.8 |
§ U.S. Total includes 50 states plus DC and excludes Puerto Rico and Guam
Source: Behavioral Risk Factor Surveillance System (BRFSS), 2015
Download this AsthmaStat Cdc-pdf[PDF – 598 KB]