Updating the Estimates of the Future Number of Cases in the Ebola Epidemic—Liberia, Sierra Leone, and Guinea, 2014–2015
January 8, 2014
Summary
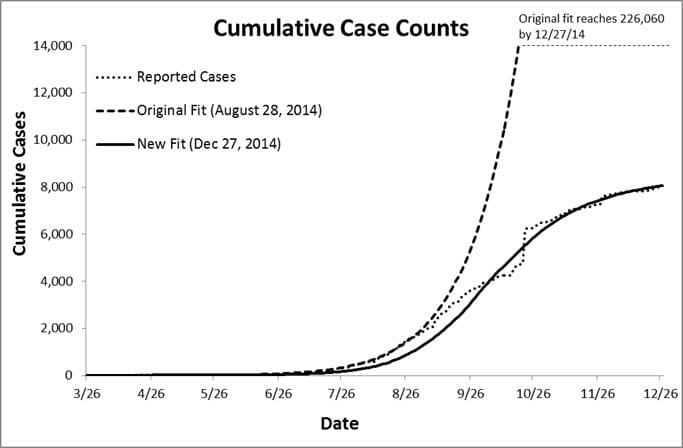
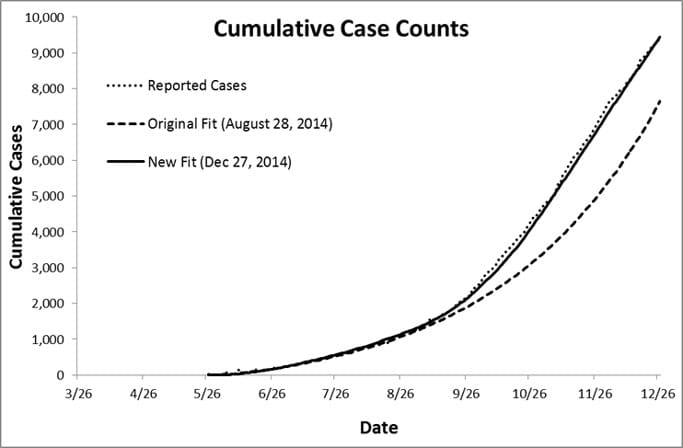
The Ebola epidemic continues in Guinea, Liberia and Sierra Leone. In Liberia, however, there has been a dramatic decrease in the rate of growth of cumulative total cases (confirmed + probable + suspect). The initial estimates were that, in the absence of any increase in interventions or changes in human behavior, by December 27, 2014 there would have been approximately 226,000 cumulative cases in Liberia (1). By that date, however, there were 8,012 reported cumulative cases in Liberia (2). For Sierra Leone, there were 9,409 reported cumulative cases by December 27, 2014, compared to the approximate 7,600 cumulative cases that were initially estimated (2). In Guinea, by December 27, 2014, there were 2,695 cumulative cases reported (2) (Guinea, in late August, had shown no distinctive pattern in growth of cases, and thus it was not included in the initial estimates of future cases).
To update the estimates of future cases to March 20, 2015, the following three scenarios were used:
- A baseline projection of the total cases (confirmed + probable + suspect) obtained by projecting forward assuming no further changes in interventions or human behavior.
- Lower and upper bounds of the projected number of future cases: A lower bound was calculated by moving 10% of cases (per 30 day period) from the category of “no effective home isolation and without safe burial” into either Ebola Treatment Units (ETUs) or Community Care Centers (CCCs) (including safe burials), where there is a lower risk of Ebola transmission. An upper bound was calculated by moving 10% of cases, per 30 day period, from ETUs and CCCs into the “no effective home isolation and without safe burial” category.
- A baseline projection but using only confirmed cases. Again, calculated assuming no further changes in interventions or human behavior.
To correct for possible underreporting of cases, reported cases were corrected (i.e., multiplied) by a factor of 2.0 for Sierra Leone and Guinea, and 1.5 for Liberia. The scenarios described above were then re-estimated using these corrected data. For more detailed information about the model, see Meltzer et al. (1).
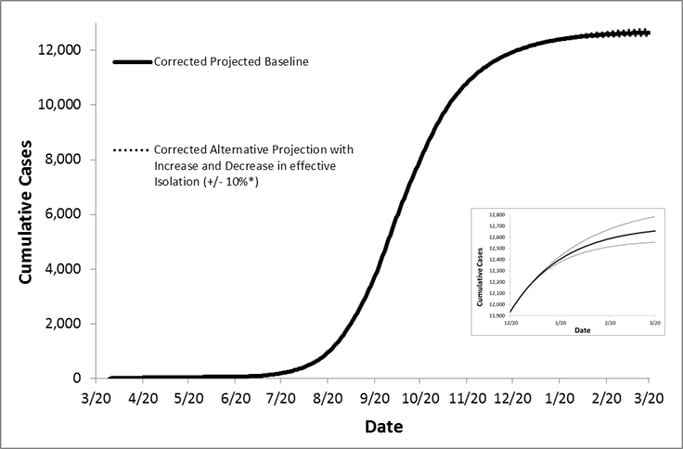
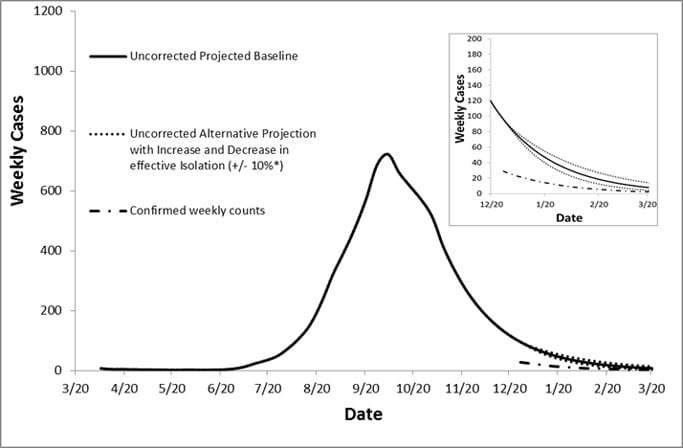
Liberia: by March 20, 2015, total cumulative cases could range from approximately 8,400 cases (lower bound 8,400 to upper bound 8,500) to 12,700 cases (12,600 –12,800). The latter estimates are corrected for possible underreporting using a factor of 1.5. Weekly case counts, for the week of March 15 -21, 2015, could range from approximately 8 (4 – 14) to 12 (6 – 21). For the same week, confirmed cases could range from approximately 2 to 3 per week (upper estimate corrected for underreporting).
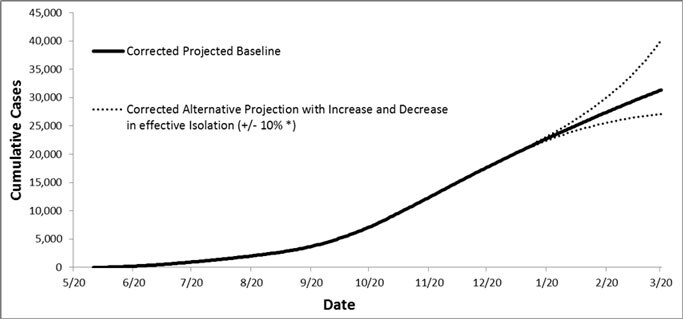
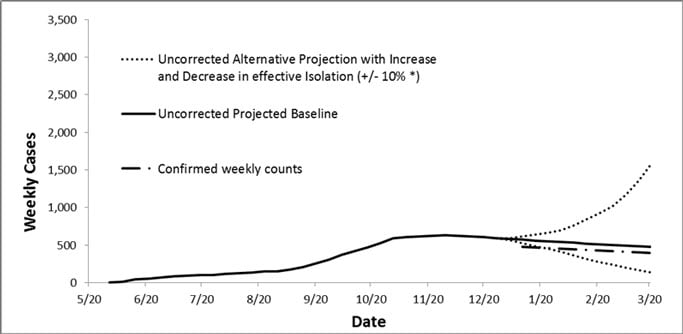
Sierra Leone: by March 20, 2015, cumulative cases could range from approximately 15,700 (13,500 – 20,100) to 31,300 (27,100 – 40,100) when corrected for possible underreporting using a factor of 2.0). For the week of March 15-21, 2015, weekly cases could range from approximately 470 (140 – 1,600) to 950 (270 – 3,200). For the same week, confirmed cases could range from approximately 400 – 800 per week.
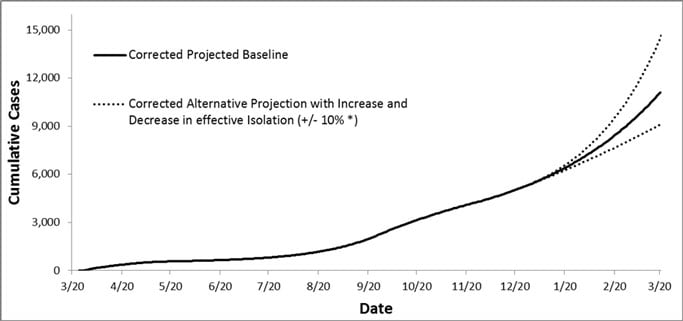
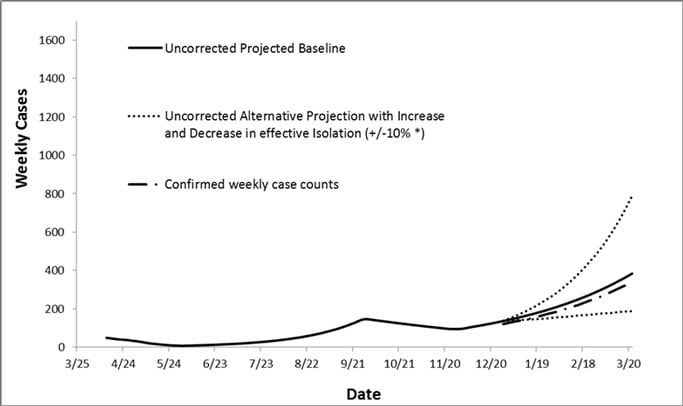
Guinea: by March 20, 2015, cumulative cases could range from approximately 5,500 (4,600 – 7,200) to 11,000 (9,100 – 14,500). For the week of March 15-21, 2015, weekly case counts could range from approximately 380 (190 – 790) to 770 (380 – 1,600). For the same week, confirmed cases could range from approximately 340 – 680 cases per week.
These projections should be interpreted with caution since they are contingent upon the assumptions of the model (1). Prior trends of Ebola in the region have included increases and decreases, and both the degree of underreporting and the percentage used to construct upper and lower bounds are only estimates (1).
Commitments made by the U.S. government and international organizations are underway to increase the number of trained staff and number of beds in both ETUs and CCCs to sufficient levels (4,5). Ministries of Health in the three affected countries have increased their capacities to conduct community-level Ebola sensitization campaigns (6). These campaigns educate the communities about how to appropriately aid a person sick with Ebola, including where they can take such a case to receive medical care or reduce the risk of onward transmission. There have been reports of improvements in the percentage of cases who died of Ebola and are safely buried (4,5,6). The reduction of cases in Lofa county, Liberia is an example of how the improvements in response, including provision of ETU-based hospital beds and community based engagement, can result in the control of an Ebola outbreak (7). Thus, these measures to control Ebola are anticipated to make the higher projections in this report much less likely.
These estimates, however, clearly demonstrate that more work needs to be done to control and eventually end the epidemic. The upper bound estimates, produced by assuming just a 10% future increase in the number of cases without adequate isolation or safe burial when needed, suggest the need to continue and increase the speed and intensity of the response.
Introduction
This report updates the previously reported estimates of the future total number of Ebola cases (confirmed + probable + suspect cases) in the Ebola epidemic in Liberia and Sierra Leone (1). Changes in the course of the epidemic make such updates a necessary component of response planning. Guinea was not included in the original estimates of future cases because previously there were uneven patterns of growth in cases, making it difficult to extrapolate forward with confidence. Recently, there has been renewed growth in case numbers in Guinea (2), and in this report, we have included a fit of the Guinean data. These calculations were performed using EbolaResponse, a spreadsheet-based modeling tool developed by CDC that can be used to estimate possible future cases.
Including confirmed, probable, and suspect cases in the estimates of future cases is essential for planning the public health response, as all three categories require public health resources such as laboratory testing and public health officials to manage the required logistics.
Methods
Fitting the model and data sources: Previously described methods (1) to estimate future cases by using the EbolaResponse modeling tool were used for this analysis. The model apportions Ebola cases into three categories as follows: 1) hospitalized and effectively isolated, such as in ETUs, where disease transmission is low; 2) at home or in the community–based CCCs such that that there is reduced risk of disease transmission (including safe burial when needed); and 3) no effective home isolation with increased risk of disease transmission, and without safe burial. The risk of daily onward transmission in each of the three categories was left unchanged from the original calculations (0.02, 0.03 and 0.3 infections per infectious persons per day) (1).
The initial set of estimates of future Ebola cases used reported cases counts through August 28, 2014 (1). In this update, case counts through December 27, 2014 are used for all three countries. The primary data sources used in this report consist of aggregated case counts obtained from situation reports compiled by the ministries of health in Liberia, Sierra Leone, and Guinea. Total case counts include all suspected, probable, and confirmed cases as defined by each country. These data reflect reported cases, which make up an unknown proportion of all actual cases, and reporting delays that vary from country to country (2, 3).
Imported cases: To improve the correspondence between the estimated cases (produced by the model) and the reported cases, users of EbolaResponse can add in “imported cases,” which represent either cases of Ebola in persons who travel into the community undetected from other areas affected by an outbreak or persons with Ebola who might represent previously undetected chains of transmission. For this update, there was no need to include “imported cases” to improve the fit of the models for the three countries.
Weekly case counts: Weekly cases were calculated by subtracting cumulative cases at the beginning of a given week from the cumulative cases at the end of that week.
Estimates of future cases: 3 scenarios: Estimates of future cases were calculated using 3 scenarios, as follows:
- Baseline projections of future cases were calculated by using the same method previously described (1). Essentially, the distribution of cases into the three groups was calculated by fitting the model to the actual reported cases and projecting forward, producing estimates of future cases. As in the original report, extrapolations to produce baseline projections through March 20, 2015, were made by assuming that the trends continue without additional interventions or changes in human behavior regarding cases with Ebola.
- Lower bound alternative projections of the number of future cases were calculated by reducing by 10%, every 30 days, the number of cases in the category “no effective home isolation and without safe burial”. Those 10% of cases removed from this latter category were equally distributed among the other two categories described in the Methods section, including cases in ETUs and CCCs, where there is a much lower risk of transmission. Similarly, an upper alternative projection was calculated by removing 10% of cases, every 30 days, in ETUs or in an environment with reduced risk of transmission (including from safe burials) and placing them in the high risk of transmission category. The lower bound projections, therefore, represent enhanced interventions and changes in human behavior that can possibly reduce the risk of continued transmission. The upper bound represents a relaxation of such efforts and a reversion to behaviors that increase risk of transmission. The 10% decrease and increase were based on the epidemic curve from Lofa County, Liberia (7). An examination of changes in the 7-day average number of daily cases revealed a 20% decrease for the period from October 5 to October 12. This decrease, however, represented the difference between the 7-day average of 15 cases on October 5 and the 7-day average of 12 cases on October 15. In order to be conservative and to not overestimate changes in future trends, the 20% was halved to produce the 10% change used in estimating the alternative low and high projections.
- Baseline projections of weekly case counts using only laboratory-confirmed cases. This is the same as scenario i, but using only laboratory-confirmed cases calculated as a proportion of all cases (confirmed + probable + suspect). According to recent World Health Organization (WHO) situation reports, the proportion of confirmed cases among all reported cases was approximately 0.3 for Liberia, 0.84 for Sierra Leone, and 0.89 for Guinea (8).
Logistical consequences: No assumptions were made regarding how the 10% decrease or increase in cases used in Scenario 2 would actually be achieved. There are innumerable factors that could cause a decrease (or increase) in cases in the category of “no effective home isolation and without safe burial.” A decrease could occur as a result of increased public health interventions, such as additional ETU and CCC beds, as well as greater acceptance by communities of safe burials of persons who died of Ebola (7). An increase in cases could occur if there is a reduction in public health resources focused on controlling the Ebola epidemic, and/or if communities revert to practices that pose a risk of onward transmission, including unsafe burials.
Adjusting for underreporting: Substantial underreporting of cases is believed be occurring (2, 4). As in the initial report, a set of estimates has been produced to correct for underreporting (1). Underreporting was corrected using a factor of 2.0 for Guinea and Sierra Leone, and 1.5 for Liberia. These correction factors were based on qualitative assessments from public health officials working in the field in all three countries and are lower than the factor of 2.5 used in the initial report (1). Lower underreporting rates reflect improvements data collection because it shows more cases are being documented.
Illustrating the reduction in Ebola cases related to potential increases in ETU beds over time – by using the adapted version of the EbolaResponse tool: Appended is an adapted version of EbolaResponse that has been modified to estimate the effect of changes in the numbers of beds available in ETUs and CCCs. As ETU and CCC capacity is increased and becomes available over time (i.e., according to a schedule of bed availability), this adapted version of EbolaResponse allows a user to adjust the percentage of cases in ETUs and CCCs such that the modeled cases in ETUs and CCCs match the available beds. Instructions for using the adapted version are also included.
The use of this adapted version is demonstrated by using an assumed dataset of a schedule with an increase over time in the number of available ETU beds. The percentage of cases in ETUs was then adjusted so that the numbers of cases in ETU beds closely matched the available beds in any given week. The resulting weekly Ebola case count is then plotted, allowing the user to determine if the schedule of available beds is sufficient to “bend the curve” of weekly cases and thus bring a decline in the number of cases and an eventual halt to the Ebola epidemic.
Results
Original Fit of model to reported cases
Liberia: Compared with the estimates made at the end of August 2014, the growth of the epidemic in Liberia appears to have slowed. Instead of the previous forecast of approximately 226,000 cases by end of December 2014, there were 8,012 cumulative reported cases reported on December 27, 2014 (Figure 1a).
Sierra Leone: There were 9,409 cumulative reported cases to December 27, 2014 (Figure 1b). This is an increase over the approximate 7,600 that were originally forecast to occur by that date (1).
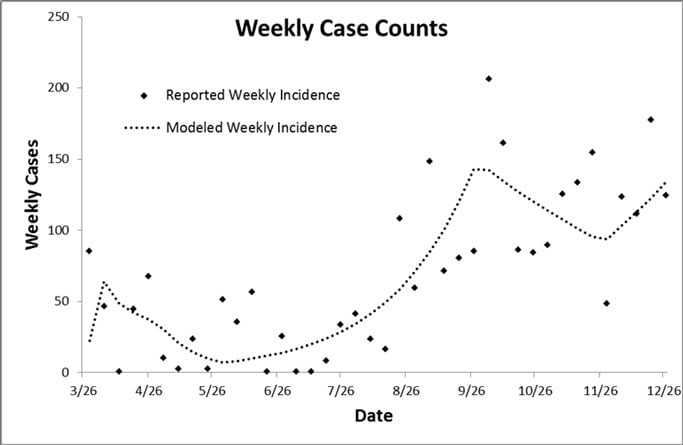
Guinea: This report contains the first estimates of fit and extrapolation for Guinea. There were 2,695 cumulative reported cases by December 27, 2014, with an upward trend (Figure 1c).
Weekly case incidence
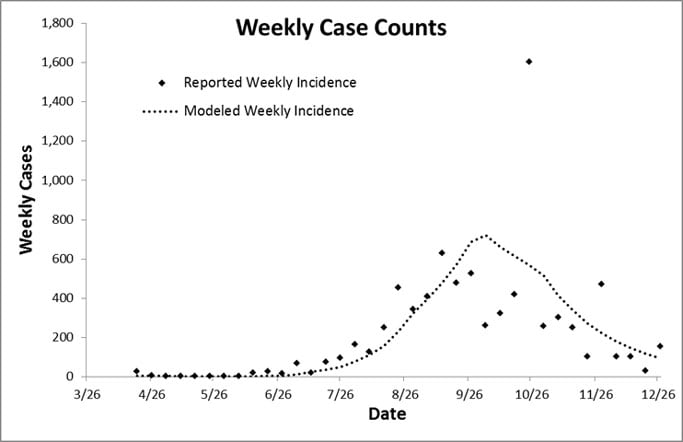
Liberia: Since mid-October, there has been a notable decline in weekly case counts to approximately 100 to 150 by end of December, 2014 (Figure 1a), from a peak of approximately 600 cases per week in mid-September.
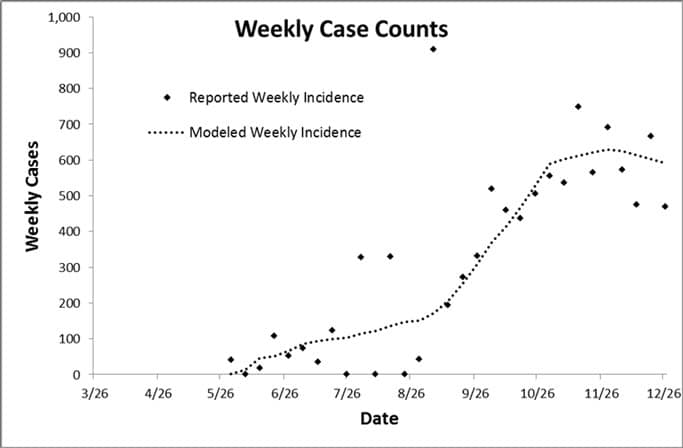
Sierra Leone: Since late October, Sierra Leone has experienced approximately 500 cases per week (uncorrected for any underreporting), with a peak of approximately 750 cases occurring in the week ending November 15, 2014. (Figure 1b).
Guinea: During December, 2014, weekly case counts have varied widely, from approximately 110 to 180 cases per week (Figure 1c).
Baseline projections to March 20, 2015 :
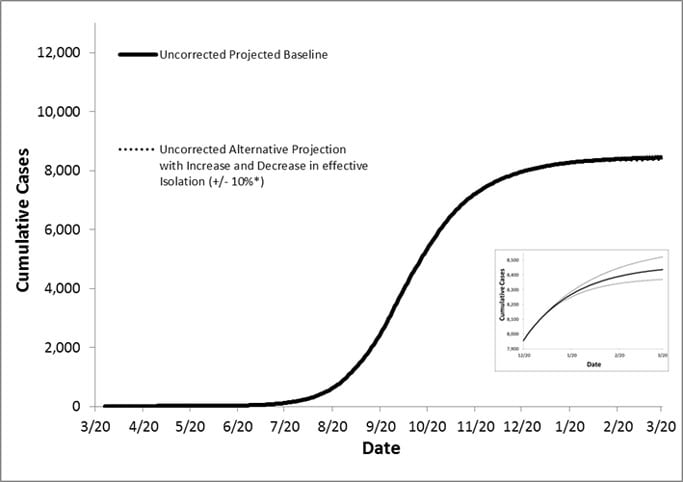
Liberia: It is estimated that by March 20, 2015, there will be from approximately 8,400 (lower bound of 8,400 to upper bound of 8,500) to 12,700 (12,600 –12,800) cumulative Ebola cases (upper estimate corrected for underreporting using a factor of 1.5) (Figure 2a). Weekly case counts for the week of March 15 – 21, 2015 are estimated to be approximately 8 (4 – 14) to 12 (6 – 21) per week. By using only laboratory-confirmed weekly case counts and assuming no further interventions or changes in human behavior, the baseline projection of confirmed cases for the week of March 15-21, 2015 will range from approximately 2 – 3 per week (upper estimate after adjusting for underreporting).
Sierra Leone: It is estimated that by March 20, 2015, there will be from approximately 15,700 (13,500 – 20,100) to 31,300 (27,100 – 40,100) cumulative Ebola cases (upper estimate corrected for underreporting using a factor of 2.0) (Figure 2b). Weekly case counts for the week of March 15 – 21, 2015 are estimated to be approximately 470 (140 – 1,600) to 950 (270 – 3,200) per week. By using only laboratory-confirmed weekly cases counts and assuming no further interventions or changes in human behavior, the baseline projection for the week of March 15 – 21, 2015, will range from approximately 400 – 800 (upper estimate after adjusting for underreporting).
Guinea: It is estimated that by March 20, 2015, there will be approximately 5,500 (4,600 – 7,200) to 11,100 (9,100 – 14,500) cumulative Ebola cases (upper estimate corrected for underreporting using a factor of 2.0) (Figure 2b). Weekly case counts for the week of March 15 – 21, 2015 are estimated to be approximately 380 (190 – 790) to 770 (380 – 1,600) per week. By using only using laboratory-confirmed weekly cases counts and assuming no further interventions or changes in human behavior, the baseline projection for the week of March 15 – 21, 2015 will range from approximately 340 – 680 cases per week (upper estimate after adjusting for underreporting).
Illustrating the reduction in Ebola cases attributed to potential increases in ETU beds over time: Adapted version of the EbolaResponse tool
An illustration of the potential effect of a schedule of an increase in available ETU beds is shown in Figure 3. The illustration shows that, initially, the number of available beds increases at a rate approximately equal to the growth in weekly case counts. However, at approximately two-thirds into the time period studied, the percentage of cases with Ebola in the ever increasing ETU beds is such that the growth in weekly cases stops and the epidemic begins to decline and eventually almost stops within the time period studied.
Additional results, showing a similar figure for CCC beds and results for both ETU and CCC beds by using reported cases corrected for underreporting, are available in the accompanying copy of the adapted version of EbolaResponse.
Limitations
As previously reported (1), the findings in this report are subject to at least four limitations. First, extrapolating current trends in increase of cases to forecast all future cases may not be appropriate. Underlying factors, such as behavioral changes in contacts with ill persons or burial practices or substantial changes in movement of cases with Ebola within countries or across borders, could alter future transmission patterns. Second, the correction factors used to adjust for underreporting could change substantially over time. Third, notable regional differences in underreporting might mean that using one correction factor across an entire country may not be appropriate. In addition, no consideration was made of the increased resources and logistics that would be needed for the alternative low projections to occur.
Acknowledgements
We acknowledge Deputy Minister Tolbert Nyenswah and the Liberian Ministry of Health and Social Welfare, the Sierra Leonean Ministry of Health and Sanitation, and the Guinean Ministry of Health for their the invaluable assistance.
REFERENCES
1. Meltzer MI, Atkins CY, Santibanez S, Knust B, Petersen BW, Ervin ED, Nichol ST, Damon IK, Washington ML. Estimating the future number of cases in the Ebola epidemic — Liberia and Sierra Leone, 2014—2015. MMWR Surveill Summ 2014;63:1-14.
2. World Health Organization. Situation reports: Ebola response roadmap. http://www.who.int/csr/disease/ebola/situation-reports/en/external icon Accessed October 18, 2014.
3. Incident Management System Ebola Epidemiology Team, CDC; Guinea Interministerial Committee for Response Against the Ebola Virus; CDC Guinea Response Team; Liberia Ministry of Health and Social Welfare; CDC Liberia Response Team; Sierra Leone Ministry of Health and Sanitation; CDC Sierra Leone Response Team; Viral Special Pathogens Branch, National Center for Emerging and Zoonotic Infectious Diseases, CDC.Update: Ebola virus disease outbreak — West Africa, October 2014. MMWR Morb Mortal Wkly Rep 2014;63:978-981.
4. Szabo L. New Ebola cases in Liberia appear to be slowing. USA Today. Available at: http://www.usatoday.com/story/news/nation/2014/10/29/who-ebola-meeting/18107705/external icon Accessed on 11/01/2014.
5. Nyenswah TG, Westercamp M, Kamali AA, Qin J, Zielinski-Gutierrez E, Amegashie F, Fallah M, Gergonne B, Nugba-Ballah R, Singh G, Aberle-Grasse JM, Havers F, Montgomery JM, Bawo L, Wang SA, Rosenberg R. Evidence for Declining Numbers of Ebola cases: Montserrado County, Liberia, June–October 2014. MMWR Morb Mortal Wkly Rep 2014; 63:1072-6.
6. Nyenswah T, Fahnbulleh M, Massaquoi M, Nagbe T, Bawo L, Falla JD, Kohar H, Gasasira A, Nabeth P, Yett S, Gergonne B, Casey S, Espinosa B, McCoy A, Feldman H, Hensley L, Baily M, Fields B, Lo T, Lindblade K, Mott J, Boulanger L, Christie A, Wang S, Montgomery J, Mahoney F. Ebola epidemic: Liberia, March–October 2014. MMWR Morb Mortal Wkly Rep 2014;63:1082-6.
7. Sharma A, Heijenberg N, Peter C, Bolongei J, Reeder B, Alpha T, Sterk E, Robert H, Kurth A, Cannas A, Bocquin A, Strecker T, Logue C, Caro AD, Pottage T, Yue C, Stoecker K, Wölfel R, Gabriel M, Günther S, Damon I. Evidence for a decrease in transmission of Ebola virus – Lofa county, Liberia, June 8-November 1, 2014. MMWR Morb Mortal Wkly Rep; 2014;63:1067-71.
8. World Health Organization. Ebola response roadmap – Situation report. http://www.who.int/csr/disease/ebola/situation-reports/en/external icon. Access on December 14, 2104.
[1] A 7-day average was calculated to smooth out the large-day-to-day variations of reported cases.
Figure 1: Fit of Model depicting cumulative reported cases and weekly case incidence for Liberia, Sierra Leone, and Guinea
1a: Liberia
1b: Sierra Leone
1c: Guinea#
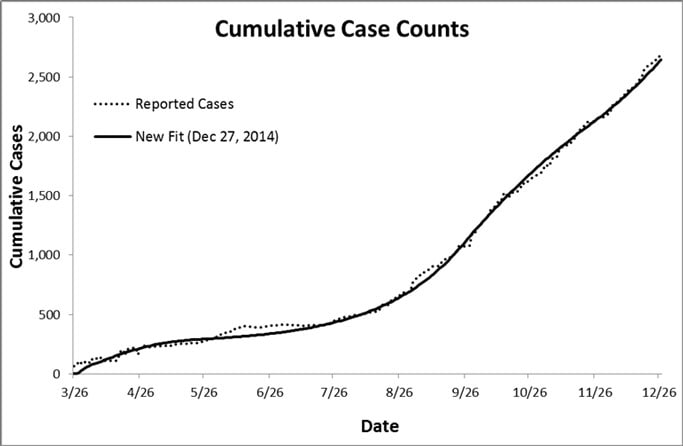
* Original fits of the model were done using data to August 8, 2014. The refitted models used data through to December 27, 2014 for all three countries.
# Cumulative cases in Guinea were not included in the September 26, 2014 MMWR.
Figure 2: Extrapolations cumulative data and weekly case incidence: uncorrected and corrected data for Sierra Leone, Liberia, and Guinea
2a: Liberia – estimates of future cumulative cases and weekly case counts, using different scenarios and uncorrected and corrected data‡*
2ai: Liberia: Cumulative, uncorrected
2aii: Liberia: Cumulative, corrected**
2aiii: Liberia: Weekly, uncorrected
2aiv: Liberia: Weekly, corrected**
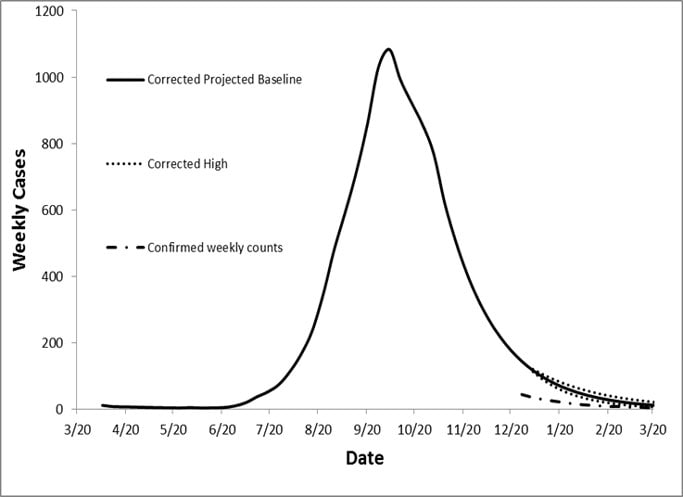
‡ Future estimates of cumulative cases for Liberia, uncorrected and corrected, were based on data up to December 27, 2014. The scenarios used to estimate future cases were: i) projected baseline; no additional interventions and no further changes in human behavior after December 27, 2014; ii) Corrected alternative projections; reduce (or increase) by 10% the percentage of cases without effective isolation and without safe burial; iii) baseline projections of future weekly case counts using only confirmed cases.
* Graph inserts: Because of the relatively small differences between the projected baseline and the alternative projections (+/- 10%), the graphs for the Liberian data contain inserts that focus on the period 12/20, 2014 to 02/20, 2015. These inserts allow a reader to more clearly see the differences between the plots of the different projections.
** Corrected for underreporting using a factor of 1.5.
2b: Sierra Leone – estimates of future cumulative cases and weekly case counts, using different scenarios and uncorrected and corrected data‡**
2bi: Sierra leone: Cumulative, uncorrected
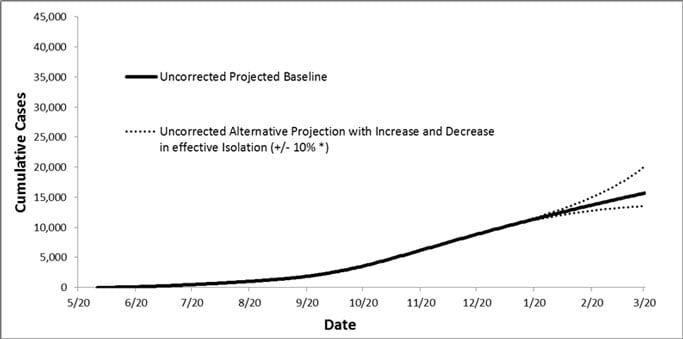
2bii: Sierra Leone: Cumulative, corrected**
2biii: Sierra Leone: Weekly, uncorrected
2biv: Sierra Leone: Weekly, corrected**
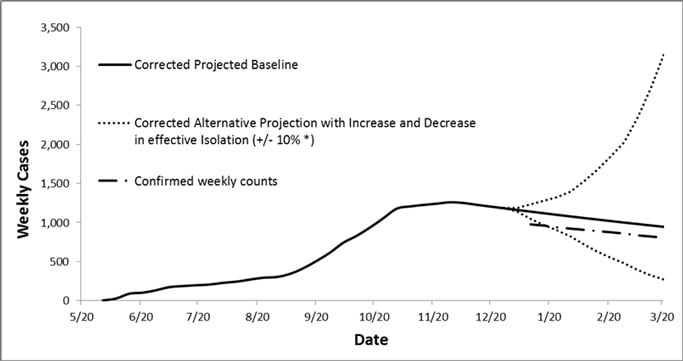
‡ Future cumulative estimates for Sierra Leone, uncorrected and corrected, were based on data up to December 27, 2014. The scenarios used to estimate future cases were: i) projected baseline; no additional interventions and no further changes in human behavior after December 27, 2014; ii) Corrected alternative projection; reduce (or increase) by 10% the percentage of cases without effective isolation and without safe burial; iii) baseline projections of future weekly case counts using only confirmed cases;
** Corrected for underreporting using a factor of 2.0.
2c: Guinea – estimates of future cumulative cases and weekly case counts, using different scenarios and uncorrected and corrected data‡***
2ci: Guinea: Cumulative, uncorrected
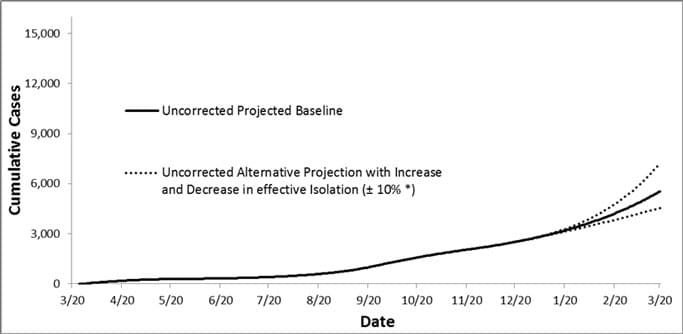
2cii: Guinea: Cumulative, corrected**
2ciii: Guinea: Weekly, uncorrected
2civ: Guinea: Weekly, corrected**
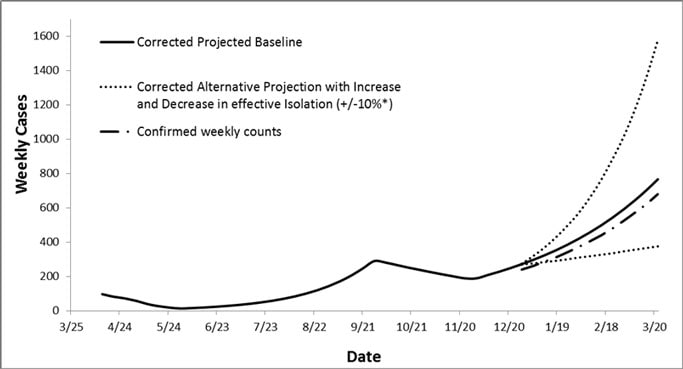
‡ Future cumulative estimates for Guinea, uncorrected and corrected, were based on data up to December 27, 2014. The scenarios used to estimate future cases were: i) projected baseline; no additional interventions and no further changes in human behavior after December 27, 2014; ii) Corrected alternative projection; reduce (or increase) by 10% the percentage of cases without effective isolation and without safe burial; iii) baseline projections of future weekly case counts using only confirmed cases;
** Corrected for underreporting using a factor of 2.0.
Figure 3: Illustrating the reduction in Ebola cases due to potential increases in Ebola Treatment Unit (ETU) beds over time

Note: The illustration shows that, initially, the number of available beds increases at a rate approximately equal to the growth in weekly case counts. However, at approximately two-thirds into the time period studied, the percentage of cases with Ebola in the ever increasing ETU beds is such that the growth in weekly cases stops and the epidemic begins to decline and eventually almost stops within the time period studied

