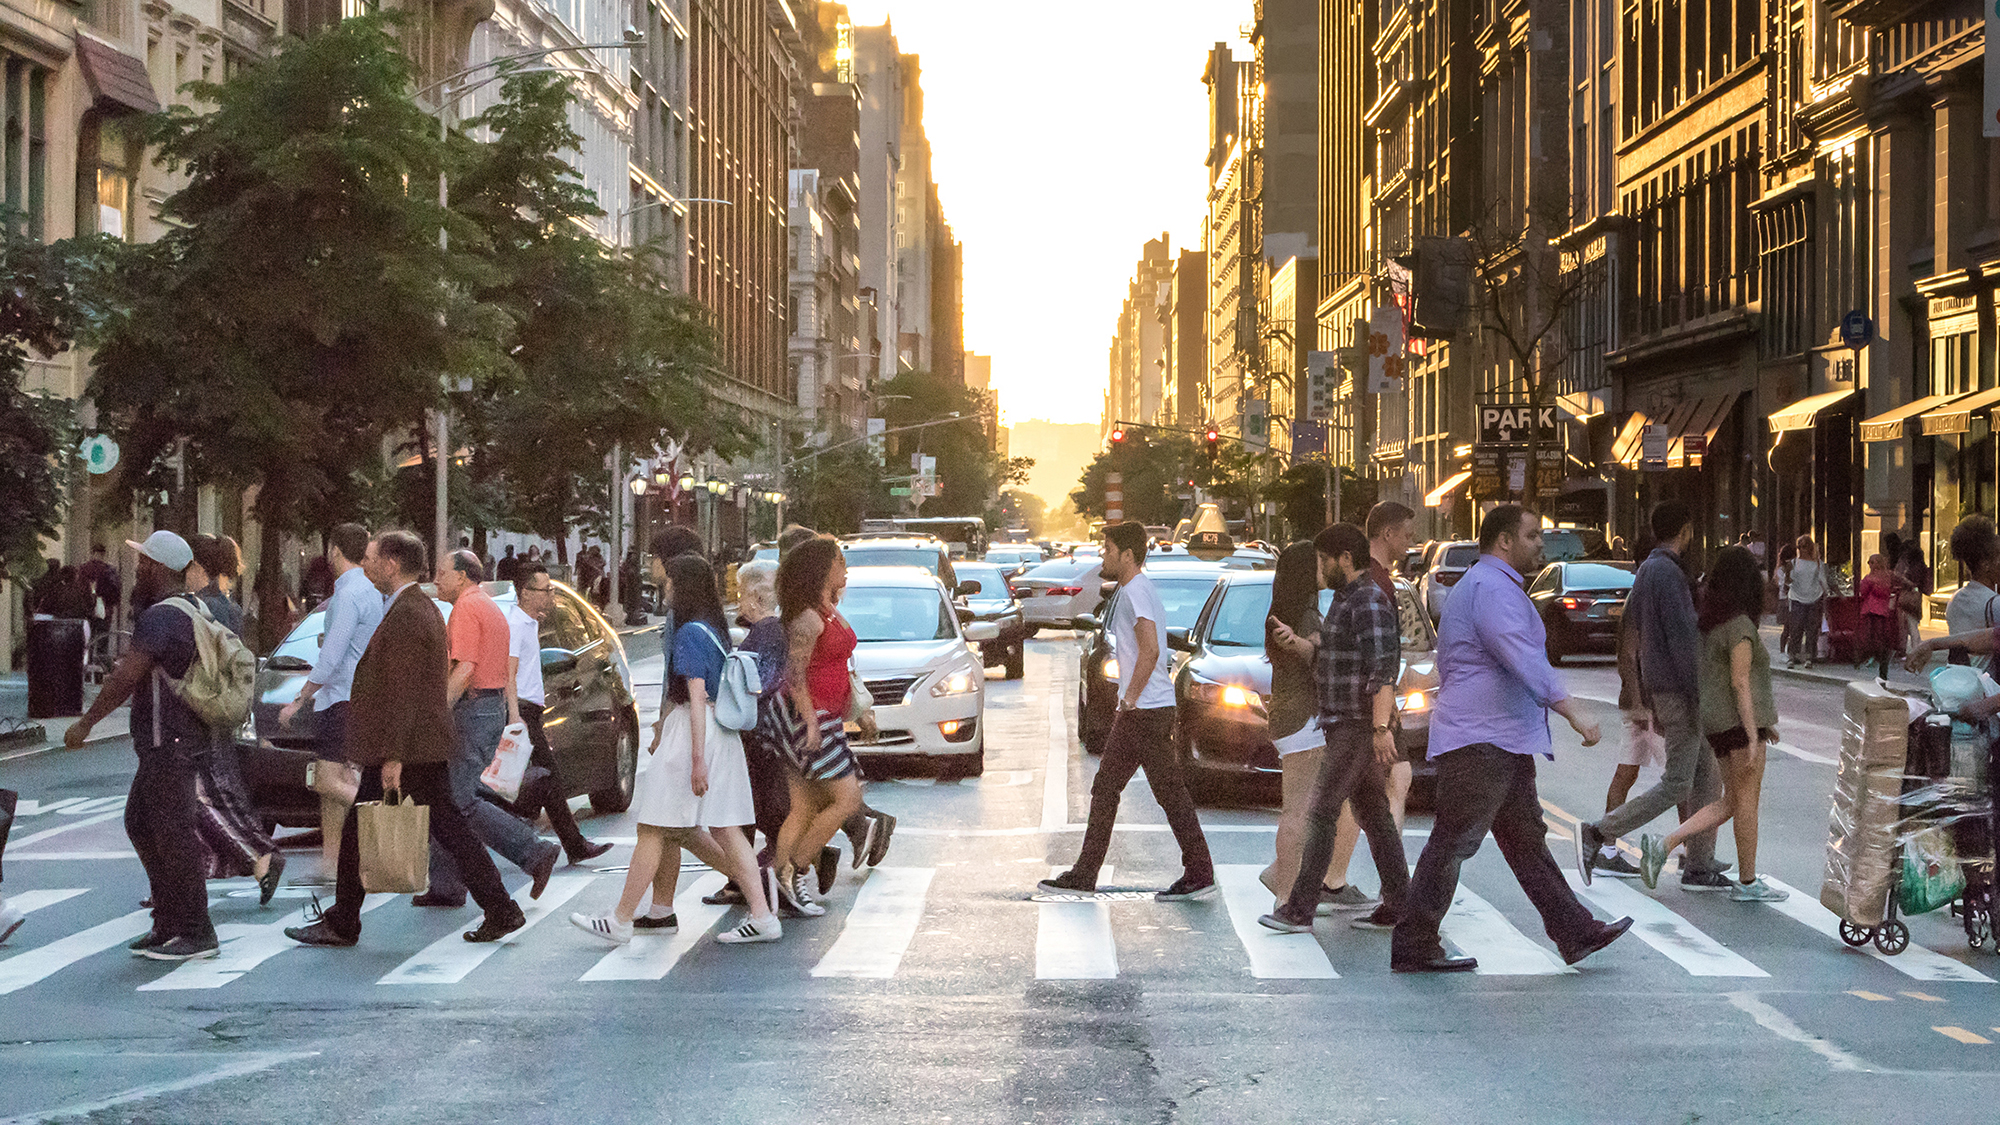
Key points
- Thousands of pedestrians are killed every year on our nation's roads.
- Speed, location, vehicle size, and alcohol are major risk factors.
- Pedestrian injuries and deaths are preventable.
Facts
- Over 8,000 pedestrians were killed on our nation's roads in crashes involving a motor vehicle in 2022. That's about one death every 64 minutes.1
- There were also an estimated 140,000 emergency department visits of pedestrians treated for non-fatal crash-related injuries in 2022.1
- One in five people who died in crashes in 2022 were pedestrians.1
Pedestrian fatal injury trends chart
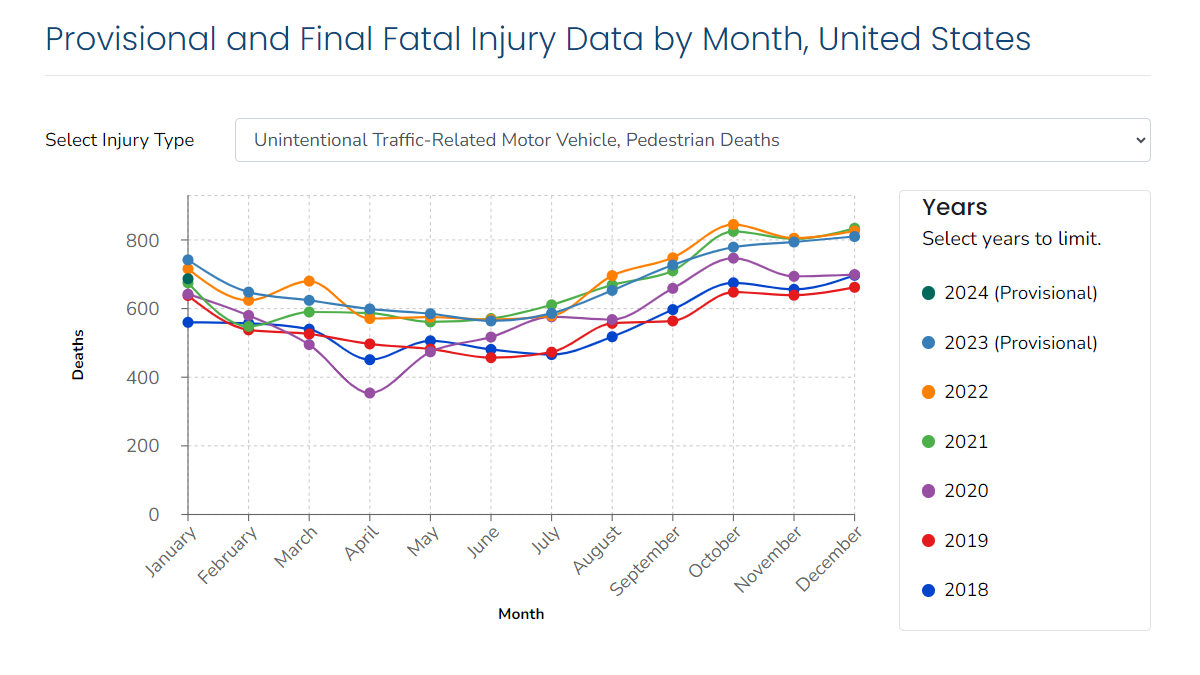
Timely data can help prevention efforts. This chart shows the number of pedestrian deaths by month and year, including the most recent provisional data available. You can access the full interactive chart by the link below.
Risk factors
Speed, location, vehicle size, and alcohol are major risk factors.
- Higher vehicle speeds increase both the likelihood of a pedestrian being struck by a car and the injury severity.23
- Most pedestrian deaths (60% in 2021) occur on high-capacity urban roads that typically have posted speed limits of 45-55 miles per hour.4
- Many of these roads suffer from a design conflict between providing destinations (e.g., stores, restaurants) that people need to access and allowing high travel speeds that often prioritize vehicle movement.
- For example, among 60 roads that had the most pedestrian deaths during 2001-2016, all were roads with adjacent commercial retail space, nearly all were multilane roads, and more than three-quarters had speed limits of 30 miles per hour or higher.5
- SUVs can cause more harm to a person on foot when a crash occurs because of the vehicle's greater body weight and larger profile.6
- Alcohol was involved for the driver and/or pedestrian in nearly half (48%) of crashes that resulted in a pedestrian death in 2022.7 In these crashes:
- About one out of six (18%) involved a driver with a blood alcohol concentration (BAC) of at least 0.08 grams per deciliter (g/dL)—a level that is illegal for adults aged 21 and older in all U.S. states.
- About one out of three (30%) involved a pedestrian with a BAC of at least 0.08 g/dL.7
People at increased risk
Some groups have higher risk for pedestrian death.
- Adults ages 65 years and older accounted for about 17% of the U.S. population in 2022. However, this group accounted for 22% of all pedestrian deaths in 2022.1
- Non-Hispanic American Indian and Alaska Native, and Black persons had the highest pedestrian death rates among all racial and ethnic groups in 2022.1
What can be done
Local and state public health partners, other transportation-related agencies, and communities can consider working together to keep pedestrians safe by:
- Using sources of public health data, like death certificates, hospital, and emergency department data, to gain a better understanding of pedestrian injury outcomes and prioritize interventions appropriately.
- Considering evidence-based strategies to reduce alcohol-impaired driving.89
- Partnering with agencies that prevent and treat substance misuse and use disorders to prioritize intervention placement and reduce impaired driving.
- Considering evidence-based strategies that promote driving at safe speeds.910
- Developing community-based coalitions that adopt the Safe System approach — a framework designed to protect everyone on the road.
- Prioritizing safety over speed and evidence-based design strategies10 like lane narrowing, better lighting, and sidewalk installation during road planning processes.
- Read more about the Safe System approach.
Additional resources
Examine counts, rates, and costs of pedestrian-related deaths and emergency department visits in the United States by year, state, and demographics
Examine other sources of pedestrian safety data
- National Highway Traffic Safety Administration Fatality and Injury Reporting System Tool
- Insurance Institute for Highway Safety
Learn how public health and safety organizations can collaboratively design and implement pedestrian safety programs in their communities
- National Highway Safety Administration (NHTSA): Pedestrian Safety
- World Health Organization: Pedestrian safety: a road safety manual for decision-makers and practitioners
- Federal Highway Administration: Pedestrian & Bicycle Safety
- Vision Zero Network: Guidance on taking a collaborative approach to improve transportation safety for pedestrians and all road users
Help support safely walking to school
Walk for improved health and environmental outcomes
- Centers for Disease Control and Prevention (CDC). WISQARS — Web-based Injury Statistics Query and Reporting System. U.S. Department of Health and Human Services, Centers for Disease Control and Prevention, National Center for Injury Prevention and Control; 2024.
- Rosen, E. & Sander, U. (2009) Pedestrian Fatality Risk as a Function of Car Impact Speed. Accident Analysis & Prevention, 41(3), 536-542.
- Tefft, B. (2013) Impact Speed and a Pedestrian's Risk of Severe Injury or Death. Accident Analysis & Prevention, 50, 871-878.
- Governors Highway Safety Association. Pedestrian Traffic Fatalities by State: 2022 [37 pages] Preliminary Data, page 17.
- Schneider, RJ. & Proulx, FR. (2021) United States Fatal Pedestrian Crash Hot Spot Locations and Characteristics. Journal of Transport and Land Use, 14(1), 1-23.
- Monfort, SS. & Mueller, BC. (2020) Pedestrian Injuries from Cars and SUVs: Updated Crash Outcomes from the Vulnerable Road User Injury Prevention Alliance. Traffic Injury Prevention, 21(sup 1), S165-S167.
- National Highway Traffic Safety Administration. Traffic Safety Facts 2022 Data: Pedestrians. U.S. Department of Transportation, Washington, DC; 2024.
- Guide to Community Preventive Services. CPSTF Findings for Motor Vehicle Injury: Reducing Alcohol-Impaired Driving. 2021.
- National Highway Traffic Safety Administration. Countermeasures that Work: A Highway Safety Countermeasure Guide for State Highway Safety Offices [498 pages]. 11th Edition. 2023.
- Federal Highway Administration. Noteworthy Local Policies that Support Safe and Complete Pedestrian and Bicycle Networks [107 pages]. U.S. Department of Transportation, Washington, DC; 2016.