Key points
- American Indian and Alaska Native people have the highest motor vehicle-related death rates of all racial and ethnic groups.
- Proven strategies to reduce motor vehicle injuries and deaths can be successfully tailored to tribal communities.

The facts
- Motor vehicle traffic crashes are a leading cause of death for American Indian and Alaska Native people.A1
- Motor vehicle traffic crash death rates among American Indian and Alaska Native children and youth ages 0–19 years were up to 8 times as high as those of other racial and ethnic groups.1
- Rates of motor vehicle traffic deaths among American Indian and Alaska Native adults ages 20 years or older were up to nearly 7 times as high as those of other racial and ethnic groups.1
Risk factors
People at increased risk include children and men.1
Behaviors that increase risk include low seat belt use,23 low car seat and booster seat use,4 and impaired driving.5
Keep Reading: Risk and Protective Factors for Tribal Road Safety
Prevention
Proven ways to prevent crash-related injuries and deaths include:
- several roadway engineering measures to slow speeds and create safer transportation infrastructure for all road users. Information on these proven interventions is available from the Federal Highway Administration.
- increasing car seat and booster seat use through child passenger restraint laws that require car seat and booster seat use for all children until at least age 9 years,6789101112
- increasing seat belt use through primary enforcement seat belt laws that cover all seating positions,1314 and
- high visibility enforcement.1315
These strategies can be successfully tailored to tribal communities.
Keep Reading: Reducing Risk for Tribal Communities
Best Practices Guide
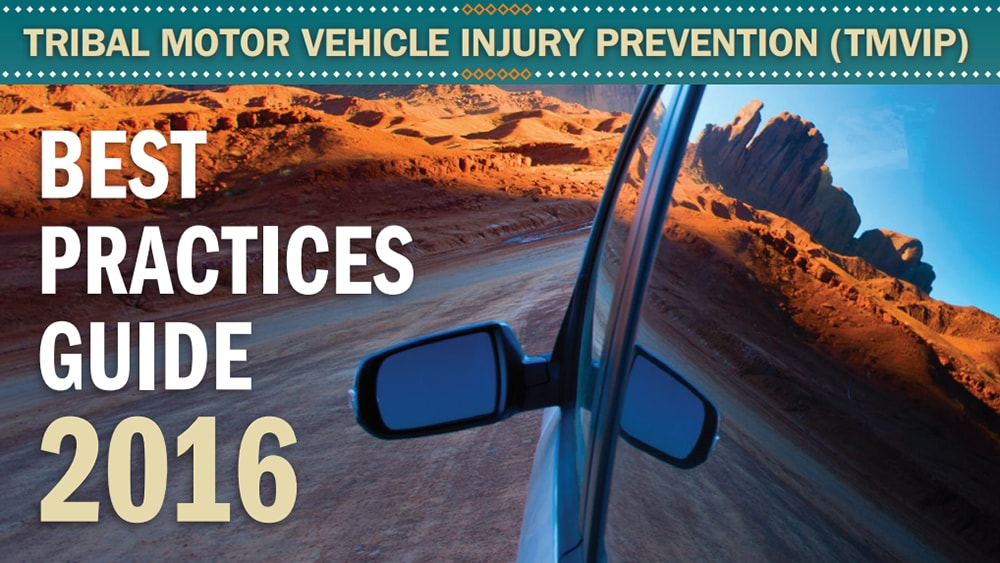
The Tribal Motor Vehicle Injury Prevention (TMVIP) Best Practices Guide provides recommended strategies and examples from Indian Country to increase seat belt use, increase child safety seat use, and reduce alcohol-impaired driving. The Guide also outlines five important components for TMVIP.
Tribal road safety fact sheets
Check out CDC's Tribal Road Safety Fact Sheets and share the materials to help reduce crash-related injuries and deaths among members of Tribal Nations.
Program Evaluation Guide
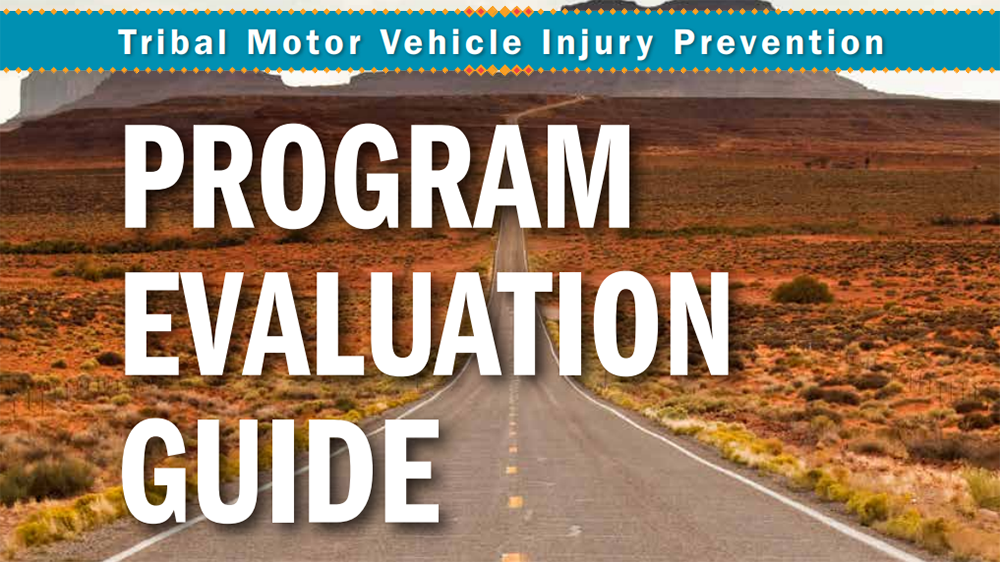
The Tribal Motor Vehicle Injury Prevention Program Evaluation Guide was developed to share best practices for evaluating Tribal Motor Vehicle Injury Prevention (also called Tribal Traffic Safety) Programs. This guide aims to assist Tribes and Tribal Organizations that are implementing these proven strategies with key methods for evaluating their programs. Specific examples are provided throughout the guide that pertain directly to Tribal Traffic Safety Programs.
- On this webpage, statistics are reported for non-overlapping racial and ethnic groups. All people of Hispanic origin are grouped together, so, for example, statistics for American Indian and Alaska Native people and White people are for non-Hispanic persons.
- Centers for Disease Control and Prevention (CDC). WISQARS — Web-based Injury Statistics Query and Reporting System, 2018–2021 data. Atlanta, GA: U.S. Department of Health and Human Services, Centers for Disease Control and Prevention, National Center for Injury Prevention and Control; 2023.
- National Highway Traffic Safety Administration. Native American Traffic Safety Facts FARS 2016–2020. Washington, DC: U.S. Department of Transportation, National Highway Traffic Safety Administration, National Center for Statistics and Analysis.
- National Center for Statistics and Analysis. Summary of motor vehicle crashes: 2020 data (Traffic Safety Facts. Report No. DOT HS 813 369). Washington, DC: U.S. Department of Transportation, National Highway Traffic Safety Administration, National Center for Statistics and Analysis; 2022.
- National Highway Traffic Safety Administration (NHTSA). Fatality Analysis Reporting System (FARS), 2016–2020 data. Washington, DC: U.S. Department of Transportation, National Highway Traffic Safety Administration, National Center for Statistics and Analysis; November 2023.
- National Highway Traffic Safety Administration (NHTSA). Unpublished 2016–2020 data from the Fatality Analysis Reporting System (FARS). Washington, DC: U.S. Department of Transportation, National Highway Traffic Safety Administration, National Center for Statistics and Analysis; August 2023
- Shaw KM, West B, Kendi S, Zonfrillo MR, Sauber-Schatz E. Urban and rural child deaths from motor vehicle crashes: United States, 2015–2019. J Pediatr. 2022;250:93–99. doi:10.1016/j.jpeds.2022.07.001
- Benedetti M, Klinich KD, Manary MA, Flannagan CA. Predictors of restraint use among child occupants. Traffic Inj Prev. 2017;18(8):866–869. doi:10.1080/15389588.2017.1318209
- West BA, Dorigo LL, Mattick KA, Yellman MA, Sauber-Schatz EK. Booster Seat Planning Guide. U.S. Department of Health and Human Services, Centers for Disease Control and Prevention, National Center for Injury Prevention and Control; 2021.
- Farmer P, Howard A, Rothman L, Macpherson A. Booster seat laws and child fatalities: a case-control study. Inj Prev. 2009;15(5):348–350. doi:10.1136/ip.2008.021204
- Brixey SN, Corden TE, Guse CE, Layde PM. Booster seat legislation: does it work for all children?. Inj Prev. 2011;17(4):233–237. doi:10.1136/ip.2010.029835
- Mannix R, Fleegler E, Meehan WP III, Schutzman SA, Hennelly K, Nigrovic L, Lee LK. Booster seat laws and fatalities in children 4 to 7 years of age. Pediatrics. 2012;130(6):996–1002. doi:10.1542/peds.2012-1058
- Eichelberger AH, Chouinard AO, Jermakian JS. Effects of booster seat laws on injury risk among children in crashes. Traffic Inj Prev. 2012;13(6):631–639. doi:10.1080/15389588.2012.660663
- Venkatraman V, Richard CM, Magee K, Johnson K. Countermeasures That Work: A Highway Safety Countermeasures Guide for State Highway Safety Offices, 10th Edition, 2020 (Report No. DOT HS 813 097) [PDF – 641 pages]. Washington, DC: U.S. Department of Transportation, National Highway Traffic Safety Administration; 2021.
- Dinh-Zarr TB, Sleet DA, Shults RA, et al. Reviews of evidence regarding interventions to increase the use of safety belts. Am J Prev Med. 2001; 21(4 Suppl):48–65. doi:10.1016/s0749-3797(01)00378-6.
- Zaza S, Sleet DA, Thompson RS, Sosin DM, Bolen JC; Task Force on Community Preventive Services. Reviews of evidence regarding interventions to increase use of child safety seats. Am J Prev Med. 2001;21(4 Suppl):31–47. doi:10.1016/s0749-3797(01)00377-4