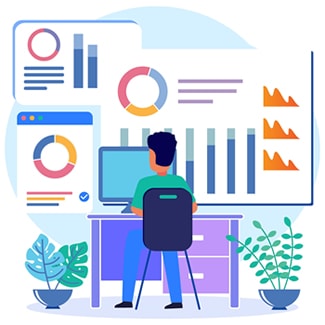
NNDSS Dashboards Monitor Data Quality
- NNDSS has developed interactive dashboards that monitor data quality, data transmission, and case counts, rates, and trends for most nationally notifiable diseases and conditions at the same time.
- Previously, NNDSS lacked visualization tools to help health departments and CDC programs improve data quality and monitor case trends across diseases.
- The dashboards aim to help decision makers visualize surveillance data and address health disparities.
- These innovative tools will help the NNDSS team, CDC programs and health departments identify and resolve problems quickly and ensure that the data CDC publishes for jurisdictions are accurate.
Full Story
The National Notifiable Diseases Surveillance System (NNDSS) team has developed innovative tools to help public health professionals visualize surveillance data for public health decision-making. They are changing the process for ensuring accurate and complete data for public health action by developing 13 interactive reports and dashboards that monitor data quality and case counts for more than 90 nationally notifiable diseases and conditions at the same time.
Public Health Problem
Through NNDSS, CDC receives data on cases—or people who have been diagnosed with a disease—for more than 120 nationally notifiable diseases from 60 state, local, and territorial jurisdiction health departments. Although each CDC disease program monitors data quality and case count for its specific diseases of interest, NNDSS lacked a comprehensive data quality monitoring process to help health departments improve their data collection and quality across diseases. Additionally, NNDSS needed a robust way to visualize case counts, rates, and trends to help health departments and CDC programs monitor across NNDSS conditions without needing to write programming code.
Action
To meet this pressing need, the Office of Public Health Data, Surveillance, and Technology (OPHDST) developed 13 interactive reports and dashboards. These include:
- Data element completeness dashboards to help state, local, and territorial health departments improve their data collection and data quality.
- Data volume dashboards to monitor changes in data reporting, data transmission, and internal CDC processing that could impact data transmission.
- Analytical dashboards to show case counts and trends to help CDC disease-specific programs and health departments understand the spread of disease to inform public health action.
During the COVID-19 pandemic and other recent outbreaks, these tools helped NNDSS and CDC programs analyze the completeness of generic data elements, which are data elements that apply to all diseases, and disease-specific data elements. These tools allowed CDC to analyze data element completeness over time, by jurisdiction, and by data source. Dashboards summarized changes in daily and weekly case volume by jurisdiction, disease, CDC program, and time.
Other useful information available in these tools included the most recent change in case volume for a jurisdiction and disease category, whether there were cases reported for a certain period, and when the earliest and most recent cases were sent to CDC.
OPHDST also created interactive dashboards for COVID-19, mpox, and >90 other diseases showing case counts and rates over time filtered by demographics, by geographic area, and by other filters such as case classification.
Impact
The team’s efforts advance the Public Health Data Strategy’s goal of accelerating access to analytic and automated solutions to support public health investigations and advance health equity. Besides helping public health practitioners visualize surveillance data and share insights to inform public health action, the dashboards also aim to help public health decision-makers make better use of data to address health disparities. Monitoring data element completeness for health equity-related data elements is a high priority for surveillance.
DC has developed new tools to help analysts review NNDSS data element completeness, validity, case volume change, and case trends for more than 90 diseases without needing to write programming code. The dashboards update daily and monthly. The NNDSS team, CDC programs and health departments can access the dashboards at any time. Jurisdiction users will be able to see data for their jurisdiction based on their assigned permissions. These tools reduce the time needed to recognize when data transmissions are dropped or if there is a problem with data processing from 1–3 days to less than 1 hour. This improved process allows CDC to identify and resolve a problem more quickly and ensure that the data CDC publishes for jurisdictions are accurate.
After presenting some of the dashboards to CDC programs in 2022, CDC’s Division of Global Migration and Quarantine (DGMQ) began using the dashboards to monitor and evaluate binational cases for selected NNDSS diseases. Additionally, OPHDST has developed three-page Power BI visualizations to focus on questions regarding binational cases.
- Strengthens the core of public health data
- Accelerates access to analytic and automated solutions
- Visualizes and shares data insights
- Advances open and interoperable data
The NNDSS team is now working with CDC programs to share two of these dashboards with health departments in 57 jurisdictions. CDC will share these dashboards using the CDC Secure Access Management System (SAMS). This will allow health departments to monitor specific data element completeness metrics for their own jurisdictions, such as race and ethnicity over time and compare it to national data to identify successes and gaps. The analytical dashboard can allow case count comparisons between their own jurisdictions and the national data, which helps with situational awareness. The team has also developed user guides for these tools.
With these tools, jurisdictions and CDC staff will be able to identify areas of improvement and potential issues to correct. In fact, the findings from these data visualizations have already prompted corrections in at least 30 jurisdictions’ data and how CDC processes them.
Learn More
For more information, contact Michelle Lin at wft4@cdc.gov.