Emergency Department Visits for Influenza and Pneumonia: United States, 2016–2018
NCHS Data Brief No. 402, March 2021
PDF Versionpdf icon (568 KB) | Visual Abstract
- Key findings
- What were the ED visit rates for influenza and pneumonia in 2016–2018?
- Did the ED visit rate for influenza and pneumonia differ by age?
- Did the ED visit rate for influenza and pneumonia differ by race and ethnicity?
- Did the ED visit rate for influenza and pneumonia differ by primary expected source of payment?
- Summary
Data from the National Hospital Ambulatory Medical Care Survey
- The emergency department (ED) visit rate per 1,000 persons was 7.9 for patients with pneumonia, 4.4 for patients with influenza, and 12.2 for patients with either or both.
- The ED visit rate for patients with influenza and pneumonia was higher among younger children than older children and increased with age among adults.
- The ED visit rate for patients with influenza and pneumonia was highest among non-Hispanic black persons compared with persons from other race and ethnicity groups.
- The ED visit rate for patients with influenza and pneumonia was higher for persons with Medicare (19.9 per 1,000 persons with Medicare) or Medicaid (26.2 per 1,000 persons with Medicaid) compared with persons with private insurance or uninsured persons.
In the United States, there were an estimated 810,000 hospitalizations attributable to influenza during 2017–2018 (1). Pneumonia is the most common respiratory complication of influenza (2). In 2019, the ninth leading cause of death was influenza and pneumonia and the death rate was 15.2 per 100,000 persons, ranging from 4.1 for infants aged under 1 year to 294.7 for adults aged 85 and over (3,4). This report describes emergency department (ED) visit rates for patients with influenza and pneumonia (either influenza or pneumonia, or both) by selected patient characteristics.
Keywords: emergency care, National Hospital Ambulatory Medical Care Survey
What were the ED visit rates for influenza and pneumonia in 2016–2018?
- In 2016–2018, the ED visit rate for patients with pneumonia was 7.9 per 1,000 persons, which was higher than the ED visit rate for patients with influenza (4.4 per 1,000 persons) (Figure 1).
- The ED visit rate for patients with influenza and pneumonia was 12.2 per 1,000 persons.
Figure 1. Emergency department visit rates for patients with influenza and pneumonia: United States, 2016–2018
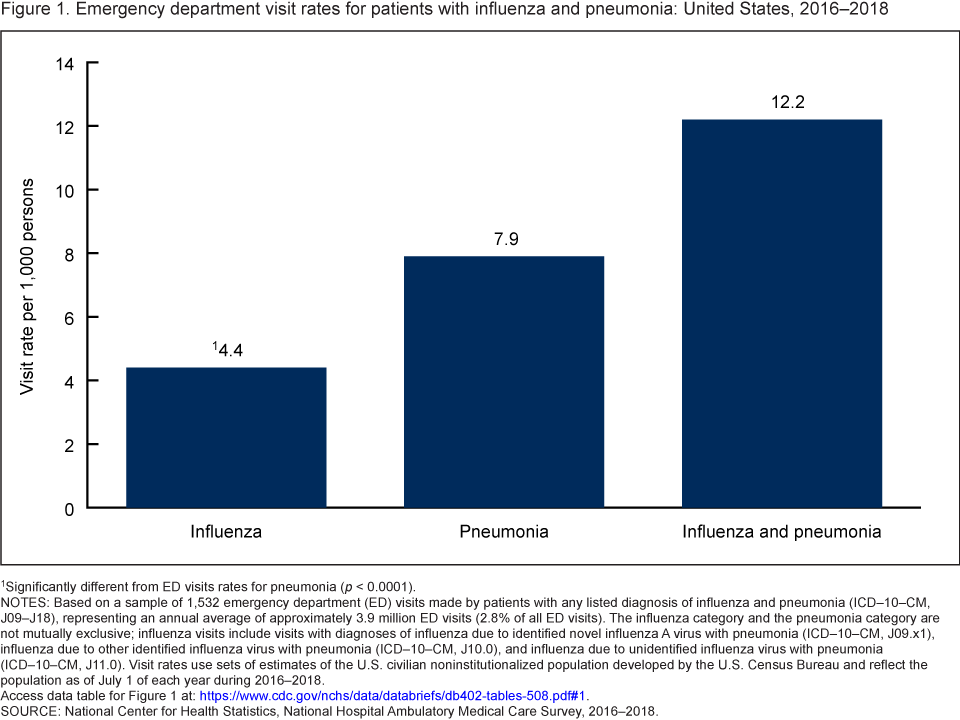 image icon
1Significantly different from ED visits rates for pneumonia (p < 0.0001).
NOTES: Based on a sample of 1,532 emergency department (ED) visits made by patients with any listed diagnosis of influenza and pneumonia (ICD–10–CM, J09–J18), representing an annual average of approximately 3.9 million ED visits (2.8% of all ED visits). The influenza category and the pneumonia category are not mutually exclusive; influenza visits include visits with diagnoses of influenza due to identified novel influenza A virus with pneumonia (ICD–10–CM, J09.x1), influenza due to other identified influenza virus with pneumonia (ICD–10–CM, J10.0), and influenza due to unidentified influenza virus with pneumonia (ICD–10–CM, J11.0). Visit rates use sets of estimates of the U.S. civilian noninstitutionalized population developed by the U.S. Census Bureau and reflect the population as of July 1 of each year during 2016–2018. Access data table for Figure 1pdf icon.
SOURCE: National Center for Health Statistics, National Hospital Ambulatory Medical Care Survey, 2016–2018.
Did the ED visit rate for influenza and pneumonia differ by age?
- During 2016–2018, the ED visit rate for patients with influenza and pneumonia varied by age. Among children aged 0–17 years, the ED visit rate decreased from 34.7 visits per 1,000 children under age 5 to 10.7 visits per 1,000 children aged 5–17. (Figure 2).
- Among adults, the ED visit rate for patients with influenza and pneumonia increased with age, ranging from 7.1 per 1,000 adults aged 18–44 to 45.6 per 1,000 adults aged 85 and over.
Figure 2. Emergency department visit rates for patients with influenza and pneumonia, by age group: United States, 2016–2018
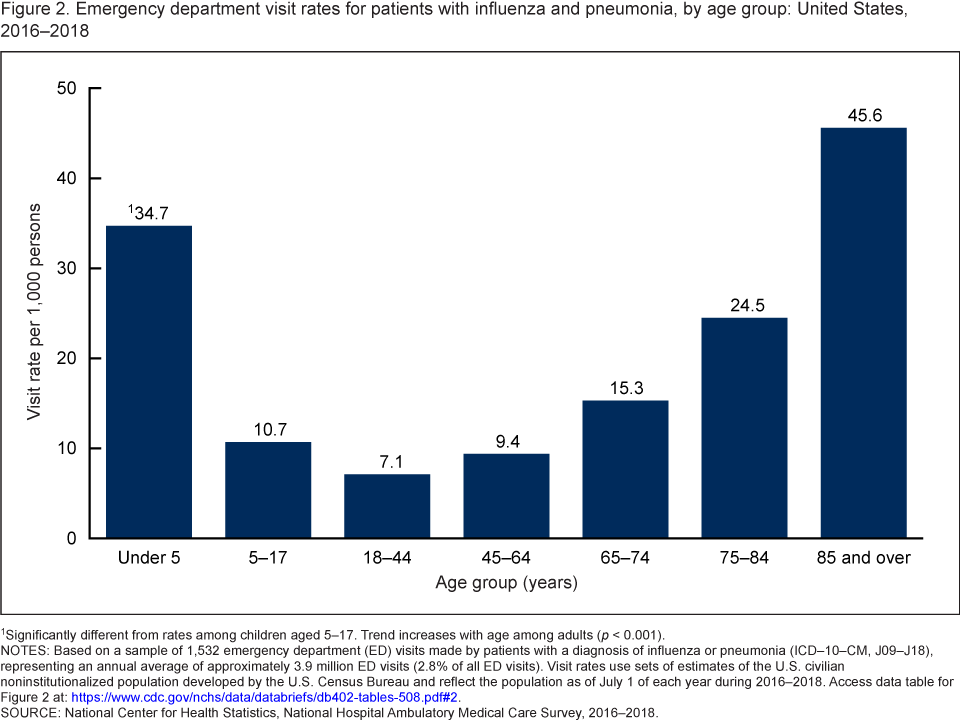 image icon
1Significantly different from rates among children aged 5–17. Trend increases with age among adults (p < 0.001).
NOTES: Based on a sample of 1,532 emergency department (ED) visits made by patients with any listed diagnosis of influenza and pneumonia (ICD–10–CM, J09–J18), representing an annual average of approximately 3.9 million ED visits (2.8% of all ED visits). Visit rates use sets of estimates of the U.S. civilian noninstitutionalized population developed by the U.S. Census Bureau and reflect the population as of July 1 of each year during 2016–2018. Access data table for Figure 2pdf icon.
SOURCE: National Center for Health Statistics, National Hospital Ambulatory Medical Care Survey, 2016–2018.
Did the ED visit rate for influenza and pneumonia differ by race and ethnicity?
- During 2016–2018, the ED visit rate for patients with influenza and pneumonia was highest among non-Hispanic black persons (21.9 per 1,000) compared with non-Hispanic white (11.8), non-Hispanic other (6.6), and Hispanic (9.8) persons (Figure 3).
- The ED visit rate for patients with influenza and pneumonia was higher among non-Hispanic white persons (11.8 per 1,000) compared with non-Hispanic persons of other races (6.6).
Figure 3. Emergency department visit rates for patients with influenza and pneumonia, by race and ethnicity: United States, 2016–2018
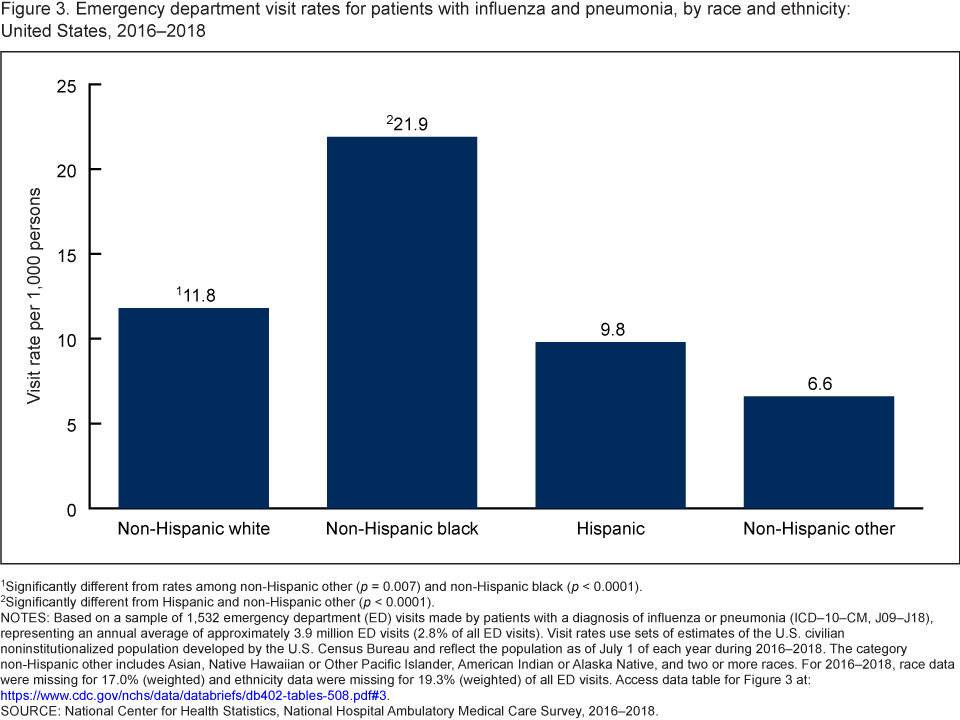 image icon
1Significantly different from rates among non-Hispanic other (p = 0.007) and non-Hispanic black (p < 0.0001).
2Significantly different from Hispanic and non-Hispanic other (p < 0.0001).
NOTES: Based on a sample of 1,532 emergency department (ED) visits made by patients with a diagnosis of influenza or pneu-monia (ICD–10–CM, J09–J18), representing an annual average of approximately 3.9 million ED visits (2.8% of all ED visits). Visit rates use sets of estimates of the U.S. civilian noninstitutionalized population developed by the U.S. Census Bureau and reflect the population as of July 1 of each year during 2016–2018. The category non-Hispanic other includes Asian, Native Hawaiian or Other Pacific Islander, American Indian or Alaska Native, and two or more races. For 2016–2018, race data were missing for 17.0% (weighted) and ethnicity data were missing for 19.3% (weighted) of all ED visits. Access data table for Figure 3pdf icon.
SOURCE: National Center for Health Statistics, National Hospital Ambulatory Medical Care Survey, 2016–2018.
Did the ED visit rate for influenza and pneumonia differ by primary expected source of payment?
- The ED visit rate for patients with influenza and pneumonia was higher for persons with Medicare or Medicaid as their primary expected source of payment (19.9 visits per 1,000 persons with Medicare and 26.2 visits per 1,000 persons with Medicaid) compared with persons with private insurance as their primary expected source of payment (5.0) or uninsured persons (7.0) (Figure 4).
- The observed difference in ED visit rates between Medicare and Medicaid as an expected source of payment was not significant.
Figure 4. Emergency department visit rates for patients with influenza and pneumonia, by primary expected source of payment: United States, 2016–2018
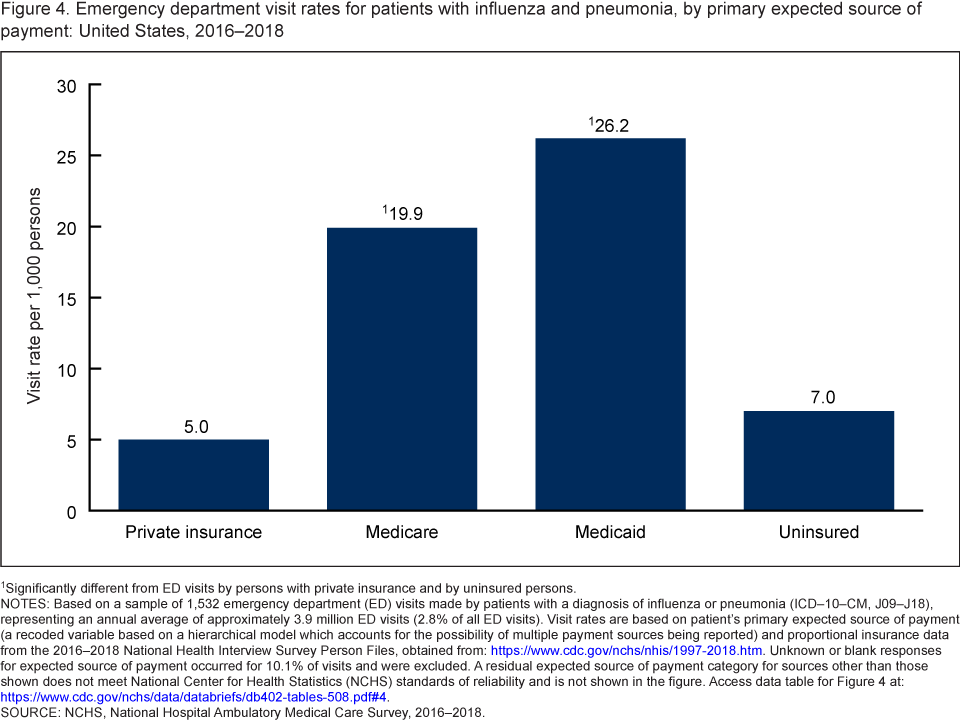 image icon
1Significantly different from ED visits by persons with private insurance and by uninsured persons.
NOTES: Based on a sample of 1,532 emergency department (ED) visits made by patients with any listed diagnosis of influenza and pneumonia (ICD–10–CM, J09–J18), representing an annual average of approximately 3.9 million ED visits (2.8% of all ED visits). Visit rates are based on patient’s primary expected source of payment (a recoded variable based on a hierarchical model which accounts for the possibility of multiple payment sources being reported) and proportional insurance data from the 2016–2018 National Health Interview Survey Person Files, obtained from: https://www.cdc.gov/nchs/nhis/1997-2018.htm. Unknown or blank responses for expected source of payment occurred for 10.1% of visits and were excluded. A residual expected source of payment category for sources other than those shown does not meet National Center for Health Statistics (NCHS) standards of reliability and is not shown in the figure. Access data table for Figure 4pdf icon.
SOURCE: NCHS, National Hospital Ambulatory Medical Care Survey, 2016–2018.
Summary
This report examined ED visit rates for influenza and pneumonia during 2016–2018. Differences by age, race and ethnicity, and primary expected source of payment were identified. The ED visit rate for patients with influenza and pneumonia was higher among children under age 5 compared with children aged 5–17 and increased with age among adults. Among adults, the rate was highest among those aged 85 and over. The ED visit rate was higher among non-Hispanic black persons than among other race and ethnicity groups. The ED visit rate for patients with influenza and pneumonia was highest for persons with Medicare or Medicaid compared with persons with private insurance or uninsured persons. With the recent spread of COVID-19, which has signs and symptoms that can mirror or appear similar to those resulting from influenza and pneumonia, monitoring ED visits for influenza and pneumonia will continue to be important.
Definitions
Influenza and pneumonia visit: A visit to the ED made by patients with either influenza or pneumonia or both influenza and pneumonia documented as any one of five diagnoses collected for that visit. Diagnoses are coded according to the International Classification of Diseases, 10th Revision, Clinical Modification (ICD–10–CM) coding system (influenza: ICD–10–CM, J09–J11, pneumonia: ICD–10–CM, J12–J18, and influenza and pneumonia: ICD–10–CM, J09–J18) (5). The influenza category and the pneumonia category are not mutually exclusive; influenza visits include visits with diagnoses of influenza due to identified novel influenza A virus with pneumonia (ICD–10–CM, J09.X1), influenza due to other identified influenza virus with pneumonia (ICD–10–CM, J10.0), and influenza due to unidentified influenza virus with pneumonia (ICD–10–CM, J11.0).
ED visit rate: Calculated by dividing the number of ED visits by persons with any diagnosis of influenza and pneumonia by the July 1, 2016; July 1, 2017; and July 1, 2018, estimates of the civilian noninstitutionalized population of the United States (obtained from the U.S. Census Bureau’s Population Division) for each demographic group, including age, sex, and race and ethnicity. Visit rates for primary source of payment are based on proportional insurance data from the 2016–2018 National Health Interview Survey Person Files, obtained from: https://www.cdc.gov/nchs/nhis/1997-2018.htm.
Primary expected source of payment: During data collection, all sources of payment were collected. For patients with more than one source of payment, sources were collapsed into one mutually exclusive variable (primary expected source of payment) based on the hierarchy below:
- Medicare: Partial or full payment by Medicare plan includes payments made directly to the hospital or reimbursed to the patient. Charges covered under a Medicare-sponsored prepaid plan are included.
- Medicaid: Partial or full payment by Medicaid plan includes payments made directly to the hospital or reimbursed to the patient. Charges covered under a Medicaid-sponsored prepaid plan (HMO) or “managed Medicaid” are included.
- Private: Partial or full payment by a private insurer (for example, BlueCross BlueShield), either directly to the hospital or reimbursed to the patient. Charges covered under a private insurance sponsored prepaid plan are included.
- Uninsured: Only self-pay, no charge, or charity as primary expected source of payment. Self-pay are charges that are paid by the patient or patient’s family, which will not be reimbursed by a third party. Self-pay includes visits for which the patient is expected to be ultimately responsible for most of the bill, even if the patient never actually pays it. This does not include copayments or deductibles. No charge or charity are visits for which no fee is charged (for example, charity, special research, or teaching).
Data source and methods
Data for this report are from the National Hospital Ambulatory Medical Care Survey (NHAMCS), an annual nationally representative survey of nonfederal, general, and short-stay hospitals. NHAMCS uses a multistage probability design with samples of geographic primary sampling units (PSUs), hospitals within PSUs, and patient visits within EDs. Additional information on the methodology of NHAMCS has been previously described (6,7). This report presents results combining data for 2016–2018 to enable more detailed subgroup analyses. Estimates of the weighted number of visits are based on 3-year annual averages. Data analyses were performed using the statistical packages SAS version 9.4 (SAS Institute, Cary, N.C.) and SAS-callable SUDAAN version 11.0 (RTI International, Research Triangle Park, N.C.). All percentage estimates presented meet National Center for Health Statistics (NCHS) guidelines for presentation of proportions (8) and follow NCHS trend analysis guidelines (9). Linear trends by age among adults were evaluated using linear regression. Differences between trends were evaluated using a two-sided significance test at the 0.05 level.
About the authors
Loredana Santo, Susan M. Schappert, and Jill J. Ashman are with the National Center for Health Statistics, Division of Health Care Statistics, Ambulatory and Hospital Care Statistics Branch.
References
- Centers for Disease Control and Prevention. Past seasons estimated influenza disease burden.
- Rothberg MB, Haessler SD. Complications of seasonal and pandemic influenza. Crit Care Med 38(4 suppl): e91–7. 2010. DOI: https://dx.doi.org/10.1097/CCM.0b013e3181c92eebexternal icon.
- Kochanek KD, Xu JQ, Arias E. Mortality in the United States, 2019. NCHS Data Brief, no 395. Hyattsville, MD: National Center for Health Statistics. 2020.
- Centers for Disease Control and Prevention, National Center for Health Statistics. CDC WONDER: About underlying cause of death, 1999–2019. 2020.
- Centers for Disease Control and Prevention, Centers for Medicare and Medicaid Services. International classification of diseases, 10th revision, clinical modification (ICD–10–CM). 2017.
- National Center for Health Statistics. 2016 NHAMCS micro-data file documentationpdf icon. 2018.
- National Center for Health Statistics. 2017 NHAMCS micro-data file documentationpdf icon. 2019.
- Parker JD, Talih M, Malec DJ, Beresovsky V, Carroll M, Gonzalez JF Jr, et al. National Center for Health Statistics data presentation standards for proportions. National Center for Health Statistics. Vital Health Stat 2(175). 2017.
- Ingram DD, Malec DJ, Makuc DM, Kruszon-Moran D, Gindi RM, Albert M, et al. National Center for Health Statistics guidelines for analysis of trends. National Center for Health Statistics. Vital Health Stat 2(179). 2018.
Suggested citation
Santo L, Schappert SM, Ashman JJ. Emergency department visits for influenza and pneumonia: United States, 2016–2018. NCHS Data Brief, no 402. Hyattsville, MD: National Center for Health Statistics. 2021. DOI: https://doi.org/10.15620/cdc:102795external icon.
Copyright information
All material appearing in this report is in the public domain and may be reproduced or copied without permission; citation as to source, however, is appreciated.
National Center for Health Statistics
Brian C. Moyer, Ph.D., Director
Amy M. Branum, Ph.D., Acting Associate Director for Science
Division of Health Care Statistics
Carol J. DeFrances, Ph.D., Acting Director
Alexander Strashny, Ph.D., Associate Director for Science