Attempts to Lose Weight Among Adolescents Aged 16–19 in the United States, 2013–2016
- Key findings
- What percentage of adolescents aged 16–19 tried to lose weight in 2013–2016?
- Were there differences in the percentage of adolescents aged 16–19 who tried to lose weight in the past year, by weight status, in 2013–2016?
- Were there differences in the percentage of adolescents aged 16–19 who tried to lose weight in the past year, by weight status, in 2013–2016?
- What ways to lose weight were reported by adolescents aged 16–19 who tried to lose weight in the past year in 2013–2016?
- Summary
- Definitions
- Data source and methods
- About the authors
- References
- Suggested citation
NCHS Data Brief No. 340, July 2019
PDF Versionpdf icon (481 KB)
Kendra B. McDow, M.D., M.P.H., Duong T. Nguyen, D.O., Kirsten A. Herrick, Ph.D., M.Sc., and Lara J. Akinbami, M.D.
Key findings
Data from the National Health and Nutrition Examination Survey
- In 2013–2016, 37.6% of adolescents aged 16–19 tried to lose weight in the past year. Weight loss attempts were higher among adolescent girls (45.2%) compared with adolescent boys (30.1%).
- A higher percentage of Hispanic adolescents (50.8%) tried to lose weight than non-Hispanic white (33.1%), non-Hispanic black (31.8%), and non-Hispanic Asian (28.4%) adolescents among both girls and boys.
- The percentage of adolescents who tried to lose weight increased with weight status category among both adolescent boys and girls.
- Among adolescents who tried to lose weight, the most commonly reported way was exercising (83.5%).
Approximately 24% of U.S. adolescents attempted to lose weight during 2009–2010, and studies show that girls are more likely than boys to attempt weight loss (1,2). Adolescents are known to use multiple weight loss and weight control practices (3). This report describes the percentage of U.S. adolescents who tried to lose weight in the past year from 2013 through 2016 by sex, race and Hispanic origin, and weight status. Methods of intentional weight loss are also reported.
Keywords: obesity, weight loss methods, National Health and Nutrition Examination Survey (NHANES)
What percentage of adolescents aged 16–19 tried to lose weight in 2013–2016?
- Overall, 37.6% of adolescents aged 16–19 reported trying to lose weight within the last 12 months (Figure 1).
- The percentage of adolescent girls (45.2%) who tried to lose weight was higher than adolescent boys (30.1%).
Figure 1. Percentage of adolescents aged 16–19 who tried to lose weight in the past year, by sex: United States, 2013–2016
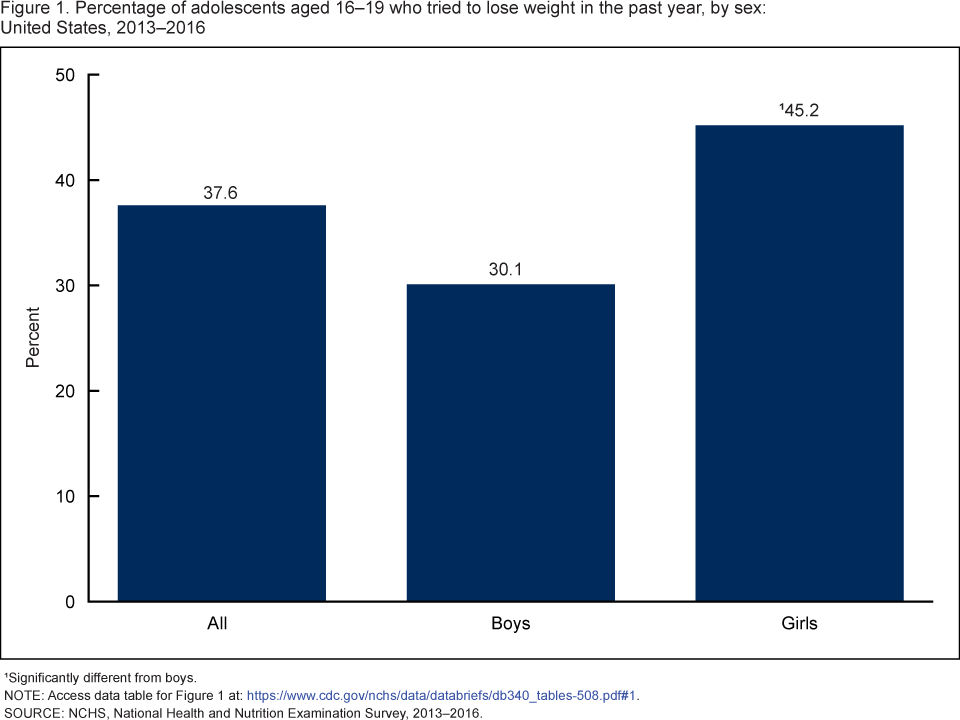
1Significantly different from boys.
NOTE: Access data table for Figure 1pdf icon.
SOURCE: NCHS, National Health and Nutrition Examination Survey, 2013–2016.
Were there differences in the percentage of adolescents aged 16–19 who
tried to lose weight in the past year, by weight status, in 2013–2016?
- Overall, the percentage of Hispanic adolescents who tried to lose weight (50.8%) was higher compared with non-Hispanic white (33.1%), non-Hispanic black (31.8%), and non-Hispanic Asian (28.4%) adolescents (Figure 2).
- The percentage of Hispanic adolescent boys who tried to lose weight (46.6%) was higher compared with non-Hispanic white (25.7%), non-Hispanic black (20.6%), and non-Hispanic Asian (18.7%) adolescent boys.
- A higher percentage of Hispanic adolescent girls tried to lose weight (54.8%) than non-Hispanic white (40.7%), non-Hispanic black (42.6%), and non-Hispanic Asian (41.3%) adolescent girls.
- Among non-Hispanic white, non-Hispanic black, and non-Hispanic Asian adolescents, a higher percentage of girls than boys tried to lose weight. The observed difference between Hispanic adolescent boys and girls was not significant.
Figure 2. Percentage of adolescents aged 16–19 who tried to lose weight in the past year, by sex and race and Hispanic origin: United States, 2013–2016
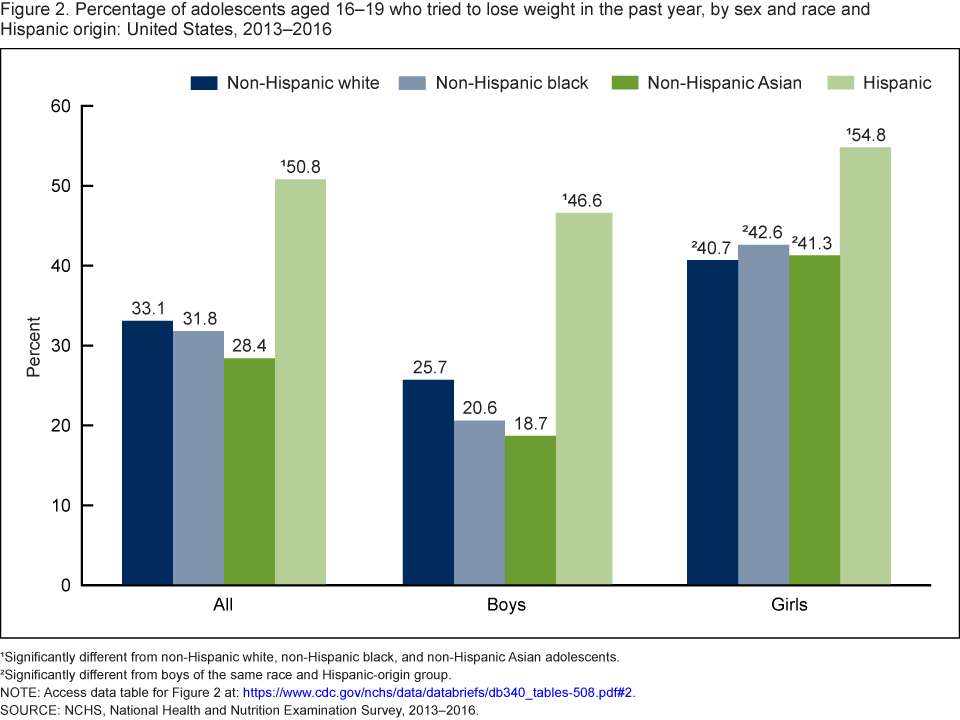
1Significantly different from non-Hispanic white, non-Hispanic black, and non-Hispanic Asian adolescents.
2Significantly different from boys of the same race and Hispanic-origin group.
NOTE: Access data table for Figure 2pdf icon.
SOURCE: NCHS, National Health and Nutrition Examination Survey, 2013–2016.
Were there differences in the percentage of adolescents aged 16–19 who tried to lose weight in the past year, by weight status, in 2013–2016?
- The percentage of adolescents who tried to lose weight increased with weight status category, overall and among boys and girls (Figure 3).
- Within the normal weight and overweight categories, a higher percentage of adolescent girls than boys tried to lose weight. There was no significant difference in the percentages of adolescent boys and girls with obesity who tried to lose weight.
Figure 3. Percentage of adolescents aged 16–19 who tried to lose weight in the past year, by sex and weight status: United States, 2013–2016
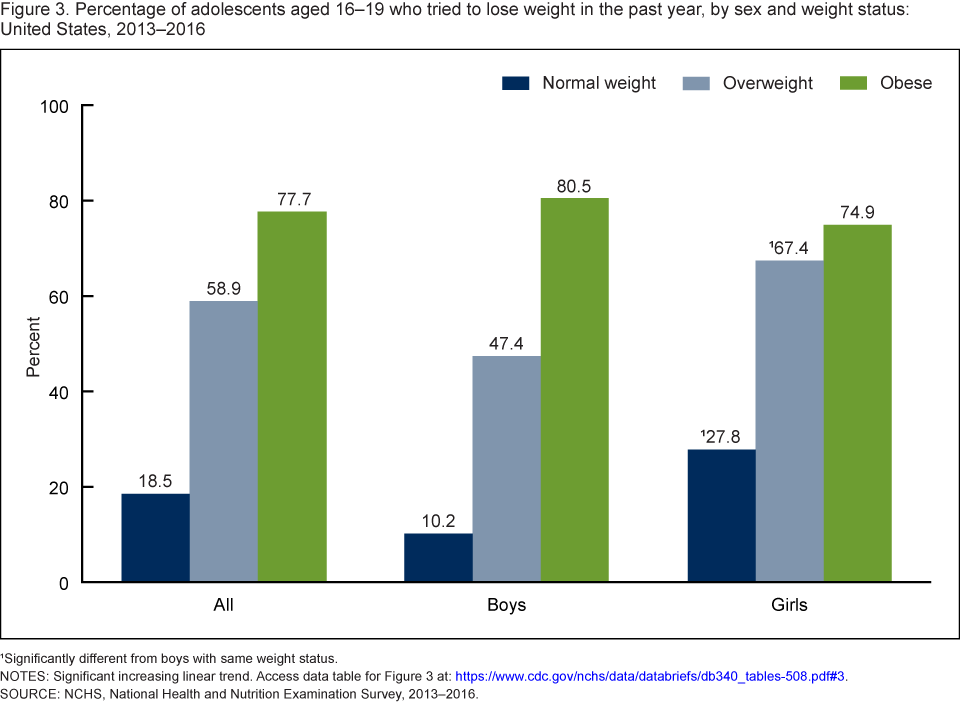
1Significantly different from boys with same weight status.
NOTES: Significant increasing linear trend. Access data table for Figure 3pdf icon.
SOURCE: NCHS, National Health and Nutrition Examination Survey, 2013–2016.
What ways to lose weight were reported by adolescents aged 16–19 who tried to lose weight in the past year in 2013–2016?
Among adolescents who tried to lose weight, the most commonly reported ways were exercising (83.5%); drinking a lot of water (52.3%); eating less (48.6%); eating less junk food or fast food (44.7%); and eating more fruits, vegetables, and salads (44.6%) (Figure 4).
Figure 4. Ways of trying to lose weight used by adolescents aged 16–19 who tried to lose weight in the past year: United States, 2013–2016
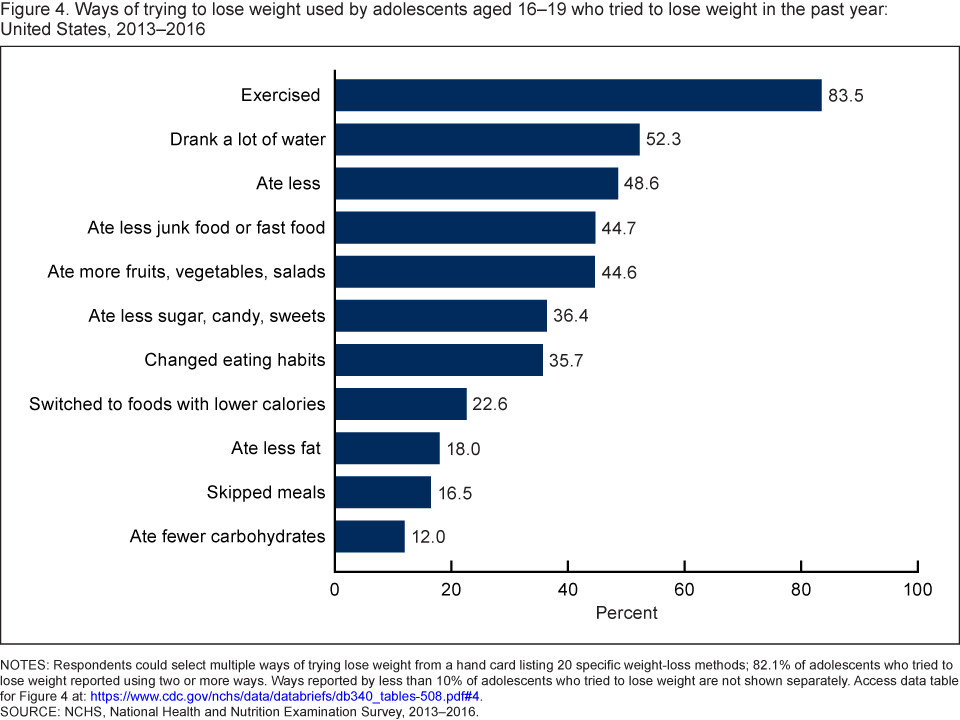
NOTES: Respondents could select multiple ways of trying lose weight from a hand card listing 20 specific weight-loss methods; 82.1% of adolescents who tried to lose weight reported using two or more ways. Ways reported by less than 10% of adolescents who tried to lose weight are not shown separately. Access data table for Figure 4pdf icon.
SOURCE: NCHS, National Health and Nutrition Examination Survey, 2013–2016.
Summary
In 2013–2016, 37.6% of adolescents aged 16–19 tried to lose weight within the past year, with almost one-half of adolescent girls and almost one-third of adolescent boys trying to lose weight. For both boys and girls, a higher percentage of Hispanic adolescents tried to lose weight compared with other race and Hispanic-origin groups.
The percentage of adolescents who tried to lose weight increased with weight status. For adolescents with obesity, 77.7% tried to lose weight. Improved health is a primary motivator among adolescents with obesity to attempt to lose weight (4), and 20.6% of adolescents aged 12–19 have obesity (5).
Among adolescents who tried to lose weight in the past year, the most commonly reported ways were exercising and drinking a lot of water. A majority of adolescents who tried to lose weight reported using two or more methods (82.1%).
Definitions
Tried to lose weight: This category is based on two questions. Participants whose self-reported current weight was at least 10 pounds lower than their reported weight a year ago were asked if that weight change was intentional; those who answered “yes” were categorized as having tried to lose weight. All other participants, including those who reported an unintentional weight loss of 10 pounds or more were asked directly, “During the past 12 months, have you tried to lose weight?”
Ways to lose weight: Participants who attempted weight loss in the past 12 months were asked, “How did you try to lose weight?” and were shown a hand card with 20 specific methods used to try to lose weight. Participants could select as many weight-loss methods as appropriate. Methods are not mutually exclusive. Specific methods include: ate less to lose weight; switched to foods with lower calories; ate less fat to lose weight; skipped meals; ate diet foods or products; used a liquid diet formula; joined a weight-loss program; took prescription diet pills; took nonprescription supplements to lose weight; took laxatives or vomited; drank a lot of water; followed a special diet; ate fewer carbohydrates; started to smoke or began to smoke again; ate more fruits, vegetables, and salads; changed eating habits; ate less sugar, candy, and sweets; ate less junk food or fast food; had weight-loss surgery; other.
Weight status: Body mass index (BMI) was calculated as weight in kilograms divided by height in meters squared, rounded to one decimal place. Weight status was based on the 2000 Centers for Disease Control and Prevention growth charts. Normal weight was defined as BMI at or above the age- and sex-specific 5th percentile and below the 85th percentile. Overweight was defined as BMI at or above the age- and sex-specific 85th percentile and below the 95th percentile. Obesity was defined as BMI at or above the age- and sex-specific 95th percentile (6).
Data source and methods
The National Health and Nutrition Examination Survey (NHANES) is a cross-sectional survey designed to monitor the health and nutritional status of the civilian noninstitutionalized U.S. population. The survey consists of in-home interviews and standardized physical examinations in mobile examination centers (MEC). Height and weight are measured at the MEC using a standard protocol. For this analysis, data from 2013–2014 and 2015–2016 cycles were combined to improve reliability of estimates.
The NHANES sample is selected through a complex, multistage probability design. In 2013– 2016, non-Hispanic black, non-Hispanic Asian, and Hispanic persons were oversampled to obtain reliable estimates. Specific race and Hispanic-origin estimates reflect individuals reporting only one race; those individuals with more than one race are included in the total but not reported separately. Pregnant females, individuals with BMI less than the age and sex-specific 5th percentile (underweight), and individuals with missing BMI were excluded from analyses.
Examination weights were used to account for differential probabilities of selection, nonresponse, and noncoverage. Taylor series linearization was used to compute variance estimates. Differences between groups were tested using a univariate t statistic. The significance level for statistical testing was set at p < 0.05. All reported differences are statistically significant unless otherwise indicated. Data management and statistical analyses were conducted using SAS System for Windows version 9.4 (SAS Institute, Inc., Cary, N.C.) and SUDAAN version 11.0 (RTI International, Research Triangle Park, N.C.).
About the authors
Kendra B. McDow is an Epidemic Intelligence Service Fellow assigned to the National Center for Health Statistics (NCHS), Division of Health and Nutrition Examination Surveys. Duong T. Nguyen, Kirsten A. Herrick, and Lara Akinbami are with the NCHS, Division of Health and Nutrition Examination Surveys.
References
- Yang K, Turk MT, Allison VL, James KA, Chasens E. Body mass index self-perception and weight management behaviors during late adolescence. J Sch Health 84:654–60. 2014.
- Houle-Johnson SA, Kakinami L. Do sex differences in reported weight loss intentions and behaviours persist across demographic characteristics and weight status in youth? A systematic review. BMC Public Health 18:1343. 2018.
- Lowry R, Galuska DA, Fulton JE, Wechsler H, Kann L. Weight management goals and practices among U.S. high school students: Associations with physical activity, diet and smoking. J Adolesc Health 31(2):133–44. 2002.
- Silva DF, Sena-Evangelista KC, Lyra CO, Pedrosa LF, Arrais RF, Lima SC. Motivation for weight loss in adolescents with overweight and obesity: A systemic review. BMC Pediatr18:364. 2018.
- Hales CM, Carrol MD, Fryar HG, Ogden CL. Prevalence of obesity among adults and youth: United States, 2015–2016. NCHS Data Brief, no 288. Hyattsville, MD: National Center for Health Statistics. 2017.
- Ogden CL, Flegal KM. Changes in terminology for childhood overweight and obesity. National Health Statistics Report; no 25. Hyattsville, MD: National Center for Health Statistics. 2010.
Suggested citation
McDow KB, Nguyen DT, Herrick KA, Akinbami LJ. Attempts to lose weight among adolescents aged 16–19 in the United States, 2013–2016. NCHS Data Brief, no 340. Hyattsville, MD: National Center for Health Statistics. 2019.
Copyright information
All material appearing in this report is in the public domain and may be reproduced or copied without permission; citation as to source, however, is appreciated.
National Center for Health Statistics
Jennifer H. Madans, Ph.D., Acting Director
Amy M. Branum, Ph.D., Acting Associate Director for Science
Division of Health Interview Statistics
Kathryn S. Porter, M.D., M.S., Director
Ryne Paulose-Ram, M.A., Ph.D., Associate Director for Science