Prevalence of Herpes Simplex Virus Type 1 and Type 2 in Persons Aged 14–49: United States, 2015–2016
- Key findings
- Prevalence of HSV-1 during 2015–2016 was highest among Mexican-American persons and lowest among non-Hispanic white persons.
- Prevalence of HSV-1 decreased over time from 1999–2000 to 2015–2016.
- Prevalence of HSV-2 during 2015–2016 was highest among non-Hispanic black persons and lowest among non-Hispanic Asian persons.
- Prevalence of HSV-2 decreased over time from 1999–2000 to 2015–2016.
- Summary
- Definitions
- Data source and methods
- About the authors
- References
- Suggested citation
NCHS Data Brief No. 304, February 2018
PDF Versionpdf icon (406 KB)
Geraldine McQuillan, Ph.D., Deanna Kruszon-Moran, M.S., Elaine W. Flagg, Ph.D., M.S., and Ryne Paulose-Ram, Ph.D., M.A.
Key findings
Data from the National Health and Nutrition Examination Survey
- During 2015–2016, prevalence of herpes simplex virus type 1 (HSV-1) was 47.8%, and prevalence of herpes simplex virus type 2 (HSV-2) was 11.9%.
- Prevalence of both HSV-1 and HSV-2 increased with age.
- Prevalence of both HSV-1 and HSV-2 was higher among females than males.
- Prevalence of HSV-1 was highest among Mexican-American persons and lowest among non-Hispanic white persons. HSV-2 prevalence was highest among Hispanic black persons and lowest among non-Hispanic Asian persons.
- Prevalence of both HSV-1 and HSV-2 decreased from 1999–2000 to 2015–2016 (from 59.4% to 48.1%, and from 18.0% to 12.1%, respectively).
Herpes simplex virus types 1 and 2 (HSV-1 and HSV-2) are common, lifelong infections, which often have no symptoms (1). People with symptoms may have painful blisters or sores at the site of infection (2,3). The viruses are transmitted through contact with an infected person’s lesion, mucosal surface, or genital or oral secretions. This report provides recent national estimates of HSV-1 and HSV-2 antibody prevalence from the 2015–2016 National Health and Nutrition Examination Survey (NHANES) among persons aged 14–49 by age, sex, and race and Hispanic origin, and examines trends in prevalence by race and Hispanic origin from 1999–2000 to 2015–2016.
Keywords: HSV-1, HSV-2, NHANES
Prevalence of HSV-1 during 2015–2016 was highest among Mexican-American persons and lowest among non-Hispanic white persons.
- The prevalence of HSV-1 among persons aged 14–49 was 47.8% (48.1% when adjusted for age) (Figure 1).
- Prevalence increased linearly with age, from 27.0% among those aged 14–19, to 41.3%, 54.1%, and 59.7% among those aged 20–29, 30–39, and 40–49, respectively.
- Age-adjusted prevalence was higher among females (50.9%) than males (45.2%).
- Age-adjusted prevalence was highest among Mexican-American persons (71.7%) and lowest among non-Hispanic white persons (36.9%). There was no significant difference in prevalence between non-Hispanic black (58.8%) and non-Hispanic Asian (55.7%) persons.
Figure 1. Age-adjusted prevalence of herpes simplex virus type 1 among persons aged 14–49, by age group, sex, and race and Hispanic origin: United States, 2015–2016
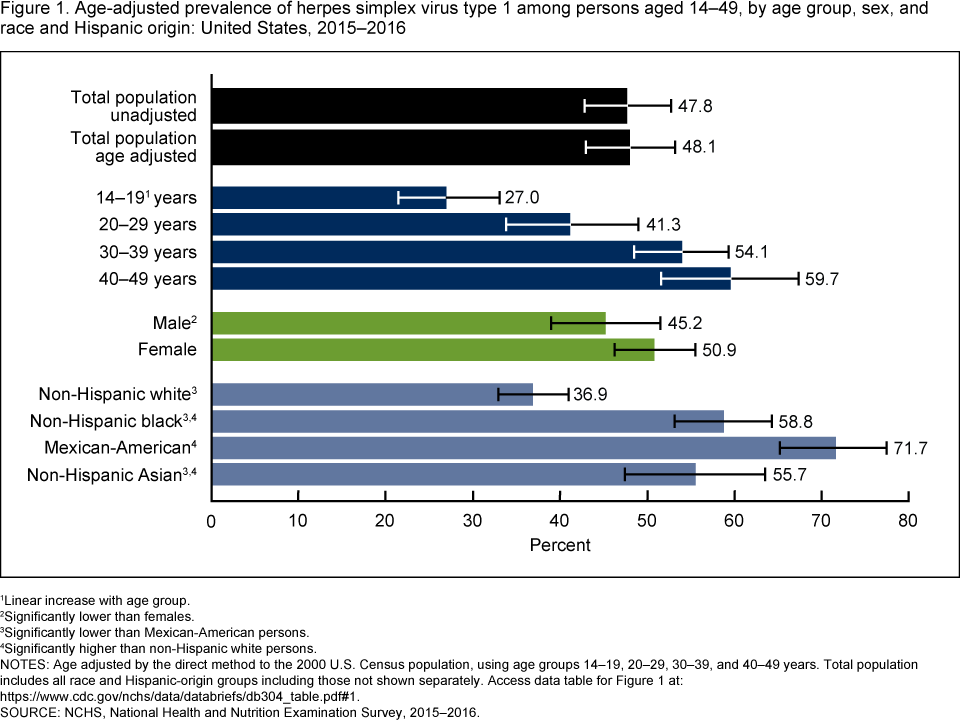 image icon
1Linear increase with age group.
2Significantly lower than females.
3Significantly lower than Mexican-American persons.
4Significantly higher than non-Hispanic white persons.
NOTES: Age adjusted by the direct method to the 2000 U.S. Census population, using age groups 14–19, 20–29, 30–39, and 40–49 years. Total population includes all race and Hispanic-origin groups including those not shown separately. Access data table for Figure 1pdf icon.
SOURCE: NCHS, National Health and Nutrition Examination Survey, 2015–2016.
Prevalence of HSV-1 decreased over time from 1999–2000 to 2015–2016.
- Age-adjusted prevalence of HSV-1 decreased linearly over time by 11.3 percentage points, from 59.4 % in 1999–2000Figure 2).
- Age-adjusted prevalence of HSV-1 decreased linearly from 1999–2000 to 2015–2016 for all race and Hispanic-origin subgroups: from 52.4% to 36.9% for non-Hispanic white, 68.4% to 58.8% for non-Hispanic black, and 82.0% to 71.7% for Mexican-American persons.
Figure 2. Trends in age-adjusted prevalence of herpes simplex virus type 1 among persons aged 14–49, for the total population and by race and Hispanic origin: United States, 1999–2000 through 2015–2016
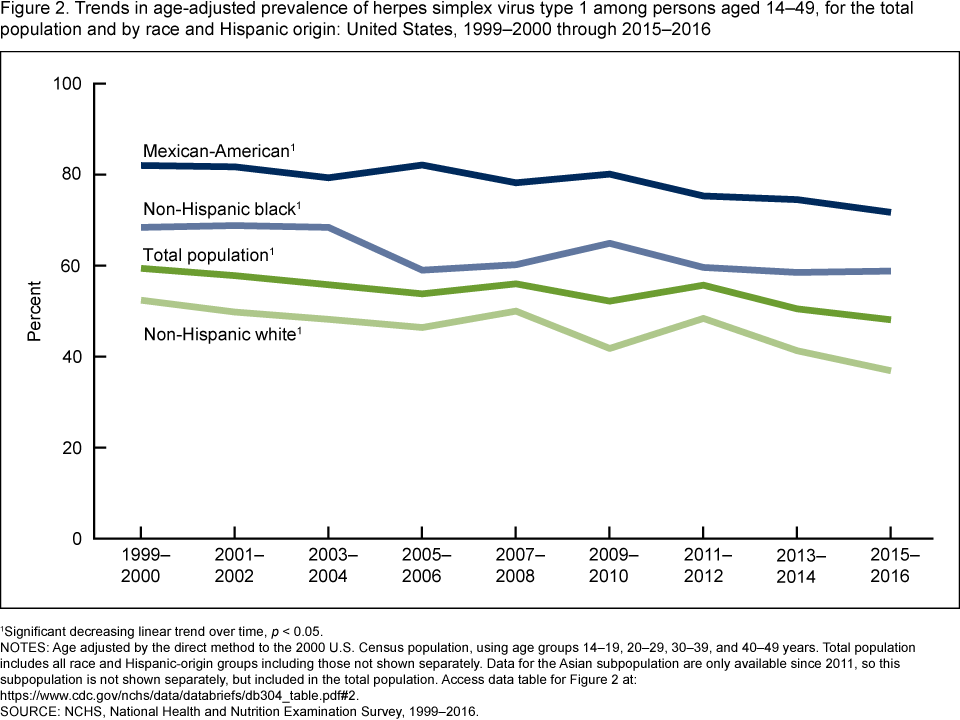 image icon
1Significant decreasing linear trend over time, p < 0.05.
NOTES: Age adjusted by the direct method to the 2000 U.S. Census population, using age groups 14–19, 20–29, 30–39, and 40–49 years. Total population includes all race and Hispanic-origin groups including those not shown separately. Data for the Asian subpopulation are only available since 2011, so this subpopulation is not shown separately, but included in the total population. Access data table for Figure 2pdf icon.
SOURCE: NCHS, National Health and Nutrition Examination Survey, 1999–2016.
Prevalence of HSV-2 during 2015–2016 was highest among non-Hispanic black persons and lowest among non-Hispanic Asian persons.
- The prevalence of HSV-2 among persons aged 14–49 was 11.9% (12.1% when adjusted for age) (Figure 3).
- Prevalence increased linearly with age, from 0.8% among persons aged 14–19, to 7.6%, 13.3%, and 21.2% among those aged 20–29, 30–39, and 40–49, respectively.
- Age-adjusted prevalence was higher among females (15.9%) than males (8.2%).
- Age-adjusted prevalence was highest among non-Hispanic black persons (34.6%) and lowest among non-Hispanic Asian persons (3.8%). There was no significant difference in prevalence between non-Hispanic white (8.1%) and Mexican-American (9.4%) persons.
Figure 3. Age-adjusted prevalence of herpes simplex virus type 2 among persons aged 14–49, by age group, sex, and race and Hispanic origin: United States, 2015–2016
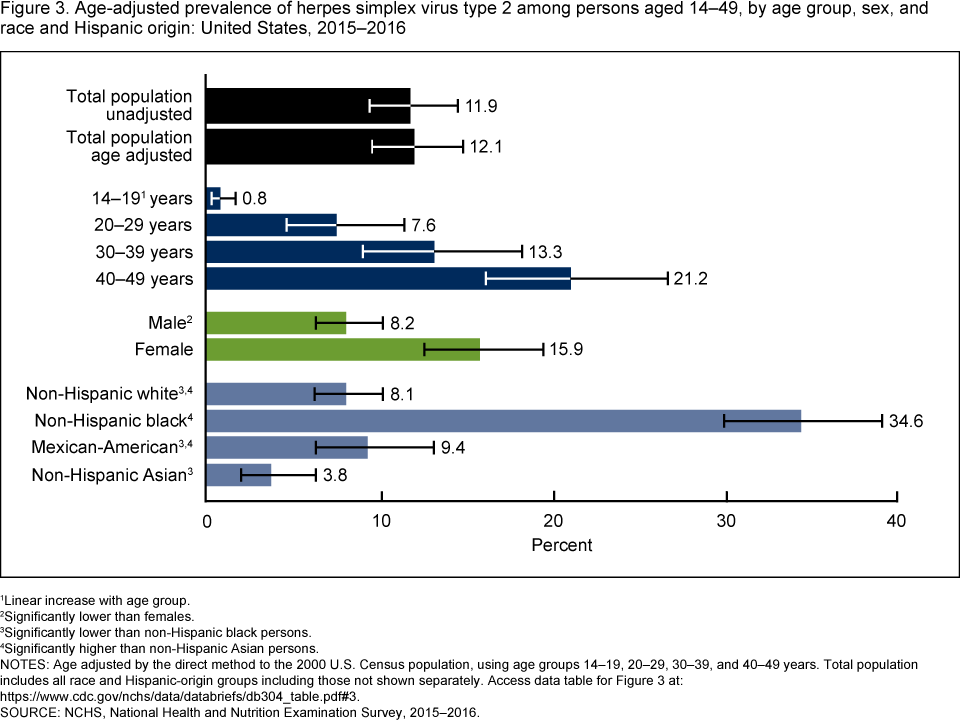 image icon
1Linear increase with age group.
2Significantly lower than females.
3Significantly lower than non-Hispanic black persons.
4Significantly higher than non-Hispanic Asian persons.
NOTES: Age adjusted by the direct method to the 2000 U.S. Census population, using age groups 14–19, 20–29, 30–39, and 40–49 years. Total population includes all race and Hispanic-origin groups including those not shown separately. Access data table for Figure 3pdf icon.
SOURCE: NCHS, National Health and Nutrition Examination Survey, 2015–2016.
Prevalence of HSV-2 decreased over time from 1999–2000 to 2015–2016.
- Age-adjusted prevalence of HSV-2 decreased linearly over time by 5.9 percentage points, from 18.0% in 1999–2000 to 12.1% in 2015–2016 (Figure 4).
- Age-adjusted prevalence of HSV-2 decreased linearly from 1999–2000 to 2015–2016 for all race and Hispanic-origin subgroups: 14.1% to 8.1% for non-Hispanic white, 41.5% to 34.6% for non-Hispanic black, and 12.8% to 9.4% for Mexican-American persons.
Figure 4. Trends in age-adjusted prevalence of herpes simplex virus type 2 among persons aged 14–49, for the total population and by race and Hispanic origin: United States, 1999–2000 through 2015–2016
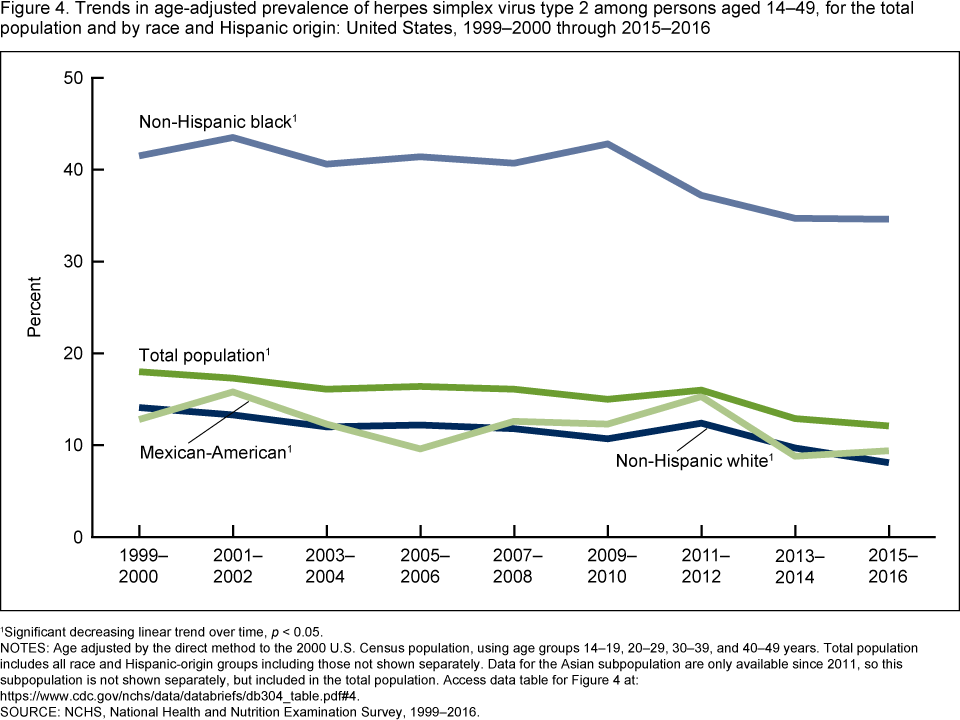 image icon
1Significant decreasing linear trend over time, p < 0.05.
NOTES: Age adjusted by the direct method to the 2000 U.S. Census population, using age groups 14–19, 20–29, 30–39, and 40–49 years. Total population includes all race and Hispanic-origin groups including those not shown separately. Data for the Asian subpopulation are only available since 2011, so this subpopulation is not shown separately, but included in the total population. Access data table for Figure 4pdf icon.
SOURCE: NCHS, National Health and Nutrition Examination Survey, 1999–2016.
Summary
During 2015–2016, the prevalence of HSV-1 was 47.8% and of HSV-2 was 11.9% among those aged 14–49. Prevalence of both viruses was higher among females than males and increased linearly with age. Differences by race and Hispanic origin were different for the two viruses, with Mexican-American persons having the highest prevalence of HSV-1 (71.7%) and non-Hispanic black persons having the highest prevalence of HSV-2 (34.6%). Differences by race and Hispanic origin, and the increasing prevalence with increasing age for both HSV-1 and HSV-2, have been reported previously (4,5). The higher prevalence of HSV-2 among females has also been reported (6).
From 1999 through 2016, there was a significant decline in the age-standardized prevalence of HSV-1 and HSV-2. For both virus types, a decrease in prevalence over time was seen in all race and Hispanic-origin subpopulations. Decreasing HSV-1 prevalence has been reported previously (4–7). A nonsignificant decline in overall prevalence of HSV-2 from 1999 through 2010 was reported in a previous study (5).
This report provides the latest estimates of HSV-1 and HSV-2 prevalence in the United States. NHANES does not include populations that may be at higher risk for acquiring HSV-2 (e.g., those incarcerated and the homeless). Therefore, these data may provide conservative estimates of both HSV-1 and HSV-2 in the U.S. population aged 14–49.
Definitions
HSV-1: Prevalence of antibody to herpes simplex virus type 1 from tested sera.
HSV-2: Prevalence of antibody to herpes simplex virus type 2 from tested sera.
Data source and methods
Data for this report are from NHANES, a cross-sectional survey that uses a complex, multistage, probability design to select a sample of the civilian noninstitutionalized U.S. population. It consists of interviews in participants’ homes, followed by standardized physical examinations that include collection of various biological specimens. In 1999–2016, sera for HSV-1 and HSV-2 antibody testing were available for persons aged 14–49 (see: https://wwwn.cdc.gov/nchs/data/nhanes/2013-2014/labmethods/HSV_H_MET_HERPES_1_2.pdfpdf icon). In 2011–2016, non-Hispanic black, non-Hispanic Asian, and Hispanic persons, including Mexican American-persons, were oversampled. Refer to the NHANES website for further details.
Estimates were calculated in SAS-callable SUDAAN software release 11.0 (RTI International, Research Triangle Park, N.C). Examination weights were used to account for differing probabilities of selection, nonresponse, and noncoverage. Taylor series linearization was used to calculate standard errors. Age adjustment was done by the direct method to the 2000 projected Census population using age groups 14–19, 20–29, 30–39, and 40–49. All reported estimates met statistical reliability criteria (relative standard error less than 30% and greater than 10 positive cases). Individual differences between sex and race and Hispanic subgroups, as well as a linear trend with age, were evaluated using orthogonal contrasts to calculate a Student’s t statistic. Linear regression modeling was used to determine significance of linear and quadratic trends with time controlling for age group. Differences were considered significant at p < 0.05.
About the authors
Geraldine McQuillan, Deanna Kruszon-Moran, and Ryne Paulose-Ram are with the National Center for Health Statistics, Division of Health and Nutrition Examination Surveys. Elaine W. Flagg is with the National Center for HIV/AIDS, Viral Hepatitis, STD, and TB Prevention, Division of STD Prevention.
References
- Tronstein E, Johnston C, Huang ML, Selke S, Magaret A, Warren T, et al. Genital shedding of herpes simplex virus among symptomatic and asymptomatic persons with HSV-2 infection. JAMA 305(14):1441–9. 2011.
- Ryder N, Jin F, McNulty AM, Grulich AE, Donovan B. Increasing role of herpes simplex virus type 1 in first-episode anogenital herpes in heterosexual women and younger men who have sex with men, 1992–2006. Sex Transm Infect 85(6):416–9. 2009.
- Bernstein DI, Bellamy AR, Hook EW 3rd, Levin MJ, Wald A, Ewell MG, et al. Epidemiology, clinical presentation, and antibody response to primary infection with herpes simplex virus type 1 and type 2 in young women. Clin Infect Dis 56(3):344–51. 2013.
- Xu F, Sternberg MR, Kottiri BJ, McQuillan GM, Lee FK, Nahmias AJ, et al. Trends in herpes simplex virus type 1 and type 2 seroprevalence in the United States. JAMA 296(8):964–73. 2006.
- Bradley H, Markowitz LE, Gibson T, McQuillan GM. Seroprevalence of herpes simplex virus types 1 and 2—United States, 1999–2010. J Infect Dis 209(3):325–33. 2014.
- Dickson N, Righarts A, van Roode T, Paul C, Taylor J, Cunningham AL. HSV-2 incidence by sex over four age periods to age 38 in a birth cohort. Sex Transm Infect 90(3):243–5. 2014.
- Dukers NH, Bruisten SM, van den Hoek JA, de Wit JB, van Doornum GJ, Coutinho RA. Strong decline in herpes simplex virus antibodies over time among young homosexual men is associated with changing sexual behavior. Am J Epidemiol 152(7):666–73. 2000.
Suggested citation
McQuillan G, Kruszon-Moran D, Flagg EW, Paulose-Ram R. Prevalence of herpes simplex virus type 1 and type 2 in persons aged 14–49: United States, 2015–2016. NCHS Data Brief, no 304. Hyattsville, MD: National Center for Health Statistics. 2018.
Copyright information
All material appearing in this report is in the public domain and may be reproduced or copied without permission; citation as to source, however, is appreciated.
National Center for Health Statistics
Charles J. Rothwell, M.S., M.B.A., Director
Jennifer H. Madans, Ph.D., Associate Director for Science
Division of Health and Nutrition Examination Surveys
Kathryn S. Porter, M.D., M.S., Director
Ryne Paulose-Ram, Ph.D., Associate Director for Science