Hospitalization for Total Hip Replacement Among Inpatients Aged 45 and Over: United States, 2000–2010
- Key findings
- Has the number of total hip replacements changed since 2000?
- Has the age distribution of total hip replacement among inpatients aged 45 and over changed between 2000 and 2010?
- Has the rate of total hip replacements in the population aged 45 and over changed since 2000?
- Has the average length of stay after total hip replacement among inpatients aged 45 and over changed since 2000?
- Summary
- Definitions
- Data source and methods
- About the authors
- References
- Suggested citation
NCHS Data Brief No. 186, February 2015
PDF Versionpdf icon (627 KB)
Monica L. Wolford, M.A.; Kathleen Palso, M.A.; and Anita Bercovitz, M.P.H., Ph.D.
Key findings
Data from the National Hospital Discharge Survey
- In 2010, 310,800 total hip replacements were performed among inpatients aged 45 and over.
- The number and rate of total hip replacements among inpatients aged 45 and over increased from 2000 to 2010: from 138,700 to 310,800 in number and from a rate of 142.2 to 257.0 per 100,000 population.
- The age distribution of inpatients aged 45 and over who received total hip replacements changed significantly between 2000 and 2010, with the percentage of total hip replacements increasing for younger age groups and decreasing for older age groups.
- The average length of stay after total hip replacement among inpatients aged 45 and over decreased from 2000 to 2010, from nearly 5 days to just under 4 days.
Total hip replacement, in which both the head of the femur and its socket are replaced, is done to restore movement to hips damaged by osteoarthritis, late-stage degenerative bone and cartilage disease, or other injuries and disease (1). The number of total hip replacements is expected to increase over the next few decades (2). National Hospital Discharge Survey (NHDS) data show trends and estimates of the number and rate of total hip replacements and average length of stay among inpatients aged 45 and over.
Keywords: joint replacement, hospital, National Hospital Discharge Survey
Has the number of total hip replacements changed since 2000?
- In 2010, 326,100 total hip replacements were performed among inpatients of all ages. Inpatients aged 45 and over accounted for 95% (310,800) of all total hip replacements (data not shown).
Figure 1. Number of total hip replacements among inpatients aged 45 and over, by age group and year: United States, 2000–2010
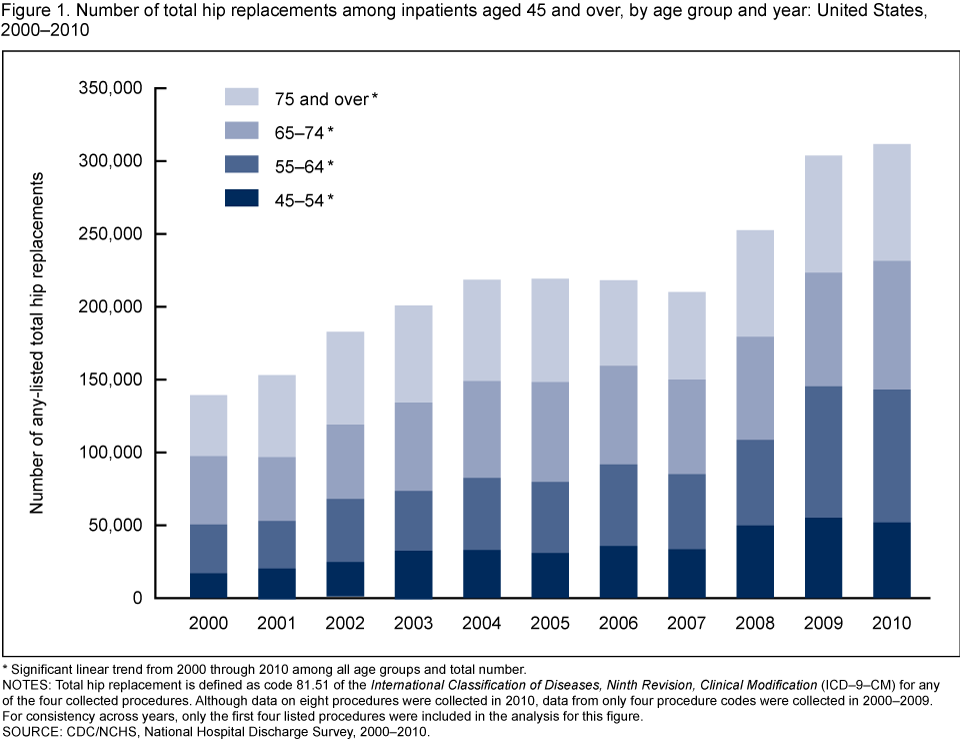
* Significant linear trend from 2000 through 2010 among all age groups and total number.
NOTES: Total hip replacement is defined as code 81.51 of the International Classification of Diseases, Ninth Revision, Clinical Modification (ICD–9–CM) for any of the four collected procedures. Although data on eight procedures were collected in 2010, data from only four procedure codes were collected in 2000–2009. For consistency across years, only the first four listed procedures were included in the analysis for this figure.
SOURCE: CDC/NCHS, National Hospital Discharge Survey, 2000–2010.
- The annual number of total hip replacements among inpatients aged 45 and over more than doubled between 2000 and 2010, from 138,700 in 2000 to 310,800 in 2010 (Figure 1).
- Similarly, the percentage increase in the number of total hip replacements among inpatients aged 45 and over by age ranged from 92% for those 75 and over (from 41,600 in 2000 to 80,000 in 2010) to 205% for those aged 45–54 (from 17,000 to 51,900).
Has the age distribution of total hip replacement among inpatients aged 45 and over changed between 2000 and 2010?
- In 2000, 12% of all inpatient total hip replacements were performed on those aged 45–54; this percentage increased to 17% in 2010. The percentage of total hip replacements performed on those aged 55–64 also increased (from 24% to 29%) (Figure 2).
- The percentage of all inpatient hip replacements decreased for age groups 65–74 (from 34% in 2000 to 28% in 2010) and 75 and over (from 30% to 26%).
- In 2000, the percentage of total hip replacement among inpatients aged 55–64 was 24%, which was significantly lower than the percentage in the 75 and over group (30%). In contrast, by 2010, more total hip replacements were performed on inpatients aged 55–64 (29%) than on inpatients 75 and over (26%).
Figure 2. Percent distribution of total hip replacements among inpatients aged 45 and over: United States, 2000 and 2010
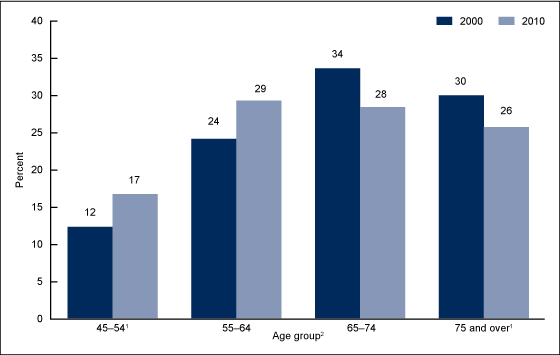
1Significantly different from age groups 55–64 and 65–74 in both 2000 and 2010.
2Significant differences between 2000 and 2010 for each age group.
NOTES: Total hip replacement is defined as code 81.51 of the International Classification of Diseases, Ninth Revision, Clinical Modification (ICD–9–CM) for any of the four collected procedures. Percentages are calculated only for ages 45 and over. Although data on eight procedures were collected in 2010, data from only four procedure codes were collected in 2000–2009. For consistency across years, only the first four listed procedures were included in the analysis for this figure.
SOURCE: CDC/NCHS, National Hospital Discharge Survey, 2000 and 2010.
Has the rate of total hip replacements in the population aged 45 and over changed since 2000?
- Between 2000 and 2010, the rate of total hip replacements in the population aged 45 and over increased for each age group (Figure 3).
- The rate of total hip replacement more than doubled for those aged 45–54 over the 11 years from 2000 through 2010, from 45 to 117 total hip replacements per 100,000 population. However, this rate was still lower than the rates for older age groups.
- The rate of total hip replacement increased among older age groups as well from 2000 to 2010: by 85% for those aged 55–64 (from 137 to 253), by 62% for those aged 65–74 (from 254 to 412), and by 68% for those aged 75 and over (from 249 to 418).
Figure 3. Rate of hospitalization for total hip replacement among ages 45 and over: United States, 2000–2010
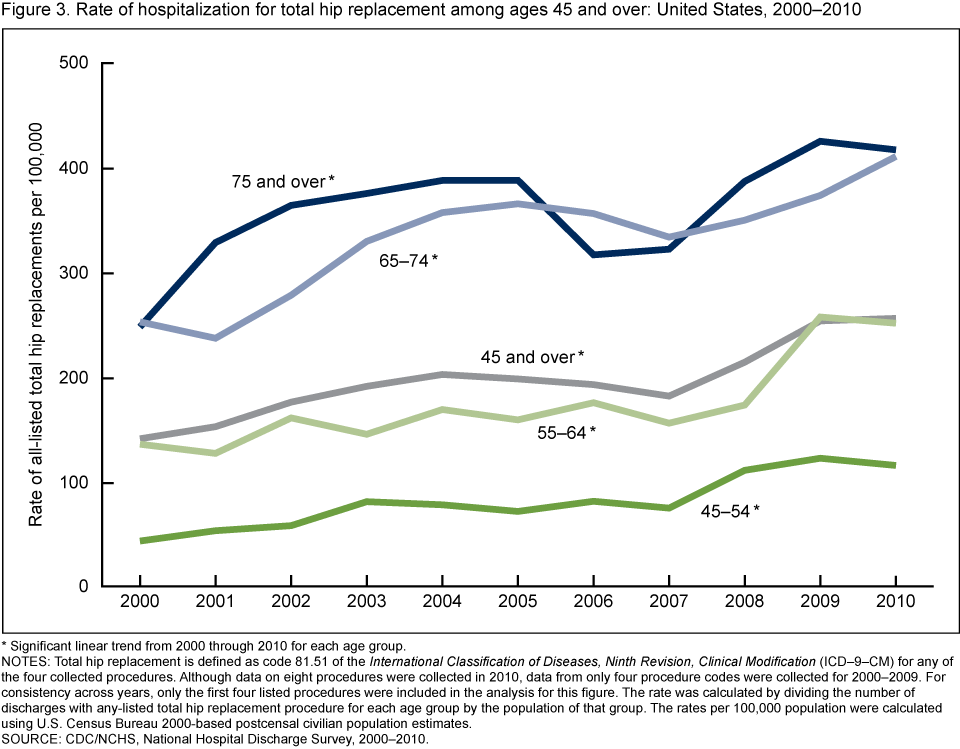
* Significant linear trend from 2000 through 2010 for each age group.
NOTES: Total hip replacement is defined as code 81.51 of the International Classification of Diseases, Ninth Revision, Clinical Modification (ICD–9–CM) for any of the four collected procedures. Although data on eight procedures were collected in 2010, data from only four procedure codes were collected for 2000–2009. For consistency across years, only the first four listed procedures were included in the analysis for this figure. The rate was calculated by dividing the number of discharges with any-listed total hip replacement procedure for each age group by the population of that group. The rates per 100,000 population were calculated using U.S. Census Bureau 2000-based postcensal civilian population estimates.
SOURCE: CDC/NCHS, National Hospital Discharge Survey, 2000–2010.
Has the average length of stay after total hip replacement among inpatients aged 45 and over changed since 2000?
- The average length of stay following total hip replacement decreased approximately 1 day for inpatients among all age groups 45 and over from 2000 through 2010 (Figure 4).
- In 2010, inpatients aged 45–54 with total hip replacement stayed an average of 3 days, which was lower than all other age groups.
- Inpatients aged 75 and over with total hip replacement stayed an average of 4 days in 2010, which was higher than all other age groups.
Figure 4. Average length of stay among inpatients aged 45 and over with total hip replacement: United States, 2000–2010
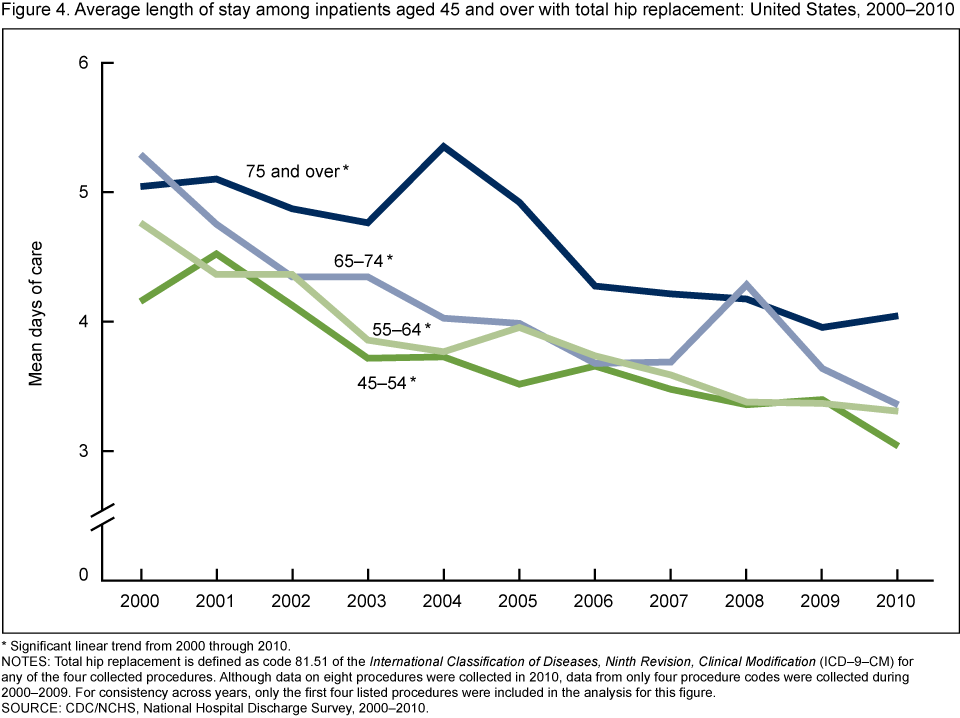
* Significant linear trend from 2000 through 2010.
NOTES: Total hip replacement is defined as code 81.51 of the International Classification of Diseases, Ninth Revision, Clinical Modification (ICD–9–CM) for any of the four collected procedures. Although data on eight procedures were collected in 2010, data from only four procedure codes were collected during 2000–2009. For consistency across years, only the first four listed procedures were included in the analysis for this figure.
SOURCE: CDC/NCHS, National Hospital Discharge Survey, 2000–2010.
Summary
In 2010, 310,800 total hip replacements were performed among inpatients aged 45 and over.
The number and rate of total hip replacements among inpatients aged 45 and over increased significantly from 2000 through 2010. The greatest increase in absolute numbers was in the 55–64 age group, where the number of total hip replacements almost tripled, whereas the greatest percentage change was in the 45–54 age group, which experienced a 205% increase. The 45–54 age group also had the greatest increase in rate, which more than doubled from 45 to 117 total hip replacements per 100,000 population.
In 2010, the average length of stay was shortest for the youngest age group and longest for the oldest group. Among those aged 45–54, the average stay was 3 days, lower than for each of the other age groups, while the average among those aged 75 and over was 4 days, higher than for each of the other age groups. From 2000 through 2010, the average length of stay decreased for each age group.
The findings in this report are similar to those of other published reports on the demographics of total hip replacements and changes over time (1,3,4). Given the overall aging of the U.S. population and the growing percentage of total hip replacements received by younger groups, monitoring changes in the prevalence of this procedure will continue to be important. In addition, the younger ages at which total hip replacements are performed may result in a greater number of procedures being done to replace artificial hip joints that have worn out over time.
Definitions
Total hip replacement: Surgery for persons with severe hip damage. During a total hip replacement operation, the surgeon removes damaged cartilage and bone from the hip joint, replacing both the head of the femur and the socket into which it fits with artificial parts. One or both hips may be replaced, although double hip replacements are rare. Partial hip replacement is the procedure where only the head of the femur is replaced; these are excluded from this analysis (visit MedlinePlusexternal icon for more information).
Hospitalization for total hip replacement: Includes those admitted with at least one procedure code for total hip replacement as denoted by International Classification of Diseases, Ninth Revision, Clinical Modification (ICD–9–CM) code 81.51 (5).
Rate: Refers to the number of hospitalizations per unit of population (i.e., per 100,000 population). Using rates removes the influence of different population sizes (e.g., age groups with different population sizes over multiple years) so that data can be compared across these groups. Rates were calculated using U.S. Census Bureau 2000-based postcensal civilian population estimates.
Length of stay: The total number of patient days accumulated at time of discharge by patients discharged from short-stay hospitals during 1 year. A stay of less than 1 day (patient admission and discharge on the same day) is counted as 1 day in the summation of total days of care. For patients admitted and discharged on different days, the number of days of care is computed by counting all days from (and including) the date of admission up to (but excluding) the date of discharge.
Average length of stay: The total number of days of care accumulated at time of discharge, divided by the number of discharges.
Data source and methods
Data for this report are from NHDS, a national probability sample survey of discharges from nonfederal short-stay hospitals or general hospitals in the United States, conducted from 1965 through 2010 by the Centers for Disease Control and Prevention’s (CDC) National Center for Health Statistics (NCHS), Division of Health Care Statistics. Survey data on hospital discharges were obtained from hospitals’ administrative data. Note that if a person is admitted to the hospital multiple times during the survey year, that person could be counted more than once in NHDS.
Because of the complex multistage design of NHDS, the survey data must be inflated or weighted to produce national estimates. Estimates of inpatient care presented in this report are based on discharges of inpatients aged 45 and over unless otherwise noted. More details about the design of NHDS have been published elsewhere (6).
From 2000 through 2009, information on up to four procedures was collected; in 2010, the number of procedures was increased to eight for data collection. Trend data are based on data from up to four procedures, and for consistency, data reported for 2010 are also based on data from four procedures. The 2010 data were analyzed using both four listed and eight listed procedures; both methods generated an estimated 310,800 total hip replacements.
Statistics are based on the population aged 45 and over, and the denominator used for calculating percentages includes only those aged 45 and over. Inpatients under age 45 accounted for 5.8% of all total hip replacements between 2000 and 2010; the percentages ranged from a high of 8.5% in 2000 to a low of 4.2% in 2008.
Age and days of care were imputed when missing. One percent or fewer of records had age or days of care imputed.
Differences among the subgroups were evaluated with two-tailed t tests and chi-square tests at alpha = 0.05 as the level of significance. Terms that express differences, such as higher, lower, largest, smallest, leading, increased, or decreased, were used only when such differences were statistically significant. When a comparison is described as similar, it means that no statistically significant difference was found. All comparisons reported in the text were statistically significant unless otherwise indicated. Data analyses were performed using the statistical packages SAS version 9.3.2 (SAS Institute, Cary, N.C.) and SUDAAN version 11.0.1 (RTI International, Research Triangle Park, N.C.).
About the authors
Monica L. Wolford, Kathleen Palso, and Anita Bercovitz are with CDC’s National Center for Health Statistics, Division of Health Care Statistics.
References
- Blum MA, Ibrahim SA. Race/ethnicity and use of elective joint replacement in the management of end-stage knee/hip osteoarthritis: A review of the literature. Clin Geriatr Med 28(3):521–32. 2012.
- Kurtz S, Ong K, Lau E, Mowat F, Halpern M. Projections of primary and revision hip and knee arthroplasty in the United States from 2005 to 2030. J Bone Joint Surg Am 89(4):780–5. 2007.
- Ravi B, Croxford R, Reichmann W, Losina E, Katz JN, Hawker GA. The changing demographics of total joint arthroplasty recipients in the United States and Ontario from 2001 to 2007. Best Pract Res Clin Rheumatol 26(5):637–47. 2012.
- Learmonth ID, Young C, Rorabeck C. The operation of the century: Total hip replacement. Lancet 370(9597):1508–19. 2007.
- Centers for Medicare & Medicaid Services. International classification of diseases, ninth revision, clinical modification, 6th ed. DHHS Pub No. (PHS) 06–1260. 2006.
- Hall MJ, DeFrances CJ, Williams SN, et al. National Hospital Discharge Survey: 2007 summary. National health statistics reports, no 29. 2010.
Suggested citation
Wolford ML, Palso K, Bercovitz A. Hospitalization for total hip replacement among inpatients aged 45 and over: United States, 2000–2010. NCHS data brief, no 186. Hyattsville, MD: National Center for Health Statistics. 2015.
Copyright information
All material appearing in this report is in the public domain and may be reproduced or copied without permission; citation as to source, however, is appreciated.
National Center for Health Statistics
Charles J. Rothwell, M.S., M.B.A., Director
Nathaniel Schenker, Ph.D., Deputy Director
Jennifer H. Madans, Ph.D., Associate Director for Science
Division of Health Care Statistics
Clarice Brown., M.S., Director