What Are Clinical Growth Charts?
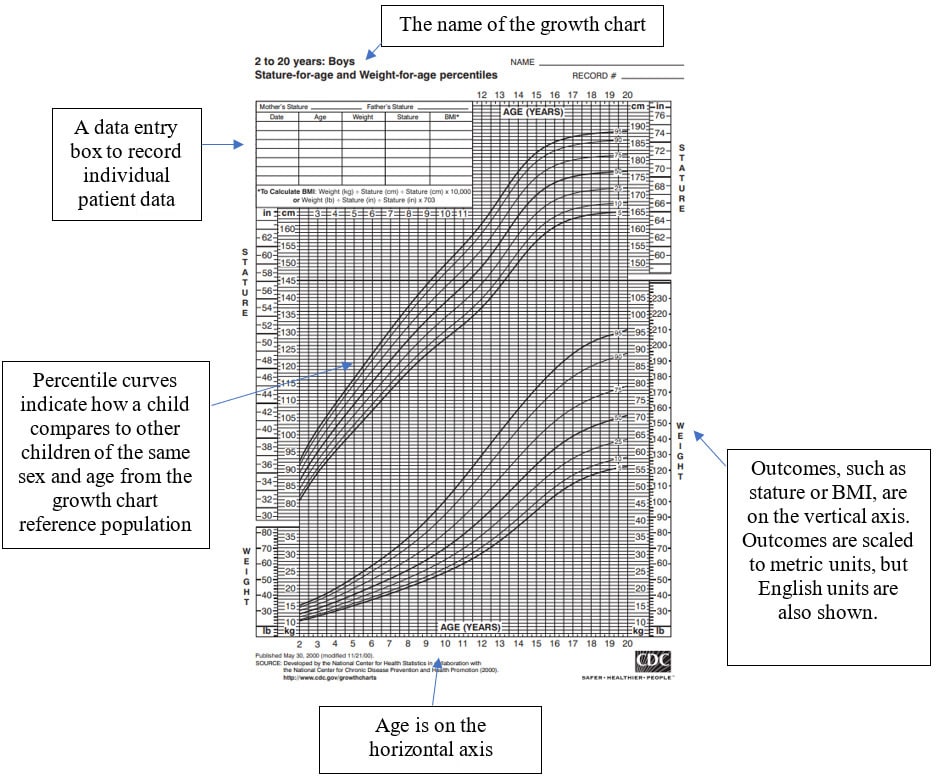
Clinical growth charts are percentile curves showing the distribution of selected body measurements in children. Growth charts are commonly used by pediatric health care providers and parents to plot and track children’s growth. Growth charts have several features, as shown in the example below.

Percentiles are the most commonly used clinical indicator to assess growth patterns of children. Percentiles rank the position of a person by indicating what percent of the reference population the person equals or exceeds.
An appropriate reference population, accurate measurements, and accurate age calculations are important factors when assessing childhood growth. Comparing body measurements to the appropriate age- and sex-specific growth chart allows pediatric health care providers to monitor growth and identify potential health- or nutrition-related problems.
To view, print, or learn more about the clinical growth charts available online, visit this web page.
- The clinical growth charts display age on the x-axis and an outcome such as stature, weight, or BMI on the y-axis.
- The clinical growth charts display English units only.