What to know
Why it Matters
State and local health partners need real-time tools to better anticipate, forecast, and model infectious disease outbreaks in their communities. Outbreaks can be complex and dynamic, and responders need actionable insights.
Insight Net members develop forecasting, modeling, and analytic tools that turn complex data into fast, actionable insights during outbreaks. This work helps public health leaders assess evolving scenarios, close gaps in data, and make timely decisions to stop and slow disease spread.
EpiENGAGE
States and cities across the U.S. use EpiENGAGE’s powerful forecasting and analytic tools to manage today’s outbreaks and anticipate tomorrow's threats.
- Led by: University of Texas, Austin
- Website: www.epiengage.org/
EpiEngage created VaxSim Measles to support a measles outbreak that began in West Texas. This simulator calculates the risk of school-based outbreaks based on a school's size, number of initial cases, and district vaccination rates. The city of Austin uses VaxSim Measles to model and identify vulnerabilities, like low vaccination rates. City officials then work with local public health to increase access to vaccines and prevent infections. EpiENGAGE shares their simulation technology with other communities outside of Texas. To date, the technology has been adapted for use in 23 other states, helping leaders make informed decisions to protect lives and livelihoods in their communities.

Epistorm
Public health officials across the country use Epistorm’s real-time predictive analytics to better understand the risks and potential impacts of international outbreaks.
- Led by: Northeastern University
- Website: www.epistorm.org/
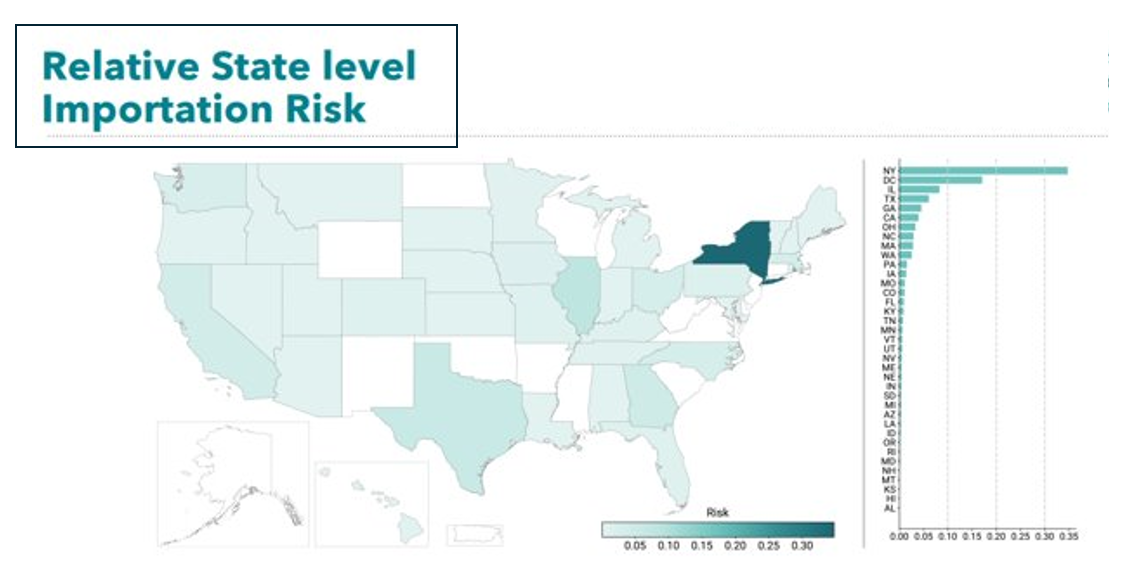
Epistorm provides rapid assessments that analyze the risk of infectious diseases being imported into the United States. The Epistorm team combines global travel data with information on how diseases spread to help public health officials anticipate where cases are most likely to appear. Since 2023, Epistorm has supported domestic decision-making during multiple global outbreaks, including monkeypox, Marburg virus disease, and Ebola virus disease. Epistorm's approach uses a flexible framework that can be quickly applied to new threats, ensuring timely insights during evolving global situations.
ForeSITE
State and local health departments across the Mountain West use ForeSITE’s tailored disease analytic tools to predict risk, spread, and impact of mitigation strategies on potential measles outbreaks.
- Forecasting and Surveillance of Infectious Threats and Epidemics (ForeSITE)
- Led by: University of Utah
- Website: www.insightnet.us/centers/foresite/
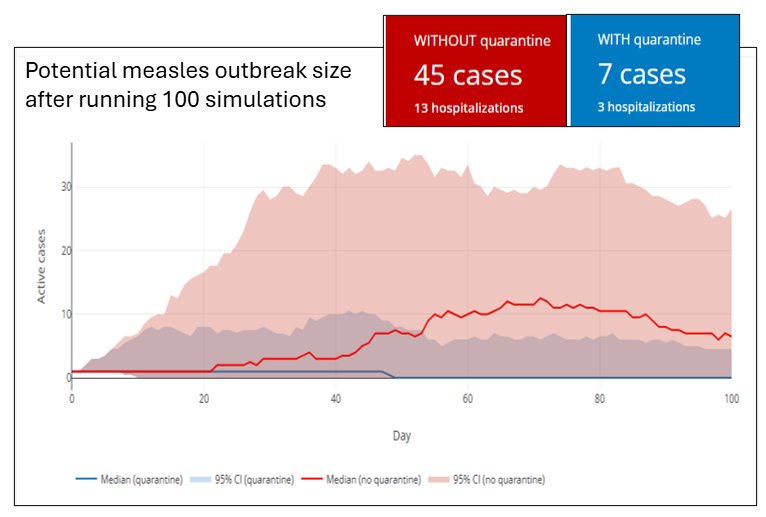
ForeSITE developed a suite of resources to help local jurisdictions understand potential measles spread and the impact of intervention. The tools include school-based outbreak simulators, an outbreak cost calculator, customizable communication templates for local health departments, and models that help assess quarantine strategies across different school and community settings. Together, these resources help public health partners anticipate outbreak dynamics, evaluate response options, and deliver more precise information to the public.
ACCIDDA
Public health partners in North Carolina use ACCIDDA’s disease modeling dashboards to map and forecast measles outbreaks so local decision-makers can strengthen preparedness and response.
- Atlantic Coast Center for Infectious Disease Dynamics and Analytics (ACCIDDA)
- Website: www.accidda.org/
- Led by: University of North Carolina, Chapel Hill
ACCIDDA collaborates with the North Carolina Department of Health and Human Services and launched a measles vaccination dashboard that estimates how well North Carolina elementary school students are protected against measles. Vaccination data are used to estimate coverage at the county, school and grade (K-5) level. When data are not available, the dashboard fills gaps based on statewide trends. ACCIDDA's innovative modeling techniques and enhanced data integration means better tools for local decision-makers. They strengthen preparedness and response to measles outbreaks across the state.

CORI
Health departments, policymakers, and other partners use CORI’s infectious disease risk assessments to evaluate public health threats, guiding policy and decisions for better outbreak response and preparedness.
- Center for Outbreak Response and Innovation (CORI)
- Led by: Johns Hopkins University
- Website: www.cori.centerforhealthsecurity.org/
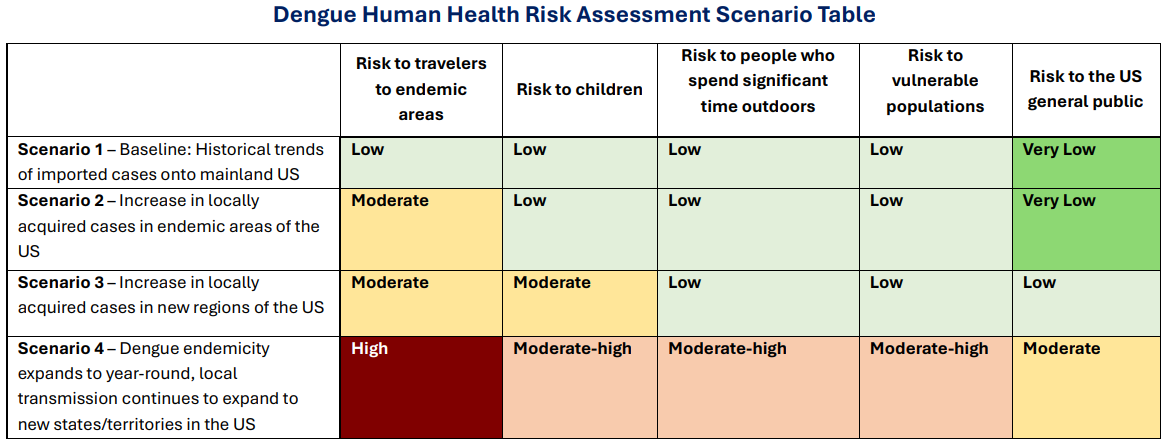
CORI conducts scenario-based risk assessments to evaluate potential health risks from emerging and ongoing infectious disease outbreaks. Threats including dengue, H5N1, measles, and monkeypox. These assessments offer a structured way to understand complex situations by estimating the risk of infection for specific populations. They combine new and known factors about a disease. Information like how it is transmitted, how severe infections are, what are possible prevention measures, and how are conditions evolving. CORI updates assessments as new information becomes available, creating critical tools that help guide policy and response decisions, even when data are limited.