


At a glance

Summary
CDC analyzed data from two large, nationally representative surveys, the National Immunization Survey-Flu (NIS-Flu) and the Behavioral Risk Factor Surveillance System (BRFSS), to assess influenza (flu) vaccination coverage for the 2025–26 flu season among children and adults in the United States. In the 2025–26 flu season, CDC recommended influenza (flu) vaccination for all people ≥6 months with no contraindications12. This report contains CDC's final flu vaccination coverage estimates for the 2025–26 flu season. Flu vaccination coverage (≥1 dose) was 51.4% among children 6 months through 17 years, an increase of 1.2 percentage points compared with the 2024–25 flu season (50.2%). This is the first increase in seasonal flu vaccination coverage among children since before the COVID-19 pandemic, although coverage is still 12.3 percentage points lower compared with the 2019–20 season (63.7%). Flu vaccination coverage among adults ≥18 years was 41.6%, similar to the prior season (41.9%). For adults, after an initial increase in flu vaccination coverage in the season immediately following the start of the COVID-19 pandemic, coverage steadily declined during the 2020–21 through 2024–25 seasons. Interpretation of the estimates in this report should take into consideration survey limitations.
Annual flu vaccination is an important strategy to reduce the risk of illness and serious complications from flu. For most people, September and October are ideal times to receive a flu vaccination; however, vaccination should continue after October as long as influenza viruses are circulating and unexpired flu vaccine is available.
Methods
For this report, CDC analyzed data from the NIS-Flu for children 6 months through 17 years and the BRFSS for adults ≥18 years to estimate national- and state-level flu vaccination coverage for the 2025–26 flu season. The analyses included data collected from interviews completed from September 2025 for BRFSS or October 2025 for NIS-Flu through June 2026, and vaccinations received between July 1, 2025, and the time of interview or by May 31, 2026.
The NIS-Flu is a national random-digit-dialed cellular telephone survey of households3. Respondents ≥18 years knowledgeable about the child's vaccinations (hereafter referred to as "parent" in this report) were asked if their child received a flu vaccination since July 1, 2025, and the month of vaccination; this information was not verified by medical records. Month of vaccination was missing for 17.7% of respondents who indicated their child was vaccinated. For these children, month was imputed using the hot-deck imputation method from other survey respondents who matched the week of interview, age group, state of residence, race and ethnicity, and mother's education of the child with missing data.* Respondents who indicated the child received a flu vaccination were asked the place where the child was vaccinated. The range of the Council of American Survey and Research Organizations (CASRO) monthly response rates for the NIS-Flu for the 2025–26 season was 20.6%–23.7%. The estimates for children are based on n=112,408 completed NIS-Flu interviews.
The BRFSS is a state-based random-digit-dialed cellular and landline telephone survey that collects information on various health conditions and risk behaviors from one randomly selected adult ≥18 years in a household. The BRFSS survey asks if the respondent has received a flu vaccine in the past 12 months and, if so, the month and year of vaccination4. For 8.1% of BRFSS participants who were vaccinated but had a missing month or year of vaccination, month and year were imputed using the hot-deck imputation method from other survey respondents who matched the week of the interview, age group, state of residence, and race/ethnicity of the respondent with missing data. California had a limited sample because data were only collected in California in June 2026. Estimates are not available for the 2025–26 influenza season from Mississippi because the BRFSS did not conduct interviews in Mississippi during September 2025–June 2026. The median state BRFSS response rate for a complete or partially complete interview was 44.7% for September–December 2025 and 44.9% for January–June 2026. The estimates for adults are based on n=252,699 completed BRFSS interviews.
Flu vaccination coverage estimates from both surveys were calculated using Kaplan-Meier survival analysis using the month of the reported flu vaccination to determine cumulative flu vaccination coverage. Coverage estimates for all persons ≥6 months were determined by combining the state-level monthly NIS-Flu and BRFSS estimates weighted by the age-specific populations of each state5. All estimates were weighted and analyzed using SAS and SAS-callable SUDAAN statistical software to account for the complex survey designs. Differences between groups and between 2025–26 and 2024–25 estimates were determined using t-tests with significance at p<0.05. Increases or decreases noted in this report were statistically significant differences.
Results
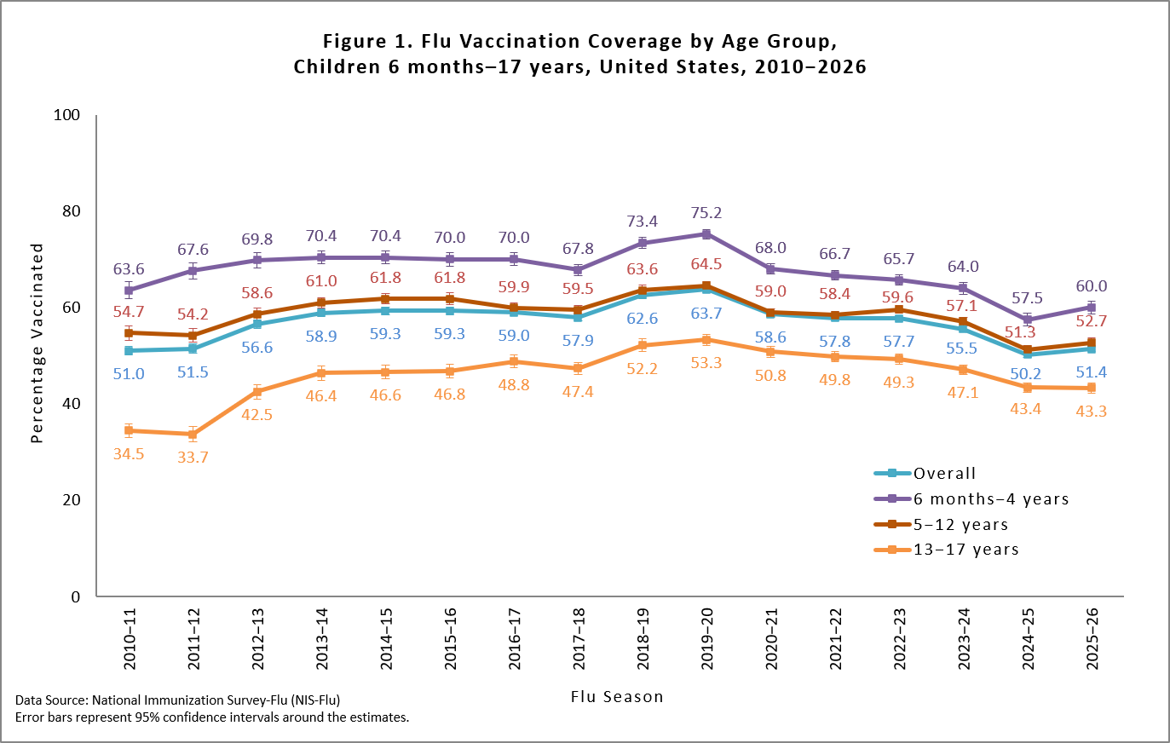
Overall, the percentage of children receiving ≥1 dose of flu vaccine during the 2025–26 season was 51.4%. This was an increase of 1.2 percentage points from the 2024–25 season (50.2%) and still 12.3 percentage points lower compared with the 2019–20 season before the COVID-19 pandemic (63.7%, Figure 1). Flu vaccination coverage among children aged 6 months–4 years (60.0%) and 5–12 years (52.7%) increased 2.5 and 1.4 percentage points, respectively, while coverage among children 13–17 years (43.3%) was similar compared with the previous season (Figure 1). For additional results by age group, see "Additional Flu Vaccination Coverage Estimates" at the end of the results section.
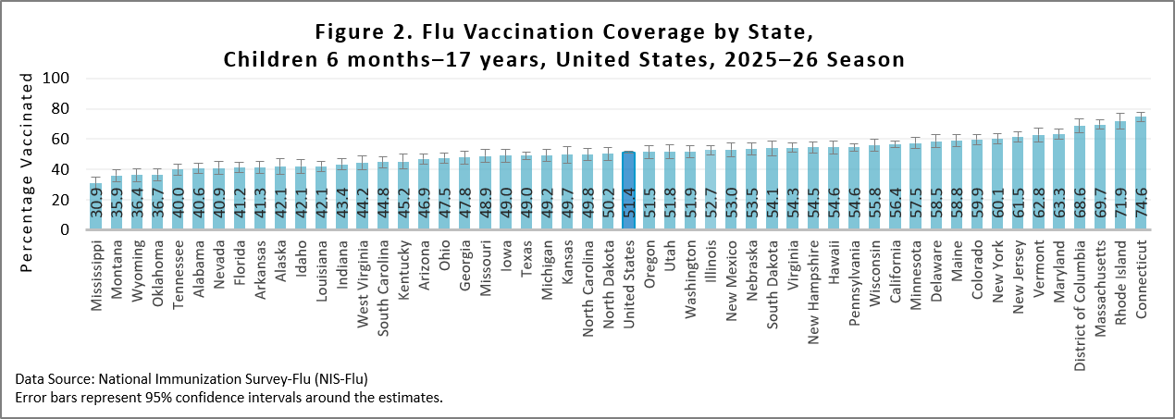
As is seen each flu season, for the 2025–26 season there was wide (43.7 percentage points) variability between states in flu vaccination coverage for children, ranging from 30.9% (Mississippi) to 74.6% (Connecticut) (Figure 2). To view additional state-level final, end of flu season vaccination coverage estimates using the same methods described in this report, see the interactive application at FluVaxView Interactive.
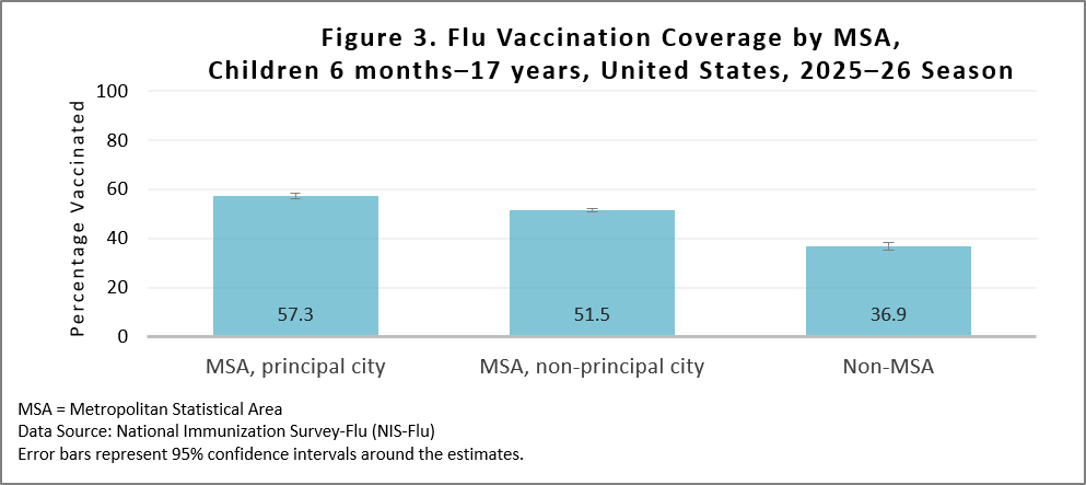
For the 2025–26 season flu vaccination coverage was higher for children living in a metropolitan statistical area (MSA) principal city (57.3%) compared with children living in a MSA non-principal city (51.5%) and children living in a non-MSA (36.9%) (Figure 3). The difference in flu vaccination coverage was also significant for children in a MSA non-principal vs a non-MSA. Additional results by MSA status are included in the "Additional Flu Vaccination Coverage Estimates" section of this report.
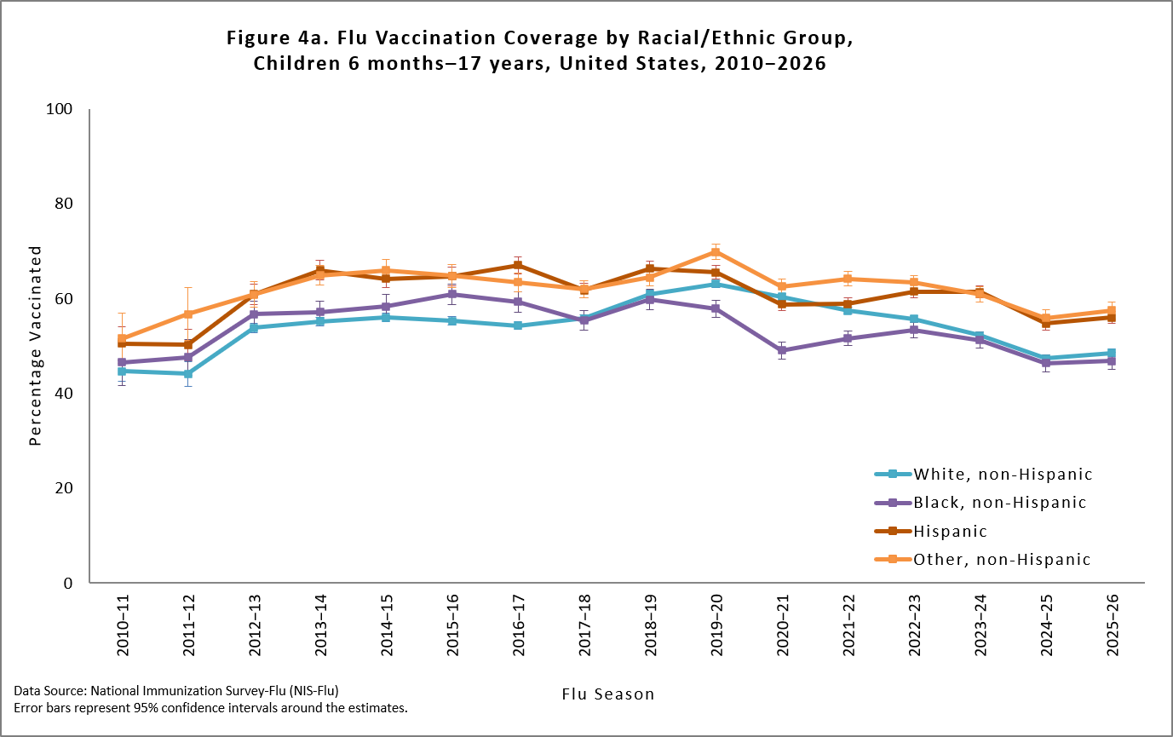
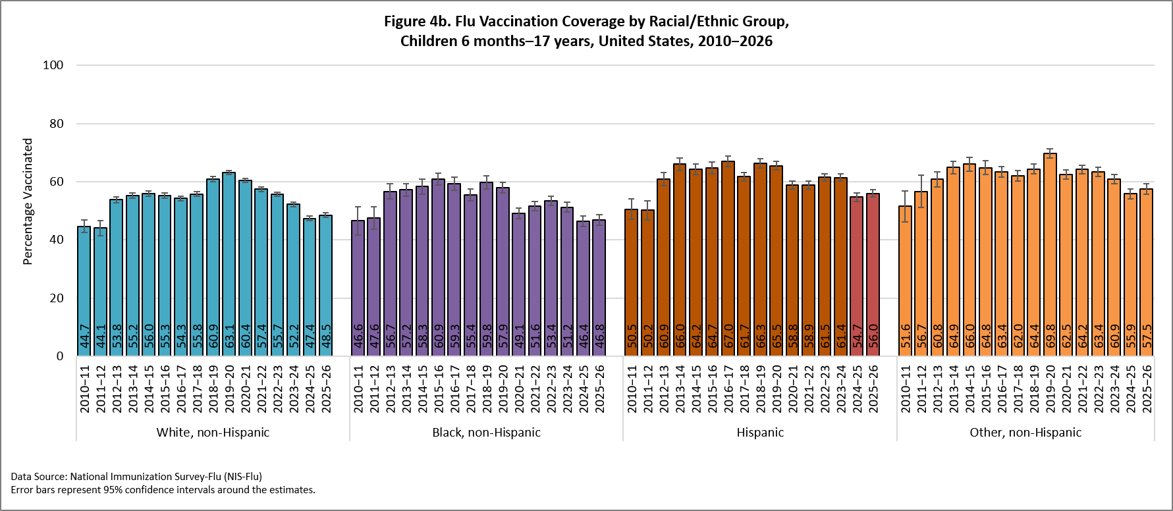
Flu vaccination coverage for the 2025–26 season was similar compared with the previous season among non-Hispanic White (White) children, non-Hispanic Black (Black) children, Hispanic children, and non-Hispanic children of other or multiple races (Figures 4a and 4b). Hispanic children and non-Hispanic children of other/multiple races had higher flu vaccination coverage than Black children and White children. No other statistically significant pair-wise differences were observed. Flu vaccination coverage estimates for more detailed racial/ethnic groups (Asian, American Indian/Alaska Native) are provided as a table weblink in the "Additional Flu Vaccination Coverage Estimates" section of this report.
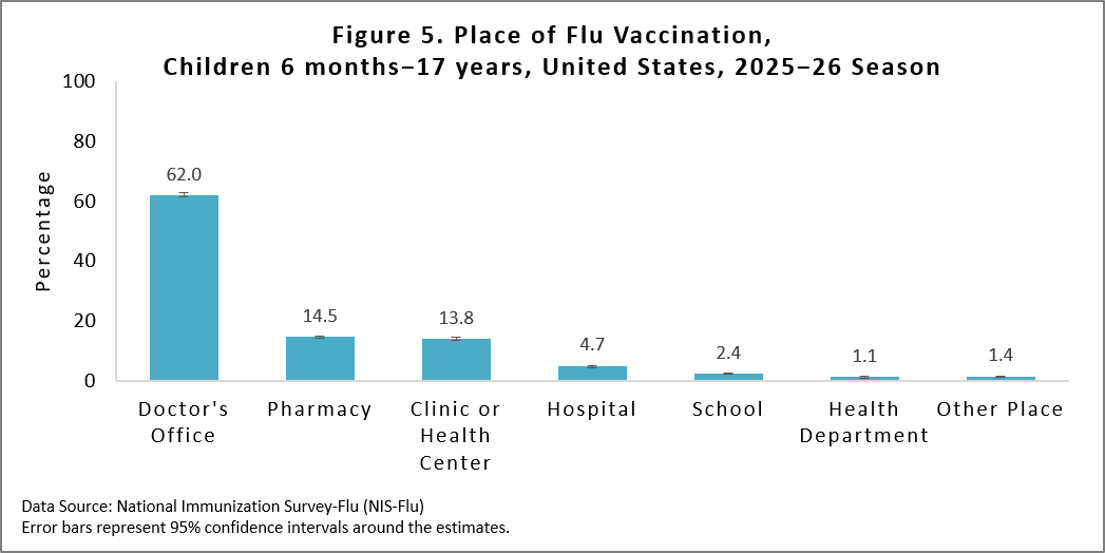
Place of flu vaccination among vaccinated children 6 months through 17 years for the 2025–26 season was most often a doctor's office (62.0%), followed by a pharmacy (14.5%), and clinic/health center (13.8%) (Figure 5). Place of flu vaccination by child age groups can be found in the "Additional Flu Vaccination Coverage Estimates" section of this report.
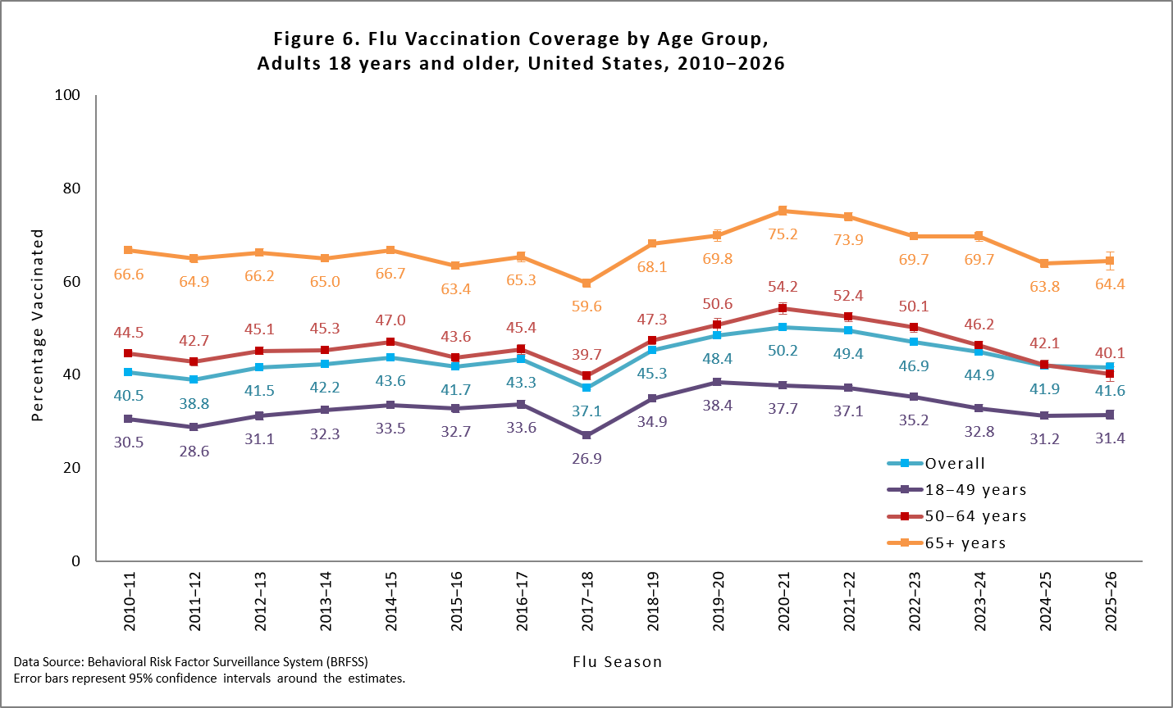
Overall, among adults ≥18 years, flu vaccination coverage was 41.6%, similar to coverage during the 2024–25 season (41.9%; Figure 6). Compared with the 2024–25 season, flu vaccination coverage in 2025–26 among adults 50–64 years decreased by 2.0 percentage points, while coverage among adults 18–49 years and ≥65 years was similar (Figure 6).
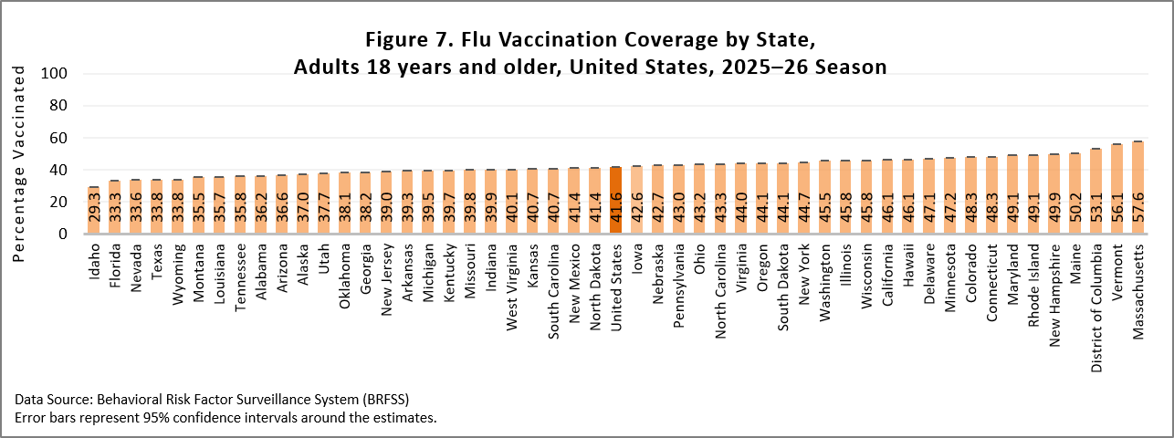
There was wide between-jurisdiction variability in flu vaccination coverage among adults, ranging from 29.3% in Idaho to 57.6% in Massachusetts (Figure 7). See FluVaxView Interactive for additional state-level estimates by age-groups and multiple flu seasons.
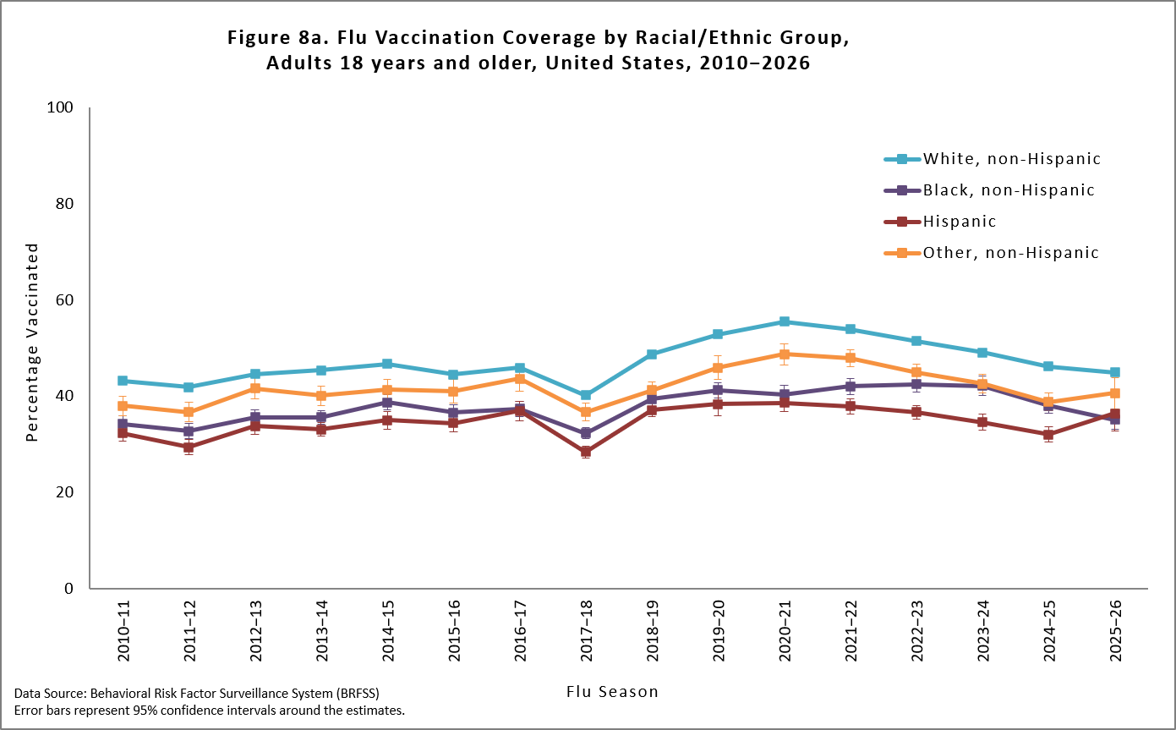
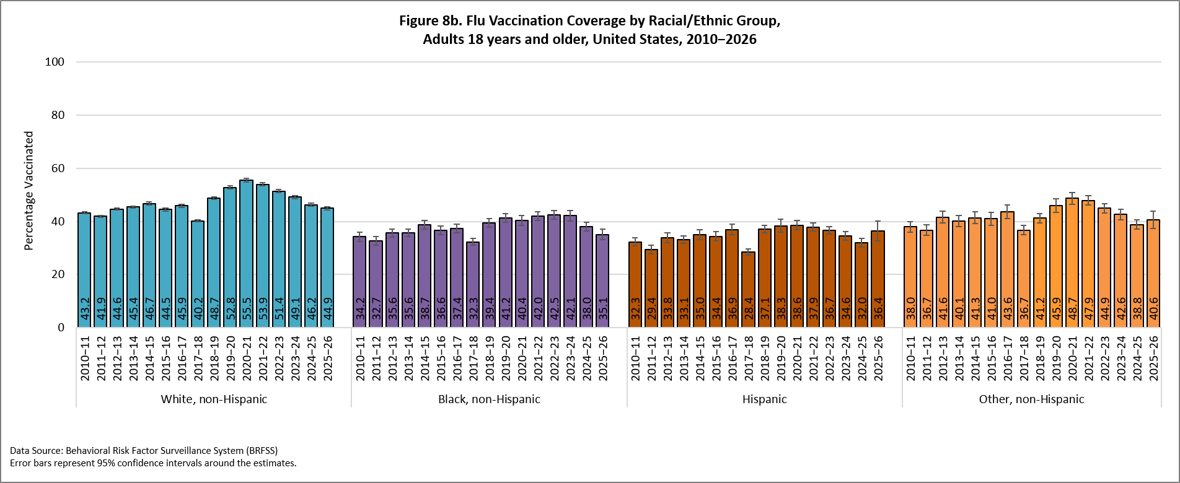
Flu vaccination coverage during the 2025–26 season among White and Black adults decreased by 1.3 and 2.9 percentage points, respectively, whereas coverage increased by 4.4 percentage points among Hispanic adults, compared with the 2024–25 season (Figures 8a and 8b). White adults had higher flu vaccination coverage than Black, Hispanic, and non-Hispanic adults of other or multiple races. Additionally, Black adults had lower coverage than non-Hispanic adults of other or multiple races. No other differences were observed. Flu vaccination coverage estimates for more detailed racial/ethnic groups (Asian, American Indian/Alaska Native) are provided as a table weblink in the "Additional Flu Vaccination Coverage Estimates" section at the end of the results section.
Flu vaccination coverage among all people ≥6 months during the 2025–26 season was 43.8%, similar to coverage in the 2024–25 season (43.8%; Table 1). Flu vaccination coverage during the 2025–26 season among White people ≥6 months and Black people ≥6 months decreased by 0.8 and 2.2 percentage points, respectively, while coverage among Hispanic people ≥6 months increased 3.4 percentage points, compared with the previous season (Table 1). White people had higher flu vaccination coverage than Black and Hispanic people. Hispanic people had higher coverage than Black people. Additionally, non-Hispanic people of other or multiple races had higher coverage than Black and Hispanic people. No other significant differences were observed.
Table 1. Flu Vaccination Coverage* among All People 6 Months and Older, by Race/Ethnicity, United States, † 2025–26 Season
| Race/Ethnicity‡ | %§ ± 95% CI|| | Difference from the 2024–25 Season ± 95% CI |
|---|---|---|
| Overall | 43.8 ± 0.8 | 0.0 ± 0.9 |
| White only, non-Hispanic | 45.6 ± 0.5 | -0.8 ± 0.7¶ |
| Black only, non-Hispanic | 38.0 ± 1.5 | -2.2 ± 2.0¶ |
| Hispanic | 42.2 ± 2.6 | 3.4 ± 2.9¶ |
| Other or multiple races, non-Hispanic** | 44.7 ± 2.6 | 1.5 ± 3.0 |
*Estimates of the percentage vaccinated are based on interviews conducted September (BRFSS) or October (NIS-Flu) 2025 through June 2026 and reported vaccinations from July 2025 through May 2026.
† Excludes U.S. territories.
‡ Race is self-reported; people of Hispanic ethnicity may be of any race.
§ Percentage vaccinated. Percentages are weighted to the U.S. population. Month of vaccination was imputed for respondents with missing month of vaccination data.
|| Confidence interval (CI) half-widths.
¶ Statistically significant difference between the 2025–26 season and the 2024–25 season by t-test (p<0.05).
** Includes Asian, American Indian/Alaska Native, Native Hawaiian or other Pacific Islander, multiracial, and other races.
Children:
- Flu Vaccination Coverage, by Age Group, Children, United States, 2025–26 Season [XLS - 17 KB]
- Flu Vaccination Coverage by Sex, Children, United States, 2025–26 Season [XLS - 19 KB]
- Flu Vaccination Coverage by Race/Ethnicity and Age Group, Children, United States, 2025–26 Season [XLS - 21 KB]
- Flu Vaccination Coverage for Local Areas and Territories, Children, 2025–26 Season [XLS - 62 KB]
- Flu Vaccination Coverage by MSA, Children, United States, 2025–26 Season [XLS - 19 KB]
- Place of Flu Vaccination by Age Group, Children, United States, 2025–26 Season [XLS - 20 KB]
Adults:
- Flu Vaccination Coverage, by Age Group and High-Risk Status, Adults, United States, 2025–26 Season [XLS - 17 KB]
- Flu Vaccination Coverage by Sex, Adults, United States, 2025–26 Season [XLS - 19 KB]
- Flu Vaccination Coverage by Race/Ethnicity and Age Group, Adults, United States, 2025–26 Season [XLS - 21 KB]
- Flu Vaccination Coverage for Local Areas and Territories, Adults, 2025–26 Season [XLS - 52 KB]
Limitations
Several limitations of the estimates produced from the NIS-Flu and BRFSS surveys should be considered when interpreting the results in this report. First, survey weighting adjustments may not eliminate all the possible bias from incomplete sample frames; both surveys exclude households with no telephones, and NIS-Flu excludes households with only landline telephones. Second, response rates for both surveys were low, and flu vaccination coverage may differ between survey respondents and non-respondents; survey weighting adjustments may not adequately control for these differences. Third, there may be misclassification of flu vaccination status due to recall errors of parents for NIS-Flu and of respondents for BRFSS67. Studies have found that the NIS-Flu overestimated flu vaccination coverage during 2015–2026 by approximately 6–10 percentage points, and that this was largely due to reporting error8910. Fourth, errors from incomplete sample frame, nonresponse, and accuracy of reported flu vaccination status might change over time, leading to inaccurate assessment of trends in flu vaccination coverage. Fifth, the sample from California was limited because data were only collected in California in June 2026, and no data were collected in Mississippi. Sixth, estimates based on the sources in this report have differed from National Health Interview Survey (NHIS) estimates11. NHIS, the data source for evaluating progress toward the Healthy People 2030 flu vaccination coverage objectives, uses a different sampling method than the NIS-Flu and BRFSS, and uses in-person interviews but also relies on self or parental report. A study found that NIS-Flu estimates were generally higher than NHIS estimates over several flu seasons for children11.
The final estimates in this report will differ from the preliminary, in-season estimates on CDC's Weekly Flu Vaccination Dashboard. For adults, the data source for the weekly dashboard is the NIS-Fall Respiratory Virus Module (NIS-FRVM), for which weekly enhanced estimates can be calculated each week by the NIS contractor, and the data source for the reports of final estimates is BRFSS, which has been used since the 2010–11 season. However, the data from BRFSS are not available until August following each season; thus, not allowing in-season routine monitoring of flu vaccination coverage. For adults and children, different analytic approaches were used in this report (Kaplan-Meier) versus the Weekly Dashboard (enhanced estimates). The weekly dashboard estimate for children at the end of April 2026 was 49.3%, whereas the final estimate included in this report is 51.4%; and for adults the dashboard estimate based on NIS-FRVM was 46.5% whereas the final estimate included in this report based on BRFSS is 41.6%. Comparisons of estimates from the different data sources have been reported previously12. CDC continues to assess consistency between flu vaccination coverage estimates from different surveys and other data sources and to evaluate the accuracy of estimates from these data sources.
Discussion
In the United States, flu vaccination coverage during the 2025–26 season was higher for children but similar for adults compared with the 2024–25 season. Prior to 2025–26, flu vaccination coverage had been declining since the onset of the COVID-19 pandemic among children and since the 2021–22 season for adults. During the 2025–26 season, approximately half of children and less than half of adults received a flu vaccination. Before the COVID-19 pandemic, flu vaccination coverage had been slowly increasing. Downturns in coverage began during and after the COVID-19 pandemic. Flu vaccination coverage levels have not rebounded to pre-pandemic levels and remain below the Healthy People 2030 national target of 70% for flu vaccination of persons ≥6 months.
For children, a 2024 study found that 30.9% of U.S. children had a parent hesitant about flu vaccines; by contrast, the percentage with a parent hesitant about vaccines such as measles, polio, and tetanus was 12.2%13. An important study finding was that 25.1% of non-vaccination against flu was attributable to hesitancy, which implies hesitancy may not be the main driver13. The most commonly reported reasons parents have for not vaccinating their child against flu are concern about side effects/safety, belief that the flu vaccine does not work well, and belief that their child is unlikely to get very sick from flu, with <4% reporting cost or access as a reason for non-vaccination14.
While flu vaccination coverage among adults ≥65 years is higher than among adults in other age groups, and had met and exceeded the Healthy People (HP) 2030 goal of 70% during the COVID-19 pandemic (75.2% in the 2020–21 season), coverage among adults ≥65 years has since been steadily decreasing and is now lower than the HP 2030 goal (64.4% vs. 70%). Data from another CDC survey showed that younger adults were more likely to have at least one issue or concern with flu vaccination than adults ≥65 years, with the most commonly reported issue being that they are not worried about getting the flu15. Based on recent publications, small declines have been observed for other adult vaccinations, such as pneumococcal and tetanus vaccines1617.
Annual seasonal flu vaccination is an important way to help reduce the risk of illness and serious complications from flu18. For most people, September and October are ideal times to get vaccinated against flu2. However, flu vaccination should continue throughout the flu season as long as influenza viruses are circulating. To avoid missed opportunities for vaccination, the Standards for Adult Immunization Practice recommend that all providers routinely assess individuals' vaccination status at every clinical encounter, strongly recommend approved vaccinations to their patients, either offer needed vaccines or refer their patients to another provider who can administer the needed vaccines, and document vaccinations received by their patients in an immunization information system19. During the 2025–26 season, 60.9% of adults who reported that their healthcare provider recommended they get a flu vaccine did so, but only 43.7% of adults, and 57.7% of adults ≥65 years, reported that their provider recommended flu vaccination20.
Footnotes
*Estimates from the NIS-Flu for the 2022–23 and 2023–24 seasons were recalculated using the same method for imputation of missing vaccination month as was used for the 2024–25 and 2025–26 seasons so that estimates between seasons would be comparable. Estimates for children for the 2022–23 and 2023–24 seasons in this report may differ slightly from estimates posted on Influenza Vaccination Coverage for Persons 6 Months and Older | FluVaxView | CDC and in reports from those two seasons.
Authors
Katherine E. Kahn, MPH1,2; Anurag Jain, MS1,2; Tianyi Zhou, MPH1,2; Mei-Chuan Hung, PhD1,2; Anup Srivastav, PhD1,2; Peng-Jun Lu, MD, PhD2; Carla L. Black, PhD2
1Eagle Health Analytics, LLC, Atlanta, GA; 2Immunization Services Division, National Center for Immunization and Respiratory Diseases, CDC
This page was last updated on this date. Updates may include minor edits, image changes, or other modifications to page content.
The information on this page was last reviewed by subject matter experts to ensure accuracy.
- CDC. Immunization schedules. 2025; Available from: https://www.cdc.gov/vaccines/hcp/imz-schedules/index.html.
- Grohskopf, L.A., et al., Prevention and control of seasonal influenza with vaccines: recommendations of the Advisory Committee on Immunization Practices - United States, 2025-26 influenza season. MMWR Morb Mortal Wkly Rep, 2025. 74(32): p. 500-507.
- Wolter, K.K., et al., Statistical methodology of the National Immunization Survey, 2005-2014. Vital Health Stat 1, 2017(61): p. 1-107.
- CDC. The BRFSS data user guide. 2013; Available from: https://www.cdc.gov/brfss/data_documentation/pdf/UserguideJune2013.pdf.
- Furlow-Parmley, C., et al., Combining estimates from two surveys: an example from monitoring 2009 influenza A (H1N1) pandemic vaccination. Stat Med, 2012. 31(27): p. 3285-94.
- Brown, C., et al., Validity of parental report of influenza vaccination in young children seeking medical care. Vaccine, 2011. 29(51): p. 9488-92.
- Irving, S.A., et al., Evaluation of self-reported and registry-based influenza vaccination status in a Wisconsin cohort. Vaccine, 2009. 27(47): p. 6546-9.
- Davis, N., et al., Total survey error and the potential overestimation of childhood influenza vaccination in the National Immunization Survey. Journal of Survey Statistics and Methodology, 2026.
- NORC, Total survey error in the NIS-Flu: 2024–25 season final results and 2025–26 season preliminary results. 2026. Unpublished
- Ogokeh, C.E., et al., Comparison of parental report of influenza vaccination to documented records in children hospitalized with acute respiratory illness, 2015-2016. J Pediatric Infect Dis Soc, 2021. 10(4): p. 389-397.
- Santibanez, T.A., et al., Trends in childhood influenza vaccination coverage, United States, 2012-2019. Public Health Rep, 2020. 135(5): p. 640-649.
- CDC. Flu vaccination coverage, United States, 2023–24 influenza season. 2024; Available from: https://www.cdc.gov/fluvaxview/coverage-by-season/2023-2024.html.
- Santibanez, T.A., et al., Parental hesitancy about COVID-19, influenza, HPV, and other childhood vaccines. Vaccine, 2024. 42(25): p. 126139.
- Kahn, K.E., et al., Parental reasons for non-receipt of influenza vaccination among children 6 months-17 years and changes over time, 2015-2024. Vaccine, 2025. 61: p. 127415.
- CDC. Vaccination concerns, issues, and motivators. 2026; Available from: https://www.cdc.gov/respvaxview/dashboards/vaccination-concerns-motivators.html.
- CDC. Vaccination coverage among adults in the United States, National Health Interview Survey, 2022. 2024; Available from: https://www.cdc.gov/adultvaxview/publications-resources/adult-vaccination-coverage-2022.html.
- CDC. AdultVaxView: vaccination coverage among adults. 2024; Available from: https://www.cdc.gov/adultvaxview/about/general-population.html.
- Grohskopf, L.A., et al., Prevention and control of seasonal influenza with vaccines: recommendations of the Advisory Committee on Immunization Practices - United States, 2024-25 influenza season. MMWR Recomm Rep, 2024. 73(5): p. 1-25.
- National Vaccine Advisory Committee, Recommendations from the National Vaccine Advisory Committee: standards for adult immunization practice. Public Health Rep, 2014. 129(2): p. 115-23.
- CDC. Vaccination uptake, intent, and confidence. 2026; Available from: https://www.cdc.gov/respvaxview/dashboards/vaccination-behavioral-social-drivers.html