At a glance
Overview
CDC continues to expect that the U.S. fall and winter respiratory disease season will likely have a similar number of combined peak hospitalizations due to COVID-19, influenza, and RSV compared to last season. CDC's outlook is based on historical trends, expert opinion, and scenario modeling results, in addition to review of current trends. This assessment has not changed since CDC's outlook was initially published on August 25, 2025. Combined peak hospitalization burden depends on the timing as well as the magnitude of each disease peak during the respiratory virus season. There is historic variability in both the timing and magnitude of hospital demand for each of the three diseases.
As of December 19, 2025, the amount of acute respiratory illness causing people to seek healthcare is at a low level. The Respiratory Illnesses Data Channel has weekly updates about current trends in respiratory illness.
- COVID-19 activity is low nationally. As of December 16, COVID-19 infections are growing or likely growing in 31 states.
- Influenza activity continues to increase across the country. As of December 16, influenza infections are growing or likely growing in 47 states.
- Influenza A(H3N2) viruses are the most frequently reported influenza viruses so far this season. A new subclade of influenza A(H3N2) viruses, subclade K, emerged and is the predominant virus among influenza A(H3N2) viruses that have been genetically characterized in the United States and globally.
- As of December 19, approximately 90% of influenza A(H3N2) viruses belong to subclade K, among U.S. samples that CDC has genetically characterized and collected since late September.
- RSV activity is increasing in the Southeastern, Southern, and Mid-Atlantic areas of the country, with emergency department visits and hospitalizations increasing among children 0-4 years old. As of December 16, RSV infections are growing or likely growing in 32 states.
This update to our initial outlook published in August 2025 provides additional information for what could occur during the 2025-2026 season. It is intended to provide decision-makers with information to assist in public health preparedness for respiratory virus illnesses during the 2025-2026 fall and winter respiratory season (defined as October through mid-May). This includes when hospitals might experience the most demand due to COVID-19, influenza, and RSV. CDC will update this outlook every two months or as warranted during the respiratory virus season.
To develop this outlook, we consulted a range of CDC and external experts on COVID-19, influenza, RSV, and infectious disease dynamics to assess what may occur during the 2025-2026 season. Our assessments are based on expert elicitation; historical data for COVID-19, influenza, and RSV; and scenario modeling conducted by the Center for Forecasting and Outbreak Analytics (CFA) and the Flu Scenario Modeling Hub.
COVID-19 outlook
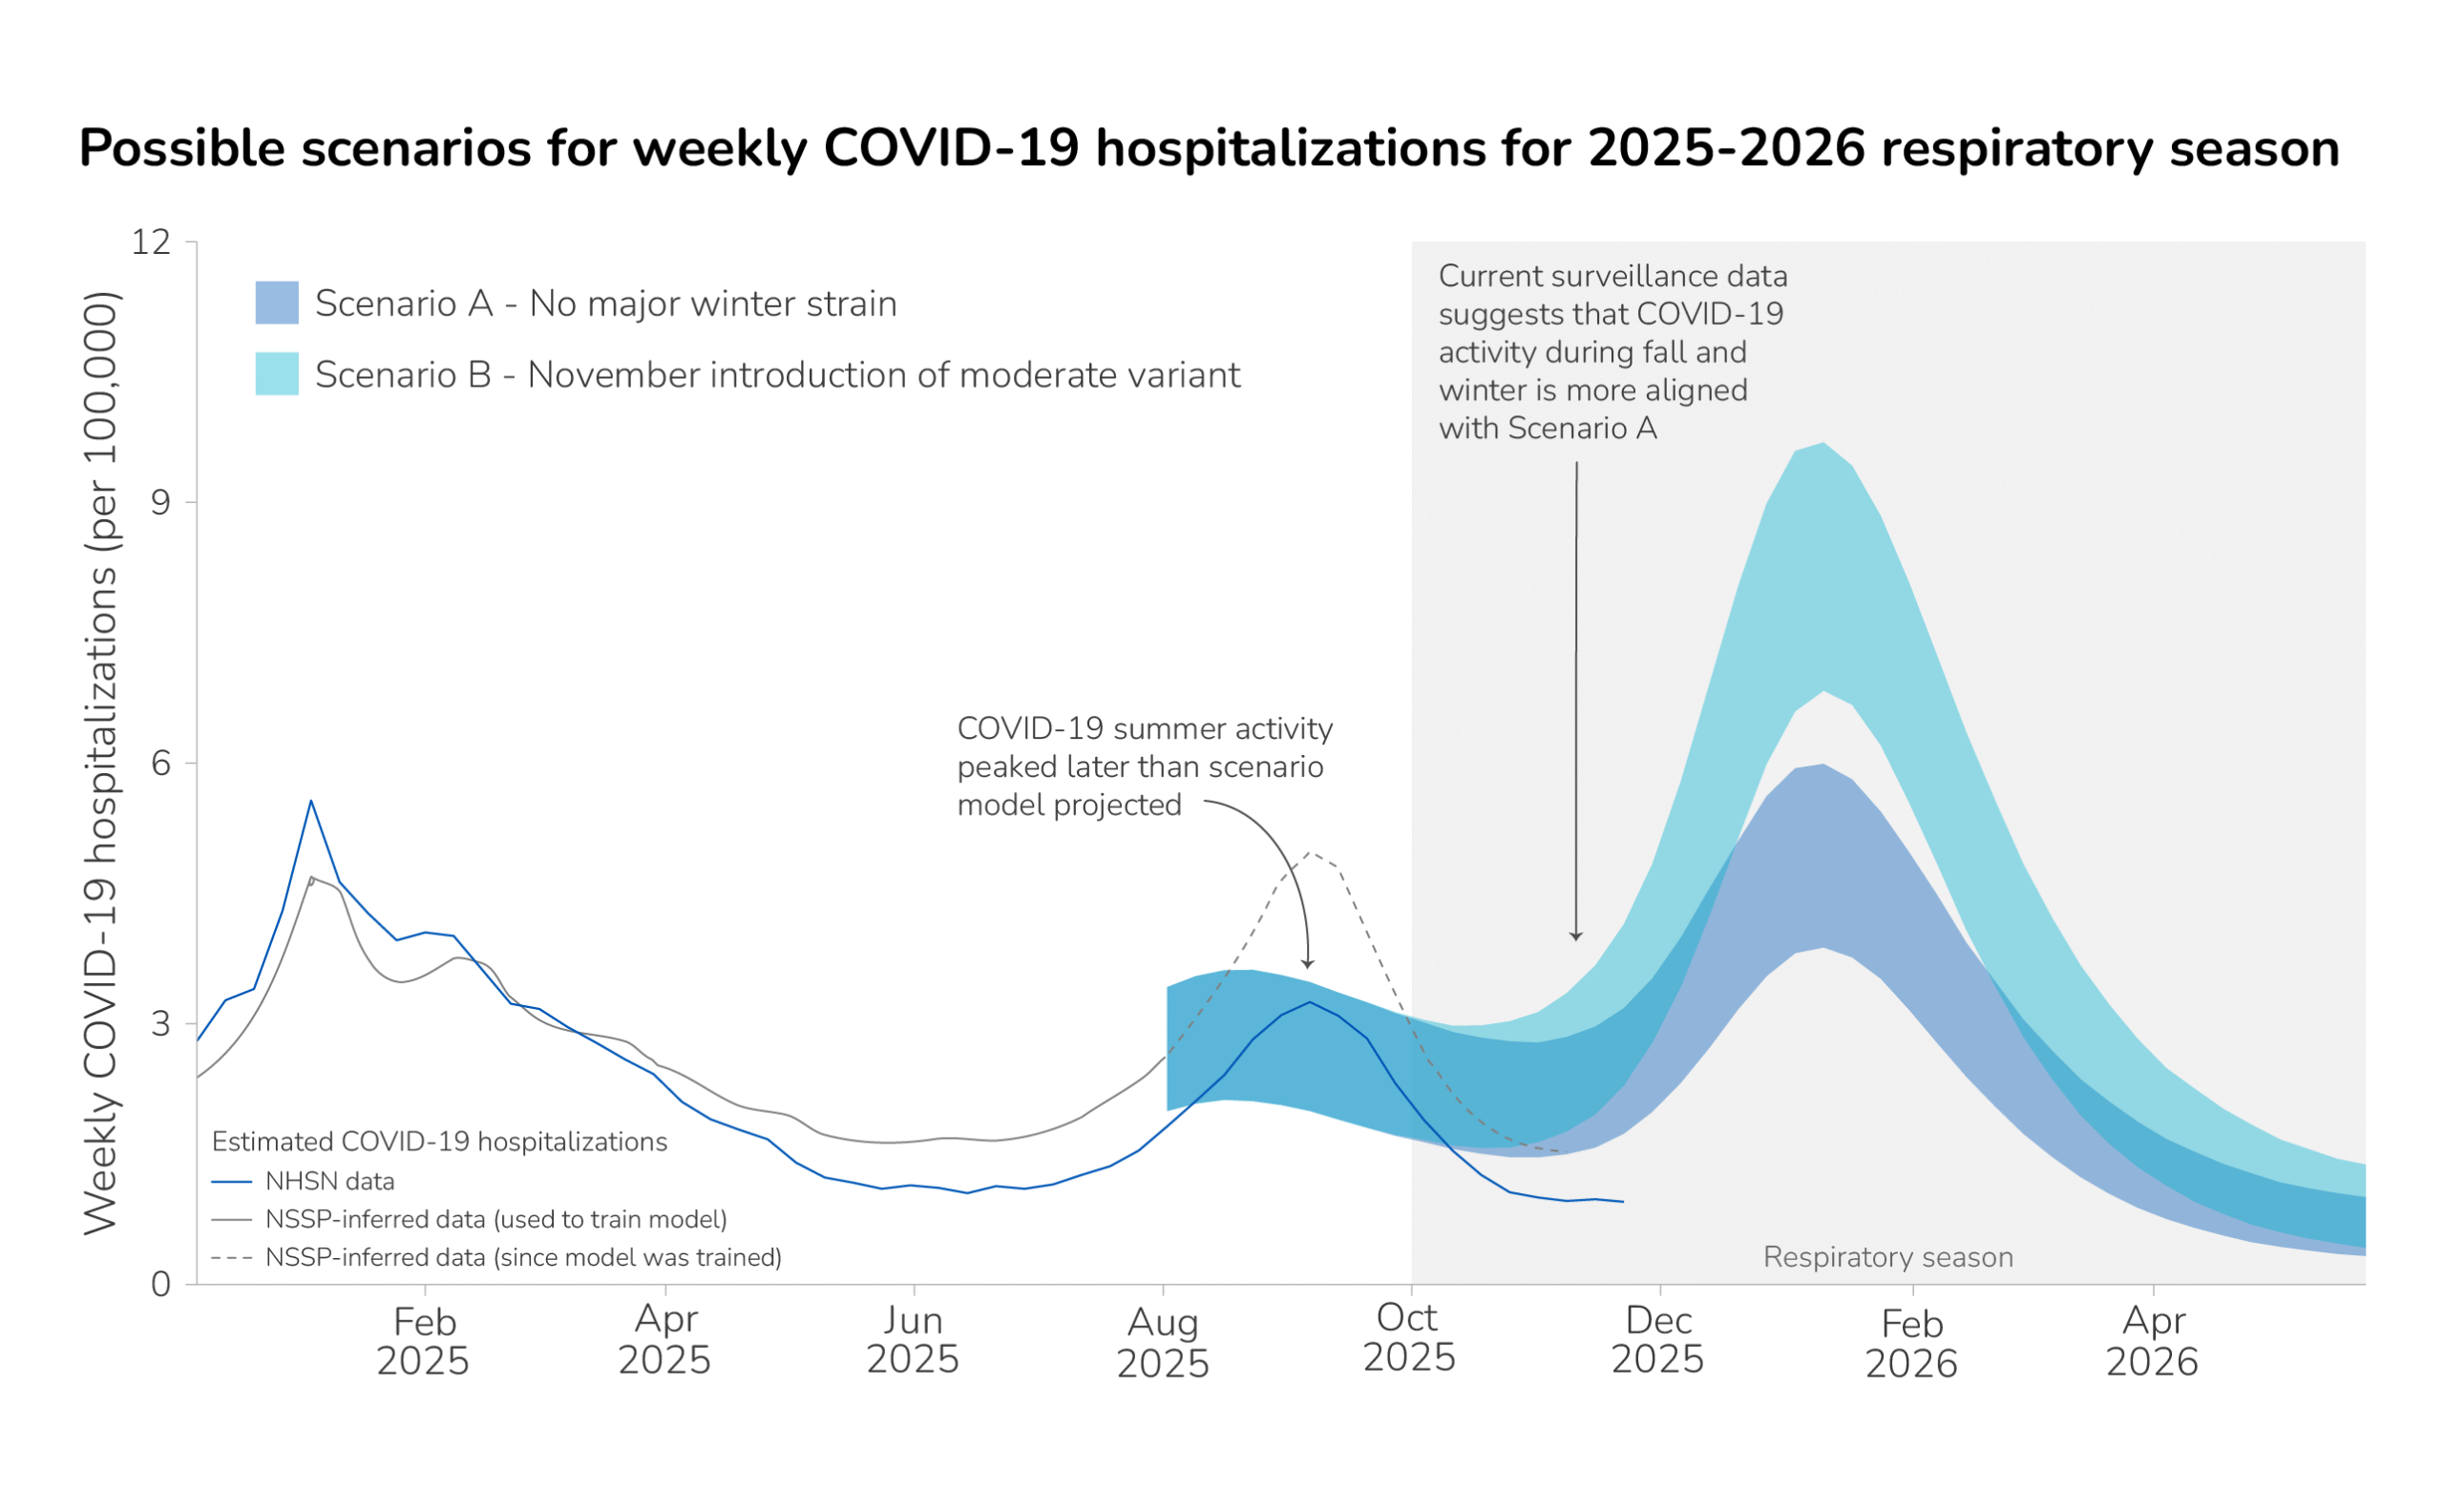
CDC expects that the peak weekly hospitalization rate due to COVID-19 for the 2025-2026 season will be similar to that of the 2024-2025 season, with moderate confidence; this assessment is based on historical trends, expert opinion, scenario modeling results, and recent data trends. This is updated from our initial 2025-2026 outlook, published on August 25, in which we assessed that the peak weekly hospitalization rate due to COVID-19 for the 2025-2026 season could be higher than that of the 2024-2025 season if a variant with moderate immune-escape properties emerged in November. As of December 19, 2025, no new variants with moderate immune-escape properties have been detected in clinical surveillance; however, there have been increasing detections of a divergent lineage, BA.3.2, throughout the fall internationally, and recently in U.S. wastewater samples. BA.3.2 has displayed moderate immune-escape properties. It remains possible that BA.3.2, one of its descendants, or another variant with moderate immune-escape properties could replace JN.1 lineage viruses, which have been predominant for two years, resulting in a higher peak weekly hospitalization rate this season compared to last season.
COVID-19 summer activity peaked in the week ending September 6, 2025. Surveillance data indicates that COVID-19 summer activity occurred later than our scenario model initially projected (Figure 1). COVID-19 hospitalization data availability has changed over time, and the magnitude of the summer peak varies among data sources.A While the precise magnitude of the COVID-19 summer wave varies by data source, recent surveillance data suggests that the COVID-19 fall and winter season is more closely aligned with the lower winter peak in Scenario A in our initial outlook, with no major winter strain emerging. See our scenario modeling methods section below for more information.
Regardless of the exact trajectory, vaccination is expected to play a critical role in preventing hospitalizations due to COVID-19 this season, particularly among older age groups. As of December 6, 15.3% of adults 18 years or older have received the updated 2025-2026 COVID-19 vaccine. While this percentage is expected to increase as the season progresses, it is lower than this time last year (19.2%, as of December 7, 2024).
Influenza outlook
CDC expects that the severity of the 2025-2026 influenza season will most likely be classified as moderate across all ages, with low confidence, based on historical trends, expert opinion, and recent surveillance data trends. Our confidence in this assessment is low, downgraded from moderate confidence in our initial influenza outlook, due to uncertainties in the potential impact of circulating influenza viruses on U.S. population immunity and vaccine effectiveness. As of December 16, epidemic trend estimates indicate that influenza infections are growing or likely growing in 47 states and the timing of this increase in activity is similar to several past seasons.
Influenza seasons vary widely in number of illnesses, hospitalizations, and deaths, depending on the subtypes circulating, population immunity, and vaccine effectiveness against circulating influenza viruses. A new influenza A(H3N2) virus subclade recently renamed "subclade K" is the predominant virus among influenza A(H3N2) viruses that have been genetically characterized to date this fall in the United States and other countries, including the UK and Canada. CDC first identified Subclade K in the United States in August 2025, and as of December 19, approximately 90% of influenza A(H3N2) viruses that CDC has genetically characterized from U.S. samples collected since September 28 were identified as subclade K. Influenza viruses in this subclade have differences from other circulating influenza viruses including the virus selected as the A(H3N2) component of the U.S. 2025-26 seasonal influenza vaccines.
In our initial outlook, we assessed that a more severe 2025-2026 influenza season could occur if an influenza subtype with more severe outcomes, either through higher clinical severity or higher numbers of infections, predominates. The emergence of subclade K could lead to a more severe 2025-2026 influenza season. However, the impact of the emergence of subclade K on the timing and severity of the 2025-2026 influenza season is unclear. Individual and population-level immunity to subclade K influenza viruses might be low and annual influenza vaccine effectiveness might be reduced. In addition, seasons that are H3N2 predominant (the same virus type as subclade K) have been associated with more influenza-associated hospitalizations and deaths in people 65 years and older and in young children compared to other age groups. However, it is too early in the season to predict which influenza viruses will be most common and in what proportion and what the vaccine effectiveness will be against circulating influenza viruses.
Vaccination is still expected to play a key role in preventing illnesses, medical visits, hospitalizations, and deaths due to influenza this season. Recent findings from a study in England, conducted during a period with significant influenza A(H3N2) subclade K activity, demonstrated that the 2025-2026 vaccine remained effective at reducing emergency department visits and hospital admissions; results indicated that the vaccine was 72 to 75% effective at reducing emergency department visits and hospital admissions in people less than 18 years old and 32 to 39% effective in people aged 18 years or older. Recent results from the Scenario Modeling Hub estimate that 39% (28%-50%) of influenza-related hospitalizations could be prevented, compared to a scenario with no vaccination, assuming vaccination occurs at the same rate as that of last year. Modeling for these results occurred before the emergence of subclade K; however, modelers assumed a vaccine effectiveness value (50%) that is within the range of the observed vaccine effectiveness values in the aforementioned study in England.
In the United States, as of December 6, 41.9% of adults 18 years or older have received the updated 2025-2026 influenza vaccine, compared to 39.4% of adults 18 years or older who received the 2024-2025 seasonal influenza vaccine at the same time last year (December 7, 2024). CDC's influenza vaccine effectiveness networks are collecting real-world data to produce early estimates of vaccine effectiveness in the United States.
RSV outlook
CDC expects that the 2025-2026 peak weekly hospitalization rate across all age groups due to RSV will be similar to that of the 2024-2025 season, with moderate confidence. Within-season survey data suggests that infant immunization product uptake is higher than last year at this time, and eligibility has expanded for higher-risk adults, both of which could decrease peak hospitalization rates. This assessment is based on historical trends, expert opinion, and recent surveillance data trends.
RSV immunization products will continue to play a key role in reducing RSV-associated hospitalization burden this season across eligible ages. To estimate the role of these products in preventing RSV hospitalizations in the coming season, experts considered both effectiveness and uptake for RSV infant immunization (nirsevimab or clerosvimab), maternal RSV vaccination, and adult RSV vaccination.
RSV immunization recommendations for infants and young children have not changed since the 2024-2025 season, although an additional infant monoclonal antibody (clesrovimab) became available in June 2025. Protection through either maternal vaccination or long-lasting monoclonal antibodies is recommended for all infants. CDC modeling indicates that 48% of RSV hospitalizations in infants 0-1 years old could be prevented if uptake of both infant immunization and maternal vaccination are similar to last year. This is based on experts' estimates of RSV immunization effectiveness (88%) and maternal RSV vaccination effectiveness (51%). So far, in 2025, it appears uptake may be higher compared to this time in 2024: as of October 2025, among females with an infant born since April 1, 39.6% of infants were reported to be protected against RSV through either maternal vaccination (3.3%) or receipt of monoclonal antibody (36.3%), compared to 30.1% of infants protected in October of last year.
RSV vaccination eligibility has expanded this year to include more high-risk adults. RSV vaccines are now recommended for all adults age 75 and older, and adults age 50 and older who are at high risk for severe RSV disease due to certain underlying medical or immunocompromising conditions. CDC modeling indicates that 17% of RSV hospitalizations in all adults over 50 years could be prevented if vaccine coverage remains similar to coverage in the 2024-2025 season compared to a scenario in which no adults were ever vaccinated. Among adults 75+, the same modeling shows vaccination could avert 23% of all hospitalizations due to RSV. As of December 6, 41.2% of adults 75 years or older have received the RSV vaccine since it was first available during the 2023-2024 respiratory virus season, while an additional 9.2% indicate that they definitely will receive the RSV vaccine this year. This is similar to rates last year, when 40.5% of adults 75 years or older reported that they had ever received the RSV vaccine, as of November 23, 2024.
For more information on our methods to estimate the effect that RSV immunization could have on preventing hospital admissions in the coming fall and winter respiratory season, see our Projected Averted Burden Methods below.
Key methods
This outlook is based on expert opinion and historical data for COVID-19, influenza, and RSV with the addition of scenario modeling for COVID-19. In this update, we also consider the latest trends and surveillance data. We have low to moderate combined confidence in our assessment, based on information availability and information gaps and assumptions.
This respiratory outlook incorporates expert opinion from 20 subject-matter experts specializing in COVID-19, influenza, and RSV epidemiology, infectious disease modeling, disease surveillance, and risk assessment methods. In partnership with Metaculus, CDC designed a questionnaire and expert elicitation process for soliciting views from experts on the upcoming fall and winter respiratory season. Experts each answered a series of questions on the expected hospitalization burden posed by each disease, as well as on key drivers for a season with a higher peak hospitalization rate. Experts assigned uncertainty levels to their answers as a way of reflecting their uncertainty in their response. The results were used to inform our initial outlook and as inputs into scenario modeling. See our expert elicitation methods for further information on this process.
Scenario modeling explores longer-term hypothetical outcomes under different assumptions about the future. Our COVID-19 scenario modeling utilizes a transmission model with a compartmental modeling structure that takes into account population age structure, infection history, vaccination history, immunity waning status, and infecting strain. Immunity is determined by immunogenic events (infections and vaccinations) and time since the most recent event. Protection against infection is strain-specific: past infection with a more similar variant, or vaccination with a better-matched vaccine, provides a higher level of protection against the challenging strain. The model uses mathematical equations to describe how groups move between compartments (e.g., from uninfected to infected, or from unvaccinated to vaccinated). See our Behind the Model to learn more about how scenario modeling can be used to inform decision-making.
Both scenarios presented here assume that only people over the age of 65 and those with underlying health conditions will receive a COVID-19 vaccine in the 2025-2026 season. In the model, the 65+ age group receives vaccines at the same rate as in 2024-2025. A proportion of 18- to 64-year-olds equivalent to the proportion of the population with relevant underlying conditions ("high risk" groups) also receive vaccination at the same rate as in 2024-2025. We also assume vaccine effectiveness is the same as in 2024-2025.
The two sets of projections shown consider different possible emergence scenarios for COVID-19 variants. In Scenario A, it is assumed that no variant will emerge that significantly evades the population's immunity. In Scenario B, a variant with moderate immune escape properties emerges in November. Under this scenario, people in the model experience a small risk of exposure to the new variant that increases gradually over two weeks, peaks on November 1, and then decreases over two weeks. We assume that this variant has similar properties to the variants that were dominant during the summer 2024 and winter 2024-2025 waves.
To project the proportion of RSV hospitalizations that may be averted through immunization, we use a modeling approach that allows for estimating the effect that available RSV prevention products (infant immunization, maternal vaccination, and adult vaccination) could have on hospitalizations in this coming respiratory season. This approach is similar to ones that have been used by CDC to retrospectively estimate flu and COVID-19 hospitalizations prevented by vaccination (Reed et al. EID 2009; Steele et al., 2022, Tokars et al., 2018, Rolfes et al., 2019, Wiegand et al., 2025).
The model assumes that immunization protects a proportion of those who have been immunized against severe outcomes but does not prevent disease transmission. Although this simplification may slightly underestimate the value of immunization, it uses fewer parameters and requires fewer data inputs than the dynamic transmission models described above.
Projecting hospitalizations averted among infants
In estimating the projected hospitalizations averted among young children, we look only at hospitalizations among infants under 12 months because RSV infant immunization is provided primarily to infants under 8 months old during the RSV season and maternal vaccination only protects infants. To develop a baseline projection of next season's burden, we used RSV hospitalization data from last season (2024-2025) for infants (children less than 1 year old), adjusting for the fact that not everyone hospitalized because of RSV has received a positive test. We then divided infants into weekly birth cohorts and inferred weekly rates of hospitalization in the 2024-2025 season in the absence of immunization or maternal vaccination, accounting for age-varying hospitalization risk and last season's time-varying immunization coverage. Next, we predict the number of hospitalizations that could be averted in 2025-2026 by considering, for each calendar week and birth cohort, the number of hospitalizations in the absence of immunization, the expected coverage of each immunization product, and the expected effectiveness of each immunization product. The proportion averted is the proportion of individuals effectively protected by any of the products they received. Expected immunization coverage and effectiveness point estimates were generated in the expert elicitation process.
Projecting hospitalizations averted among adults
To estimate the projected hospitalizations averted among adults, we follow the same steps among eligible adult age groups. Expected immunization coverage and effectiveness point estimates were generated in the expert elicitation process. Coverage among high-risk 50- to 59-year-olds, who are newly eligible this year, is assumed to be 25% lower than among high-risk adults in the 60- to 74-year-old age group. Because the RSV vaccine is only recommended once, rather than annually, this modeling accounts for waning efficacy over time.
- In our initial outlook, the COVID-19 scenario model was calibrated using hospitalizations inferred from emergency department data from the National Syndromic Surveillance System. However, in recent months, our method of inferring hospitalizations from emergency department visits (gray line, Figure 1) may no longer accurately reflect hospitalizations reported through the National Healthcare Safety Network (blue line, Figure 1). When the model is re-calibrated to NHSN data, fall and winter scenario projections do not change substantially (unpublished data).