FIGURE. Percentage of adults aged ≥18 years who were current smokers,* by sex and race/ethnicity --- National Health Interview Survey (NHIS), United States, 1965--2008†
Persons using assistive technology might not be able to fully access information in this file. For assistance, please send e-mail to: mmwrq@cdc.gov. Type 508 Accommodation and the title of the report in the subject line of e-mail.
Cigarette Smoking --- United States, 1965--2008
Cigarette smoking remains the leading cause of preventable morbidity and mortality in the United States, resulting in an estimated 443,000 premature deaths and $193 billion in direct health-care expenditures and productivity losses each year (1). The prevalence of cigarette smoking among youth and adult smokers has declined, but that decline has stalled during the past 5 years among adults (2,3). Despite overall declines in cigarette smoking, disparities in smoking and other tobacco use still persist among certain racial/ethnic minority groups, particularly among American Indians/Alaska Natives (AI/ANs) (4). In addition to racial/ethnic disparities in cigarette smoking, other groups have higher prevalence of cigarette smoking, with higher use reported among persons with low socioeconomic status; persons with histories of mental health and substance abuse conditions; the lesbian, gay, bisexual, and transgender community; and persons living in the South and Midwest regions of the United States (5--7).
Each day in the United States, approximately 3,900 persons aged 12--17 years smoke their first cigarette, and an estimated 1,000 adolescents become daily cigarette smokers (8). The vast majority of persons who begin smoking during adolescence are addicted to nicotine by age 20 (9). Among youth, factors associated with smoking include low socioeconomic status, low academic achievement (e.g., poor grades and absenteeism), high-risk sexual behavior, and use of alcohol and other drugs (9,10). As with adult smoking, racial/ethnic differences in cigarette smoking exist among youth smokers, with AI/ANs having the highest prevalence of cigarette smoking, particularly among females. In comparison, youth smoking among black females has consistently been lower and has declined during past years. These declines have contributed to the overall lower prevalence of cigarette smoking among black youth smokers (2).
Although multiple tobacco-related disparities exist, this report highlights only racial/ethnic and socioeconomic disparities because of limited data for other demographic groups. To highlight racial/ethnic and socioeconomic disparities in current cigarette smoking among youths and adults, CDC analyzed aggregated data from the National Survey on Drug Use and Health (NSDUH) for 2006--2008. NSDUH is sponsored by the Substance Abuse and Mental Health Services Administration (SAMHSA) and is designed to provide annual information about alcohol, tobacco, and illegal drug use among the noninstitutionalized U.S. household population aged ≥12 years. Specifically, NSDUH findings highlight racial/ethnic disparities in cigarette smoking among youths aged 12--17 years and adults aged ≥18 years as well as disparities in cigarette smoking among persons with low socioeconomic status in the United States. For the purposes of this report, adults who have lower levels of educational attainment, who are unemployed, or who live at, near, or below the U.S. federal poverty level are considered to have low socioeconomic status.
To measure declines in smoking among non-Hispanic white men and women and non-Hispanic black men and women aged ≥18 years, as well as the declining disparities among these populations since the 1964 Surgeon General's report on smoking and health (11), CDC analyzed public use data files from the National Health Interview Survey (NHIS) for 1965--2008 (Figure). Similar data are unavailable from NSDUH before 2002. Because NHIS does not collect data on tobacco use by youth, NSDUH is the primary data source for this report.
Population-weighted prevalence estimates with 95% confidence intervals were calculated using statistical software to account for the multistage probability designs of the NSDUH and NHIS. Statistical significance (p<0.05) was determined by use of two-sided t-tests. To explain population characteristics of unemployed smokers, logistic regression analysis was performed that adjusted for age, race/ethnicity, educational attainment, and sex.
The average response rate from the 2006--2008 NSDUH was 74.1%. The youth and adult sample sizes for the aggregated 2006--2008 data file were 53,883 and 112,570, respectively. For youths and adults, the term "current smoker" included persons who had smoked at least one cigarette during the 30 days before the survey.
NHIS is administered annually by CDC's National Center for Health Statistics and is the principal source of information on the health of the civilian, noninstitutionalized, household population of the United States. For NHIS survey years 1965--1991, current smokers included adults who reported smoking ≥100 cigarettes during their lifetimes and who were current smokers. Since 1992, current smokers were adults who reported smoking ≥100 cigarettes during their lifetimes and who specified that they currently smoked every day or on some days.
Data from the 2006--2008 NSDUH indicate that among youths aged 12--17 years, smoking was highest for AI/AN females (17.8%), AI/AN males (16.7%), non-Hispanic white females (12.4%), and non-Hispanic white males (11.3%) (Table 1). Smoking was lowest for Asian* females (2.9%), Asian males (5.2%), non-Hispanic black females (5.6%), and non-Hispanic black males (6.1%). Declining trends in smoking were observed for male and female youths of all racial/ethnic backgrounds, but AI/AN youths had the sharpest declines from 2002--2003 to 2007--2008, followed by non-Hispanic white youths. Smoking among non-Hispanic black youths, although low, neither increased nor decreased from 2002--2003 to 2007--2008.
NHIS data for 1965--2008 indicate declines in smoking among both male and female non-Hispanic white and non-Hispanic black adult smokers aged ≥18 years (Figure). Although the disparity in smoking between non-Hispanic black men and non-Hispanic white men has diminished substantially, non-Hispanic black men smoked at slightly higher rates than non-Hispanic white men during 2008 (25.6% versus 23.5%, respectively; p<0.001). The disparity in smoking between non-Hispanic black women and non-Hispanic white women has demonstrated a reversal for longer than a decade, with non-Hispanic black women smoking at statistically significant lower rates than non-Hispanic white women during 2008 (17.8% versus 20.6% respectively; p<0.001).
Data from the 2006--2008 NSDUH indicate that among adults aged ≥18 years, AI/AN men (42.4%) and AI/AN women (42.0%) had the highest smoking prevalence, followed by non-Hispanic black men (33.7%) and non-Hispanic white men (28.8%) (Table 2). Smoking was lowest for both Asian women (8.8%) and Hispanic women (16.5%). Smoking increased for AI/AN men and women, but Asian men experienced the steepest declines in smoking from 2002--2003 to 2007--2008. Persons aged 26--34 years and 35--49 years had the highest smoking rates (37.8% and 33.7%, respectively), whereas persons aged ≥65 years had the lowest rate of smoking (9.4%) (Table 2). Persons whose household incomes were below the federal poverty thresholds (36.5%) or were at or near the thresholds (32.8%) had much higher prevalence of smoking, compared with persons whose household incomes were above established poverty levels (22.5%) (Table 2). Smoking decreased with increasing levels of educational attainment, with college graduates having the lowest prevalence of smoking (13.3%). Those having less than a high school education or only a high school diploma had the highest prevalence of smoking (32.0% and 29.3%, respectively). (Table 2).
Persons who were unemployed also had a high prevalence of smoking (Table 2). From aggregated data for 2006--2008, smoking prevalence among unemployed persons (44.7%) was much higher compared with persons who were employed full-time (27.8%). Unemployed persons were most likely to be aged 35--49 or 50--64 years (adjusted odds ratio [aOR]: 11.40 and 7.43, respectively), have not completed high school (aOR: 1.92), be AI/AN (aOR: 4.48) or non-Hispanic black (aOR: 2.21).
The data presented in this report are subject to at least six limitations. First, data were based on self-reports and were not validated biochemically. However, studies have indicated that self-reported smoking status is validated by measured serum cotinine levels, which yield similar prevalence estimates (12). Second, the NHIS questionnaire is administered only in English and Spanish; therefore, estimates for certain racial/ethnic populations might be underestimated if neither English nor Spanish is the primary language spoken. Moreover, race/ethnicity was not adjusted for by socioeconomic status. Third, because NHIS and NSDUH do not include institutionalized populations and persons in the military, these results might not be generalizable to these groups. Fourth, because the definition of current smoking for adults differed between NHIS and NSDUH, more nondaily smokers were identified in NSDUH, leading to higher prevalence estimates reported for that survey (13). Fifth, although smoking prevalence was determined to be lowest among Asian and Hispanic women, variations in smoking prevalence have been observed with specific Asian and Hispanic groups (e.g., Korean and Vietnamese men and Puerto Rican men and women) (14). Finally, because of limited sample sizes for certain population groups in both NSDUH and NHIS (e.g., AI/ANs), single-year estimates might have resulted in imprecise estimates.
Comprehensive tobacco-control strategies that include population-based policies have been demonstrated to be effective in decreasing smoking behavior among the general population (15). Implementation of these policy strategies should be adapted to address tobacco-related disparities among specific populations (16). These strategies include increasing populations covered by comprehensive smoke-free policies, including all workplaces, restaurants, and bars; increasing the price of tobacco products, coupled with evidence-based cessation services; reducing exposure to industry-targeted advertising, promotions, and sponsorship; and increasing the availability, accessibility, and effectiveness of tailored cessation services for populations affected by tobacco-related disparities (17--19).
The findings in this report indicate that although progress has been achieved in reducing disparities in cigarette use among certain racial/ethnic groups, less progress has been made in reducing disparities in cigarette use among persons of low socioeconomic status. Even though low socioeconomic status is a powerful determinant of smoking behavior (20), no single factor determines patterns of cigarette smoking and other tobacco use among vulnerable populations; rather, these are the result of complex interactions of multiple factors (e.g., socioeconomic status, cultural characteristics, acculturation, stress, biologic elements, targeted advertising, price of tobacco products, and varying capacities of communities to mount effective tobacco-control initiatives) (4). Consequently, enhanced surveillance efforts are needed to increase understanding of the patterns, social determinants, and existing gaps in cigarette smoking among groups disproportionately affected by this risk behavior. This level of monitoring will be necessary to increase the effectiveness of existing public health strategies and for development of tailored interventions to reduce tobacco-related disparities.
Tobacco-control efforts focused on preventing cigarette and other tobacco use among youths, especially those at risk, are critical in eliminating future tobacco-related disparities. The data provided in this report indicate that during 2002--2008, adults aged ≥26 years with less than a high school education had very high prevalence of smoking. Because the majority of established adult smokers begin smoking during their adolescence (9), dropping out of high school is a risk factor for smoking. These findings indicate that efforts to reduce future disparities among adults in smoking associated with lower education and other socioeconomic factors should take a lifespan approach. Therefore, continuing population-based strategies that are effective in youth tobacco use prevention (e.g., price increases and tobacco counter-advertisements) should be coordinated with other community-level policies and programs. A coordinated and comprehensive approach is needed to prevent the onset of tobacco use early in the lifespan such that the adult disparities observed with tobacco use can be eliminated.
References
- CDC. Smoking-attributable mortality, years of potential life lost, and productivity losses---United States, 2000--2004. MMWR 2008;57:1226--8.
- CDC. Cigarette use among high school students---United States, 1991--2009. MMWR 2010;59:797--801.
- CDC. Early release of selected estimates based on data from the 2009 National Health Interview Survey: current smoking. Hyattsville, MD: US Department of Health and Human Services, CDC, National Center for Health Statistics; 2010. Available from http://www.cdc.gov/nchs/data/nhis/earlyrelease/201006_08.pdf.
- US Department of Health and Human Services, Office of the Surgeon General. Tobacco use among U.S. ethnic/racial and minority groups---African Americans, American Indians and Alaska Natives, Asian Americans and Pacific Islanders, and Hispanics: a report of the Surgeon General. Atlanta, GA: US Department of Health and Human Services, CDC; 1998. Available at http://profiles.nlm.nih.gov/NN/B/B/F/Q.
- Trosclair A, Dube SR. Smoking among adults reporting lifetime depression, anxiety, anxiety with depression, and major depressive episode, United States, 2005--2006. Addict Behav 2010;35:438--43.
- Lee JGL, Griffin GK, Melvin CL. Tobacco use among sexual minorities in the USA, 1987 to May 2007: a systematic review. Tob Control 2009;18:275--82.
- CDC. Federal and state cigarette excise taxes---United States, 1995--2009. MMWR 2009;58:524--7.
- Substance Abuse and Mental Health Services Administration. A day in the life of American adolescents: substance use facts update. Rockville, MD: Substance Abuse and Mental Health Services Administration; 2010. Available at http://www.oas.samhsa.gov/2k10/185/185TypicalDay.cfm.
- US Department of Health and Human Services, Office of the Surgeon General. Preventing tobacco use among young people: a report of the Surgeon General. Atlanta, GA: US Department of Health and Human Services, CDC; 1994. Available at http://www.cdc.gov/tobacco/data_statistics/sgr/1994/index.htm.
- US Department of Health and Human Services, Office of the Surgeon General. Reducing tobacco use: a report of the Surgeon General. Atlanta, GA: US Department of Health and Human Services, CDC; 2000. Available at http://www.surgeongeneral.gov/library/tobacco_use/index.html.
- US Department of Health, Education, and Welfare, Public Health Service. Smoking and health: report of the advisory committee to the Surgeon General of the Public Health Service. Washington, DC: US Department of Health Education and Welfare, Public Health Service; 1964. Available at http://profiles.nlm.nih.gov/NN/B/B/M/Q/_/nnbbmq.pdf.
- Caraballo RS, Giovino GA, Pechacek TF, Mowery PD. Factors associated with discrepancies between self-reports on cigarette smoking and measured serum cotinine levels among persons aged 17 years or older: Third National Health and Nutrition Examination Survey, 1988--1994. Am J Epidemiol 2001;153:807--14.
- Rodu B, Cole P. Smoking prevalence: a comparison of two American surveys. Public Health 2009;123:598--601.
- Caraballo RS, Yee SL, Gfroerer J, Mirza SA. Adult tobacco use among racial and ethnic groups living in the United States, 2002--2005. Prev Chronic Dis 2008;5:A78 (Epub ahead of print).
- Bonnie RJ, Stratton K, Wallace RB, eds. Ending the tobacco problem: a blueprint for the nation. Washington, DC: The National Academies Press; 2007.
- US Department of Health and Human Services. Healthy people 2010: understanding and improving health. 2nd ed. 2 vols. Washington, DC: US Government Printing Office; 2000. Available at http://www.healthypeople.gov.
- CDC. Best practices user guide: pursuing health equity---state and community interventions. Atlanta, GA: US Department of Health and Human Services, CDC; 2011. In press.
- CDC. Best practices for comprehensive tobacco control programs. Atlanta, GA: US Department of Health and Human Services, CDC; 2007. Available at http://www.cdc.gov/tobacco/tobacco_control_programs/stateandcommunity/best_practices.
- Task Force on Community Preventive Services. Guide to community preventive services. Available at http://www.thecommunityguide.org.
- CDC. Vital signs: current cigarette smoking among adults aged ≥18 years---United States, 2009. MMWR 2010; 59: 1135--40.
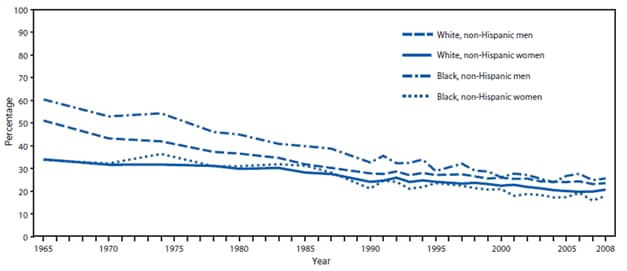
* For NHIS survey years 1965--1991, current smokers included adults who reported that they had smoked ≥100 cigarettes in their lifetime and current smoking. Since 1992, current smokers included adults who reported smoking ≥100 cigarettes during their lifetime and specified that they currently smoked every day or on some days.
† Figure depicts trend over time; data not available for certain years because questions regarding smoking were not included in NHIS for 1967--1969, 1971--1973, 1975,1981, 1982, 1984, 1986, 1989, and 1996.
Alternate Text: The figure depicts the percentage of adults aged ≥18 years who were current smokers during 1965-2008, by sex and race/ethnicity. For NHIS survey years 1965-1991, current smokers included adults who reported that they had smoked ≥100 cigarettes in their lifetime and current smoking. Since 1992, current smokers included adults who reported smoking ≥100 cigarettes during their lifetime and specified that they currently smoked every day or on some days. The figure depicts trend over time; data not available for certain years because questions regarding smoking were not included in NHIS for 1967-1969, 1971-1973, 1975,1981, 1982, 1984, 1986, 1989, and 1996.
|
TABLE 1. Current smoking* among youths aged 12--17 years, by selected characteristics --- National Survey on Drug Use and Health, United States, 2006--2008 |
||||||
|---|---|---|---|---|---|---|
|
Characteristic |
Males (n = 2,909) |
Females (n = 2,753) |
Total (n = 5,662) |
|||
|
% |
(95% CI) |
% |
(95% CI) |
% |
(95% CI) |
|
|
Race/Ethnicity |
||||||
|
White, non-Hispanic |
11.3 |
(10.7--12.0) |
12.4 |
(11.7--13.0) |
11.8 |
(11.4--12.3) |
|
Black, non-Hispanic |
6.1 |
(5.2--7.1) |
5.6 |
(4.7--6.5) |
5.9 |
(5.2--6.5) |
|
Hispanic |
8.2 |
(7.1--9.3) |
6.7 |
(5.6--7.7) |
7.4 |
(6.7--8.2) |
|
American Indian/Alaska Native |
16.7 |
(9.8--23.5) |
17.8 |
(11.6--24.0) |
17.2 |
(13.2--21.2) |
|
Asian† |
5.2 |
(3.5--7.0) |
2.9 |
(1.5--4.3) |
4.1 |
(3.0--5.3) |
|
Grade in school |
||||||
|
7 |
4.1 |
(3.1--5.0) |
5.3 |
(4.2--6.5) |
4.7 |
(3.9--5.4) |
|
8 |
8.4 |
(7.3--9.4) |
8.2 |
(7.2--9.3) |
8.3 |
(7.6--9.0) |
|
9 |
12.7 |
(11.4--13.9) |
12.9 |
(11.6--14.1) |
12.8 |
(11.9--13.6) |
|
10 |
17.3 |
(15.6--18.9) |
16.7 |
(15.2--18.1) |
17.0 |
(15.9--18.0) |
|
11 |
20.4 |
(18.3--22.5) |
18.3 |
(16.0--20.6) |
19.3 |
(17.7--21.0) |
|
12 |
28.9 |
(21.2--36.7) |
18.1 |
(12.8--23.5) |
22.8 |
(18.5--27.1) |
|
Poverty status§ |
||||||
|
<100% (below threshold) |
10.2 |
(8.9--11.5) |
10.5 |
(9.4--11.6) |
10.4 |
(9.4--11.3) |
|
100%--199% (at or near threshold) |
10.8 |
(9.7--11.9) |
10.7 |
(9.6--11.8) |
10.7 |
(10.0--11.5) |
|
≥200% (above threshold) |
9.2 |
(8.6--9.8) |
9.5 |
(8.9--10.1) |
9.3 |
(8.9--9.7) |
|
Abbreviation: CI = confidence interval. * Current smokers include all persons who smoked at least one cigarette during the 30 days before the survey. † Does not include Native Hawaiians or Pacific Islanders. § Percentage of U.S. federal poverty level, on the basis of self-reported family income or imputed family income and U.S. Census Bureau poverty thresholds, 2005--2007, available at http://www.census.gov/hhes/www/poverty.html. |
||||||
|
TABLE 2. Current smoking* among adults aged ≥18 years, by selected characteristics --- National Survey on Drug Use and Health, United States, 2006--2008 |
||||||
|---|---|---|---|---|---|---|
|
Characteristic |
Men (n = 19,222) |
Women (n = 17,809) |
Total population (n = 37,031) |
|||
|
% |
(95% CI) |
% |
(95% CI) |
% |
(95% CI) |
|
|
Race/Ethnicity |
||||||
|
White, non-Hispanic |
28.8 |
(28.0--29.5) |
25.1 |
(24.5--25.6) |
26.9 |
(26.4--27.3) |
|
Black, non-Hispanic |
33.7 |
(31.9--35.6) |
21.3 |
(19.7--22.9) |
26.9 |
(25.6--28.1) |
|
Hispanic |
28.9 |
(27.0--30.8) |
16.5 |
(15.2--17.8) |
22.9 |
(21.7--24.1) |
|
American Indian/Alaska Native |
42.4 |
(32.1--52.6) |
42.0 |
(34.2--49.8) |
42.2 |
(35.5--48.8) |
|
Asian† |
21.2 |
(18.2--24.1) |
8.8 |
(7.1--10.5) |
14.7 |
(13.0--16.4) |
|
Age group (yrs) |
||||||
|
18--25 |
33.6 |
(31.4--35.7) |
28.1 |
(26.1--30.1) |
31.0 |
(29.5--32.5) |
|
26--34 |
42.1 |
(41.3--42.9) |
33.6 |
(32.7--34.5) |
37.8 |
(37.2--38.5) |
|
35--49 |
38.9 |
(37.5--40.3) |
28.6 |
(27.3--29.8) |
33.7 |
(32.8--34.7) |
|
50--64 |
27.9 |
(27.1--28.8) |
23.7 |
(22.9--24.4) |
25.7 |
(25.1--26.4) |
|
≥65 |
10.5 |
(9.2--11.8) |
8.6 |
(7.5--9.6) |
9.4 |
(8.5--10.4) |
|
Educational attainment§ |
||||||
|
<High school diploma¶ |
37.6 |
(35.6--39.7) |
26.4 |
(24.4--28.3) |
32.0 |
(30.4--33.5) |
|
High school graduate |
33.9 |
(32.4--35.3) |
25.3 |
(24.2--26.4) |
29.3 |
(28.3--30.3) |
|
Some college |
28.1 |
(26.5--29.6) |
23.8 |
(22.6--25.1) |
25.7 |
(24.7--26.8) |
|
College graduate |
14.4 |
(13.4--15.4) |
12.1 |
(11.2--13.1) |
13.3 |
(12.5--14.0) |
|
Employment status |
||||||
|
Full-time |
29.7 |
(28.9--30.5) |
25.2 |
(24.4--26.0) |
27.8 |
(27.2--28.4) |
|
Part-time |
28.3 |
(26.6--30.0) |
22.4 |
(21.4--23.5) |
24.5 |
(23.5--25.4) |
|
Unemployed |
47.8 |
(44.5--51.2) |
41.2 |
(38.4--43.9) |
44.7 |
(42.3--47.2) |
|
Other (including not in work force) |
24.6 |
(23.3--25.9) |
18.9 |
(18.0--19.8) |
20.9 |
(20.2--21.7) |
|
Poverty status** |
||||||
|
<100% (below threshold) |
43.0 |
(41.1--44.9) |
32.1 |
(30.5--33.7) |
36.5 |
(35.1--37.8) |
|
100%--199% (at or near threshold) |
38.8 |
(37.4--40.2) |
28.0 |
(26.8--29.3) |
32.8 |
(31.8--33.8) |
|
≥200% (above threshold) |
25.2 |
(24.5--25.9) |
19.7 |
(19.0--20.3) |
22.5 |
(21.9--23.0) |
|
Abbreviation: CI = confidence interval. * Current smokers include all persons who smoked at least one cigarette during the 30 days before the survey. † Does not include Native Hawaiians or Pacific Islanders. § Educational attainment presented for adults aged >25 years. ¶ Reported having 12 years of education. ** Percentage of U.S. federal poverty level, on the basis of self-reported family income or imputed family income and U.S. Census Bureau poverty thresholds, available at http://www.census.gov/hhes/www/poverty.html. |
||||||
Use of trade names and commercial sources is for identification only and does not imply endorsement by the U.S. Department of
Health and Human Services.
References to non-CDC sites on the Internet are
provided as a service to MMWR readers and do not constitute or imply
endorsement of these organizations or their programs by CDC or the U.S.
Department of Health and Human Services. CDC is not responsible for the content
of pages found at these sites. URL addresses listed in MMWR were current as of
the date of publication.
All MMWR HTML versions of articles are electronic conversions from typeset documents.
This conversion might result in character translation or format errors in the HTML version.
Users are referred to the electronic PDF version (http://www.cdc.gov/mmwr)
and/or the original MMWR paper copy for printable versions of official text, figures, and tables.
An original paper copy of this issue can be obtained from the Superintendent of Documents, U.S.
Government Printing Office (GPO), Washington, DC 20402-9371;
telephone: (202) 512-1800. Contact GPO for current prices.
**Questions or messages regarding errors in formatting should be addressed to
mmwrq@cdc.gov.
