*Arthritis, osteoporosis, and chronic back conditions; chronic kidney disease; environmental health; human immunodeficiency virus infection; injury and violence prevention; mental health and mental disorders; public health infrastructure; respiratory diseases; sexually transmitted diseases; and substance abuse.
Persons using assistive technology might not be able to fully access information in this file. For assistance, please send e-mail to: mmwrq@cdc.gov. Type 508 Accommodation and the title of the report in the subject line of e-mail.
Rationale for Regular Reporting on Health Disparities and Inequalities --- United States
Background
Most U.S. residents want a society in which all persons live long, healthy lives (1); however, that vision is yet to be realized fully. As two of its primary goals, CDC aims to reduce preventable morbidity and mortality and to eliminate disparities in health between segments of the U.S. population. The first of its kind, this 2011 CDC Health Disparities and Inequalities Report (2011 CHDIR) represents a milestone in CDC's long history of working to eliminate disparities (2--6).
Health disparities are differences in health outcomes and their determinants between segments of the population, as defined by social, demographic, environmental, and geographic attributes (7). Health inequalities, which is sometimes used interchangeably with the term health disparities, is more often used in the scientific and economic literature to refer to summary measures of population health associated with individual- or group-specific attributes (e.g., income, education, or race/ethnicity) (8). Health inequities are a subset of health inequalities that are modifiable, associated with social disadvantage, and considered ethically unfair (9). Health disparities, inequalities, and inequities are important indicators of community health and provide information for decision making and intervention implementation to reduce preventable morbidity and mortality. Except in the next section of this report that describes selected health inequalities, this report uses the term health disparities as it is defined in U.S. federal laws (10,11) and commonly used in the U.S. public health literature to refer to gaps in health between segments of the population.
Public Health Importance of Health Disparities
Increasingly, the research, policy, and public health practice literature report substantial disparities in life expectancy, morbidity, risk factors, and quality of life, as well as persistence of these disparities among segments of the population (12--16). In 2007, the Healthy People 2010 Midcourse Review revealed progress on certain objectives but less than adequate progress toward eliminating health disparities for the majority of objectives among segments of the U.S. population, defined by race/ethnicity, sex, education, income, geographic location, and disability status (17).
During 1980--2000, the U.S. population became older and more ethnically diverse (18), and during 1992--2005, household income inequality increased (19). Although the combined effects of changes in the age structure, racial/ethnic diversity, and income inequality on health disparities are difficult to assess, the nation is likely to continue experiencing substantial racial/ethnic and socioeconomic health disparities, even though overall health outcomes measured by Healthy People 2010 objectives are improving for the nation. Because vulnerable populations are more likely than others to be affected adversely by economic recession, the recent downturn in the global economy might worsen health disparities throughout the United States if the coverage and effectiveness of safety-net and targeted programs do not keep pace with needs (20).
About This Report
CHDIR 2011 consolidates the most recent national data available on disparities in mortality, morbidity, behavioral risk factors, health-care access, preventive health services, and social determinants of critical health problems in the United States by using selected indicators. Data presented throughout CHDIR 2011 provide a compelling argument for action. The data pertaining to inequalities in income, morbidity, mortality, and self-reported healthy days highlight the considerable and persistent gaps between the healthiest persons and states and the least healthy. However, awareness of the problem is insufficient for making changes. In the analytic essays that follow, certain specific actions, in the form of universally applied and targeted interventions, are recommended. A common theme among the different indicators presented in CHDIR 2011 is that universally applied interventions will seldom be sufficient to address the problems effectively. However, success stories among the indicators (i.e., the virtual elimination of disparities in certain vaccination rates among children) can be used to identify strategies for addressing remaining disparities.
CDC's role in addressing disparities will continue to include surveillance, analysis, and reporting through periodic CHDIRs. In addition, CDC has a key role in encouraging use of evidence-based strategies, supporting public health partners, and convening expert and public stakeholders to secure their commitment to take action.
The primary target audiences for CHDIR 2011 include practitioners in public health, academia and clinical medicine, the media, general public, policymakers, program managers, and researchers. CHDIR 2011 complements but does not duplicate the contents of the annual National Healthcare Disparities Report (12) and the periodic reports related to Healthy People 2010 (17).
CHDIR 2011 contains a limited collection of topics, each exploring selected indicators of critical U.S. health problems. Topics included in CHDIR 2011 were selected on the basis of one or more of the following criteria: 1) leading causes of premature death among segments of the U.S. population as defined by sex, racial/ethnicity, income or education, geography, and disability status; 2) social, demographic, and other disparities in health outcomes; 3) health outcomes for which effective and feasible interventions exist; and 4) availability of high-quality national-level data. For each of the topics and indicators, subject-matter experts used the most recent national data available to describe disparity measures (absolute or relative) by sex, race/ethnicity, family income (percentage of federal poverty level), educational attainment, disability status, and sexual orientation. Because of limits on data availability and optimal size of the report, certain topics of potential interest in the health disparities literature have been excluded. For example, disparities by country of birth and primary language spoken are not included in this report. Residential segregation, a social determinant of health, will be included in a future report when census tract level data from the 2010 U.S. Census become available in 2011. In each topic-specific analytic essay, the contributors describe disparities in social and health determinants among population groups. Each narrative and its tabular and graphic elements reveal the findings, their meaning, and implications for action if known.
The National Partnership for Action (NPA) to end health disparities is a national plan for eliminating health disparities affecting U.S. racial/ethnic minorities sponsored by the U.S. Department of Health and Human Services (DHHS) Office of Minority Health. One of NPA's five objectives is to ensure the availability of health data for all racial/ethnic minority populations. CHDIR 2011 will contribute to the achievement of that objective.
Measures of Health Inequality
Disparities are most often presented as a series of pair-wise comparisons: strata of a particular variable compared with a referent group. An index of disparity summarizes pair-wise comparisons into a single measure of disparity among a population (21). Health inequality --- measured by using methods that originated in economics --- provides summary measures that capture inequality in the overall distribution of health among persons or groups within a population.
A measure of health inequality can summarize in one number, instead of multiple pair-wise comparisons, the difference between individual persons or segments of a population with regard to a health outcome or related attribute by using all information available about the whole population instead of only the extremes of the distribution (22). Consistent estimates of health inequality at national, state, tribal, or local levels enable useful comparisons across indicators of health status and across time for each indicator; reveal targets for reducing inequality at multiple levels of geography; and compare inequality in the need for services with availability of services for different population segments. Thus, health indicators with lower inequality among the overall U.S. population but with higher inequality within certain groups require further exploration by focusing specifically on the determinants and potential remedies for the higher inequalities within population groups. If the data were available, the indicators in this report could be compared and ranked in terms of the degree of inequality among the U.S. population overall and within specific segments. To illustrate what might be possible with adequate data in future reports, three indicators of inequality are presented and compared by using the Gini index of inequality (23): 1) inequalities in income; 2) years of potential life lost (YPLL) before age 75 years; and 3) the Health and Activities Limitation Index (HALex), a measure of health-related quality-of-life (HRQL).
The Gini index, the most commonly used measure of income inequality, measures the extent to which the income distribution among a population deviates from theoretical income distribution in which each proportion of the population earns the same proportion of total income. The index varies from 0 to 1, with higher values indicating greater inequality (i.e., 0 indicates complete equality, and 1 indicates perfect inequality). The Gini index has been adapted to measure health inequality across populations by providing estimates that capture the distribution of health, or health risk, among the entire population or within specific groups. Researchers and policymakers recognize the importance of both individual- and group-level approaches in measuring health inequality because they capture different dimensions of health inequality that can complement one another to strengthen the overall assessment of population health (13,24,25).
Individual-Level Measures of Inequality
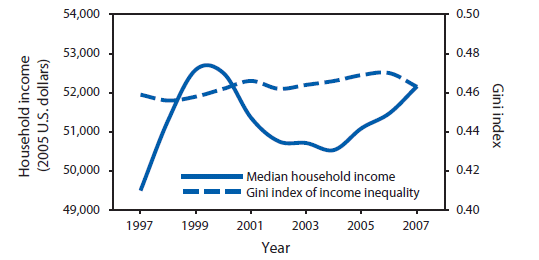
Income inequality. Income inequality in the United States (Gini index of 0.46 in 2007) (Table, Figure 1) is the highest among advanced industrialized economies (e.g., the combined Gini index for countries in the European Union and Russia is 0.31, ranging from the lowest score of 0.23 in Sweden to the highest for Russia at 0.41) (26,27), and demonstrates an increasing trend during 1997--2007 (Table, Figure 1). During this period, the U.S. median household income fluctuated but experienced an overall increasing trend. A Gini index of 0.46 in 2007 is half of the average relative difference (0.92) in average income between any two U.S. households chosen at random. The relative difference in average income is the absolute difference in average income ($64,590) between any two households divided by the average income for all households ($70,207) (28).
HALex. HALex provides one individual-level measure of HRQL that can be used to monitor health status as well as examine inequalities in morbidity across time and groups. HALex provides a numerical measure that combines information on self-rated health and activity limitation reported in nationally representative surveys (29,30). HALex scores can theoretically range from 1.00 for persons who have no activity limitation and are in excellent health to 0.10 for persons who are limited in activities of daily living (ADL) and are in poor health. HALex scores are based on assumptions and are described elsewhere (29,30). For example, a person in excellent health with activities of daily living disabilities is considered as healthy, with an assigned HALex score of 0.47, as a person in poor health with no disabilities.
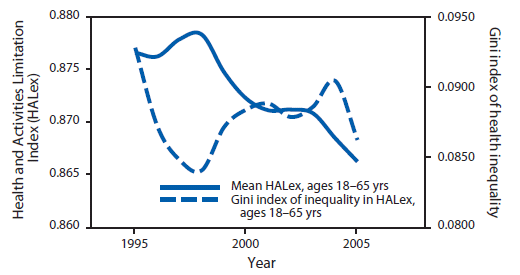
The average HALex and inequality for HALex among U.S. adults for 1997--2007 is estimated and presented (Figure 2). Although U.S. residents are living longer, the average HRQL among adults (ages 18--65 years), measured by using HALex, demonstrated a declining trend from 0.8766 in 1997 to 0.8662 in 2007. During the same period, health inequality among individual persons, as measured by the Gini index for HALex, fluctuated, varying from 0.084 to 0.093, and experienced an overall declining trend from 0.093 in 1997 to 0.087 in 2007.
Group-Level Measures of Inequality
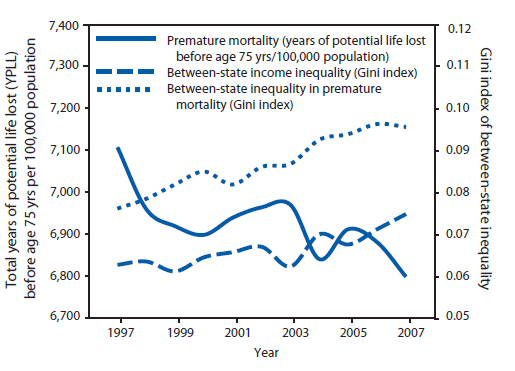
Income inequality. The Gini index measuring inequality between states in average household income increased slightly from 0.063 in 1997 to 0.075 in 2007 (Table, Figure 2). Inequality between states is lower than inequality between individual persons across the nation as a whole because the former is based on average values within states; averaging attenuates some of the variability between individual persons. Nonetheless, this trend indicates that income inequality between states is increasing with time.
Premature mortality. YPLL before age 75 years is a common measure of premature mortality. Although the rate of premature mortality in the United States has been declining in recent years, considerable variation in rates still exists across states, with the inequality in YPLL between states, as measured by the Gini index, increasing from 0.076 in 1997 to 0.096 in 2007 (Table, Figure 3). A Gini index of inequality of YPLL of 0.096 in 2007 is related directly to the average difference in YPLL/100,000 population between any two states chosen at random (average difference = 0.19 YPLL/100,000 population).
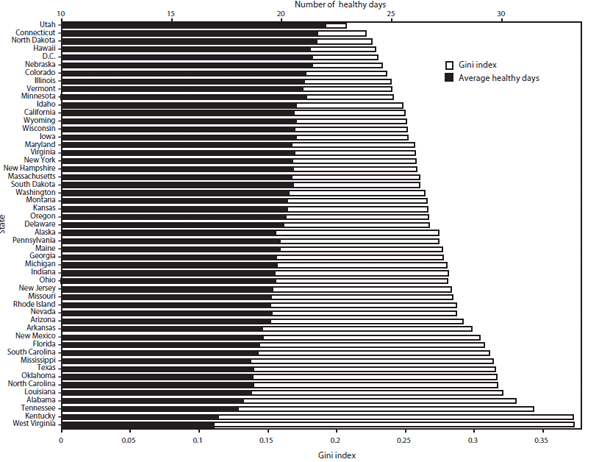
Healthy days. The number of healthy days is an HRQL measure routinely reported by CDC and considered particularly useful in identifying health disparities among population groups (31). Healthy days are measured as the overall number of days during the previous 30 days during which a person reported good (or better) physical and mental health. The average number of healthy days and the inequality in healthy days among adults (ages ≥18 years) by states is estimated by using data from the 2007 Behavioral Risk Factor Surveillance System. Certain states (e.g., Utah, Connecticut, and North Dakota) that have the highest mean healthy days have the lowest health inequality, and vice versa (Figure 4).
This examination of inequalities indicates that inequalities in income, YPLL, HALex, and healthy days measured across individual persons and among states were present in 2007. The magnitude of inequality or trends in inequality during 1997--2007 varies on the basis of measures used and depending on whether individual- or group-level data are analyzed. The healthy days analysis indicates that states that have lower average health also have higher health inequality. At each level (low, medium, high) of the U.S. income distribution, higher health inequality is associated with lower average number of healthy days (p<0.001, t-test of slope coefficient of linear regression line) (Figure 5). Using YPLL, HALex, and healthy days to illustrate the potential value of health inequality measures in this report does not resolve controversies surrounding the choice of appropriate measures of premature mortality and HRQL for monitoring population health status in the United States (17,32). Research into the attributes and psychometric properties of alternative measures of premature mortality and HRQL is ongoing. Emerging consensus on the best available measures for monitoring health disparities and inequalities in premature mortality and HRQL should be reflected in future editions of this report.
Gaps in the National Data
Efforts to monitor and report periodically on health disparities are confronted by data gaps in two critical disparity domains defined in the Healthy People series of national planning objectives (1,13): 1) disability status and 2) sexual orientation and identity. In CHDIR 2011, data gaps in disability status are evident. Only eight of the 22 topics include health disparities by disability status. Federal interagency working groups are discussing strategies for expanding the collection of data by disability status. Data gaps in sexual orientation are even more severe in that only one topic (human immunodeficiency virus diagnosis) contains information on disparities in a health outcome by a sexual behavior (i.e., men who have sex with men) that is related but not identical to sexual orientation, identity, or attraction. Similar discussions are under way regarding strategies to expand the collection of data by dimensions of sexual orientation (identity or attraction) and disability status.
Gaps in Disability Data
Regularly published health reports that include information on health disparities typically do not include disability status as a dimension for comparison. For example, of the 27 chapters in Healthy People 2010, a total of 10 included no objectives for disability,* and of 108 related objectives from other focus areas in the Disability and Secondary Conditions focus area, 71 had no source for disability data (17). However, recent publications have indicated the need for standard reporting of comparative health status between persons with and without disabilities (33,34). Disability includes impairments or limitations in activities or social participation as a result of an interaction between a person's environment and his or her health condition (35) that might be permanent and variable in severity. In surveys, disability is measured or determined to exist in multiple ways, depending on the purpose of the data and the mechanism used for data collection. In nationwide data systems, the level of detail that can be obtained (i.e., type of disability, severity, underlying cause, or duration) is defined operationally within the context of the particular survey employed. For example, in the National Health Interview Survey, which is administered in a face-to-face interview that permits extensive questioning, 32 questions are used to provide a detailed description of a person's disability (36). In the Behavioral Risk Factor Surveillance System, which places a premium on brevity, a binary indicator of disability is determined as a positive response to either of two questions having to do with a limitation in any activity related to physical, mental, or emotional problems, or use of assistive equipment (e.g., a cane, wheelchair, special bed, or special telephone). Both Healthy People 2010 and Healthy People 2020 have an objective to include a standard set of disability questions in the core of all relevant data systems to address this lack of consistency. Future CHDIR reports will contain more data on disability and be of better quality and greater salience to the reduction of health disparities adversely affecting persons with disabilities.
Gaps in Data Regarding Sexual Orientation
Data collection and analysis gaps in health disparities by sexual orientation are even more severe. Although Healthy People 2010 specifies that health disparities include "differences that occur by gender, race or ethnicity, education or income, disability, geographic location, or sexual orientation," only a limited number of regularly published national- or state-level health reports include information on sexual orientation (lesbian, gay, bisexual, transsexual, or heterosexual identity) as a demographic variable for comparison. Research studies have identified health disparities among sexual minority populations and explored concepts of sexual identity and one's perception of one's emotional, romantic, and sexual attraction (37). Standard reporting of sexual identity/orientation or sexual behavior on national health surveys is necessary if these health inequities are to be observed and attenuated among population groups. Data on sexual orientation or sexual behavior from the National Survey of Family Growth (NSFG) have been published (38,39). More recent NSFG data will be released soon and improve on the ascertainment of sexual identity. At the state level, Massachusetts has collected sexual orientation data through its Youth Risk Behavior Survey and Washington has done so recently on its Behavioral Risk Factor Surveillance System survey (40). Information on sexual behavior, a concept that describes behavior instead of identity or attraction, also can be used to investigate health and health-care characteristics across population groups. However, it is not collected in most national- and state-level surveys. In addition to consistent and routine collection of sexual orientation or behavior as demographic variables, analysis and publication of findings is critical. Researchers have published NHANES data on human immunodeficiency virus infection prevalence among men who have sex with men (41). However, NHANES data do not support reliable analyses of disparities by sexual orientation. As reflected in this report, data are lacking for assessing health disparities by sexual identity/orientation. Future CHDIRs might be able to include additional national-level data comparing health outcomes by sexual identity, sexual orientation, or sexual behavior. To fill this notable data gap, national and state surveys should begin consistently and routinely measuring sexual identity, orientation, and behavior. Data collection should be expanded to include not only age, sex, education, income, and race/ethnicity, but also disability, geographic location, and sexual identity or sexual orientation. Only then can health disparities be measured thoroughly and accurately nationwide.
Conclusion
The existence and persistence of substantial disparities in mortality, morbidity, risk behaviors, and hazardous environmental exposures between and among segments of the U.S. population have been well-documented. In 2007, the Healthy People 2010 Midcourse Review revealed progress on certain objectives but less than adequate progress toward eliminating health disparities for the majority of objectives among segments of the U.S. population defined by race/ethnicity, sex, education, income, geographic location, and disability status, and did not address disparities by sexual orientation (17). Whether disparities are measured as pair-wise comparisons between groups, as an index of disparity, or as summary measures of inequality, the results are the same.
This report focuses on disparities in selected specific health determinants and outcomes by sex, race/ethnicity, education, income, disability status, and geography. However, in several problem areas described in the topic-specific analytic essays, subject-matter experts have identified promising programs and interventions that might be effective in reducing disparities. By focusing public and policymaking attention on fewer, more critical disparities that are potentially modifiable by universal and targeted interventions, this periodic report should motivate increased efforts to intervene at the state, local, tribal, and community levels where stakeholders are more familiar with the problems and control resources for their abatement. Universal interventions are available to everyone while targeted interventions are implemented among populations with special needs (42).
Insufficient evidence exists regarding effectiveness of particular interventions in reducing specific disparities among certain defined populations. To fill this gap in evidence of programmatic effectiveness, the Task Force on Community Preventive Services recently has embarked on a series of systematic reviews of interventions that might help reduce disparities (Robert Hahn, CDC, personal communication, 2010). However, until more evidence of effectiveness is available, certain actions are prudent in support of efforts to reduce health disparities and their antecedents in the United States. Such actions include 1) increasing community awareness of disparities as problems with solutions; 2) setting priorities among disparities to be addressed at the federal, state, tribal, and local levels; 3) articulating valid reasons to expend resources to reduce and ultimately eliminate priority disparities; 4) implementing dual strategy of universal and targeted intervention programs on the basis of lessons learned from success in reducing selected disparities (e.g., racial/ethnic disparities in measles vaccination coverage); and 5) aiming to achieve a faster rate of improvement among disadvantaged groups by allocating resources in proportion to need and a commitment to closing modifiable gaps in health, longevity, and quality of life among all segments of the U.S. population.
References
- US Department of Health and Human Services (DHHS), the Secretary's Advisory Committee on National Health Promotion and Disease Prevention Objectives for 2020. Phase I report: recommendations for the framework and format of Healthy People 2020. Rockville, MD: DHHS; 2008. Available at http://www.healthypeople.gov/hp2020/advisory/PhaseI/PhaseI.pdf.
- Foege WH. The changing priorities of the Center for Disease Control. Public Health Rep 1978;93:616--21.
- Foege WH. Public health: moving from debt to legacy. Am J Public Health 1987;77:1276--8.
- Giles WH. The US perspective: lessons learned from the Racial and Ethnic Approaches to Community Health (REACH) Program. J R Soc Med 2010;103:273--6.
- Metzler MM, Higgins DL, Beeker CG, et al. Addressing urban health in Detroit, New York City, and Seattle through community-based participatory research partnerships. Am J Public Health 2003;93:803--11.
- Dean HD, Fenton KA. Addressing social determinants of health in the prevention and control of HIV/AIDS, viral hepatitis, sexually transmitted infections, and tuberculosis. Public Health Rep 2010;125(Suppl 4):1--5.
- Carter-Pokras O, Baquet C. What is a "health disparity"? Public Health Rep 2002;117:426--34.
- Asada Y. A summary measure of health inequalities for a pay-for-population health performance system. Prev Chronic Dis 2010;7:A72. Available at http://www.cdc.gov/pcd/issues/2010/jul/09_0250.htm.
- Braveman P, Gruskin S. Defining equity in health. J Epidemiol Community Health 2003;57:254--8.
- Patient Protection and Affordable Care Act of 2010. Public Law 111-148, 124 Stat. 119 thru 124 Stat. 1025. March 23, 2010.
- Health Care and Education Reconciliation Act of 2010. Public Law 111-152, 124 Stat. 1029. March 30, 2010.
- Agency for Healthcare Research and Quality. 2009 national healthcare disparities report. Rockville, MD: US Department of Health and Human Services, Agency for Healthcare Research and Quality; 2010. AHRQ publication no. 10-0004. Available at http://www.ahrq.gov/qual/qrdr09.htm.
- US Department of Health and Human Services. Healthy people 2010. 2nd ed. With understanding and improving health and objectives for improving health. 2 vols. Washington, DC: US Government Printing Office; 2000. Available at http://www.healthypeople.gov.
- Keppel KG, Pearcy NJ, Wagener KG. Trends in racial and ethnic-specific rates for the health status indicators: United States, 1990--98. Healthy People 2000 Stat Notes 2002;23:1--16.
- CDC/National Center for Health Statistics (NCHS). Healthy people 2000 final review. Hyattsville, MD: US Department of Health and Human Services, CDC, NCHS; 2001. Available at http://www.cdc.gov/nchs/data/hp2000/hp2k01.pdf.
- Nelson AR. Unequal treatment: report of the Institute of Medicine on racial and ethnic disparities in healthcare. Ann Thorac Surg 2003;76:S1377--81.
- US Department of Health and Human Services: Healthy people 2010: midcourse review. Rockville, MD: US Department of Health and Human Services; 2007. Available at http://www.healthypeople.gov/data/midcourse.
- Hobbs F, Stoops N. Demographic trends in the 20th century. Washington, DC: US Census Bureau; 2009. Available at http://www.census.gov/prod/2002pubs/censr-4.pdf.
- Bishaw A, Semega J. Income, earnings, and poverty data from the 2007 American Community Survey. Washington, DC: US Census Bureau; 2008. Available at http://www.census.gov/prod/2008pubs/acs-09.pdf.
- Hurley R, Katz A, Felland L. Relief, restoration and reform: economic upturn yields modest and uneven health returns. Issue Brief Cent Stud Health Syst Change 2008;117:1--4.
- Keppel K, Pamuk E, Lynch J, et al. Methodological issues in measuring health disparities. Hyattsville, MD: US Department of Health and Human Services, CDC, National Center for Health Statistics; 2005. Vital Health Statistics Series 2, No. 141. Available at http://www.cdc.gov/nchs/data/series/sr_02/sr02_141.pdf.
- Low A, Low A. Measuring the gap: quantifying and comparing local health inequalities. J Public Health (Oxf) 2004;26:388--95.
- Asada Y. Assessment of the health of Americans: the average health-related quality of life and its inequality across individuals and groups. Popul Health Metr 2005;3:7.
- World Health Organization (WHO): The world health report 2000---health systems: improving performance. Geneva, Switzerland: WHO; 2000. Available at http://www.who.int/whr/2000/en.
- Murray CJ, Gakidou EE, Frenk J. Health inequalities and social group differences: what should we measure? Bull World Health Organ 1999;77:537--43.
- European Commission. Eurostat online database. Belgium: European Commission; 2010. Available at http://epp.eurostat.ec.europa.eu.
- DeNavas-Walt C, Proctor BD, Smith JC. Income, poverty, and health insurance coverage in the United States: 2008. Washington, DC: US Census Bureau; 2009. Available at http://www.census.gov/prod/2009pubs/p60-236.pdf.
- Lochner K, Pamuk E, Makuc D, Kennedy BP, Kawachi I. State-level income inequality and individual mortality risk: a prospective, multilevel study. Am J Public Health 2001;91:385--91.
- Livingston EH, Ko CY. Use of the Health and Activity Limitation Index as a measure of quality of life in obesity. Obes Res 2002;10:824--32.
- Erickson P, Wilson R, Shannon I. Years of health life. Healthy People 2000 Stat Notes 1995;7:1--15.
- Moriarty DG, Zack MM, Kobau R. The Centers for Disease Control and Prevention's Healthy Days Measures---population tracking of perceived physical and mental health over time. Health Qual Life Outcomes 2003;1:37.
- Fryback DG. Measuring health-related quality of life. Presented at the Workshop on Advancing Social Science Theory: The Importance of Common Metrics. The National Academies, Division of Behavioral and Social Sciences and Education Washington, DC, February 2010. Available at http://www7.nationalacademies.org/dbasse/Common%20Metrics_Measuring_Health.pdf.
- Iezzoni LI. Tracking disability disparities: the data dilemma. J Health Serv Res Policy 2008;13:129--30.
- US Department of Health and Human Services (DHHS), Office of the Surgeon General. The Surgeon General's call to action to improve the health and wellness of persons with disabilities. Washington, DC: DHHS, Office of the Surgeon General; 2005. Available at http://www.surgeongeneral.gov/library/disabilities/calltoaction/calltoaction.pdf.
- World Health Organization (WHO). International classification of functioning, disability and health (ICF). Geneva, Switzerland: WHO; 2001. Available at http://www.who.int/classifications/icf/en.
- Altman B, Bernstein A. Disability and health in the United States, 2001--2005. Hyattsville MD: US Department of Health and Human Services, CDC, National Center for Health Statistics; 2008. Available at http://www.cdc.gov/nchs/data/misc/disability2001-2005.pdf.
- Reiter L. Sexual orientation, sexual identity, and the question of choice. Clin Soc Work J 1989;17:138--50.
- Mosher WD, Chandra A, Jones J. Sexual behavior and selected health measures: men and women 15--44 years of age, United States, 2002. Advance data from vital and health statistics; no. 362. Hyattsville, MD: National Center for Health Statistics; 2005.
- Anderson JE, Mosher WD, Chandra A. Measuring HIV risk in the U.S. population aged 15--44: results from cycle 6 of the National Survey of Family Growth. Advance data from vital and health statistics; no. 377. Hyattsville, MD: National Center for Health Statistics; 2006.
- Dilley JA, Simmons KW, Boysun MJ, Pizacani BA, Stark MJ. Demonstrating the importance and feasibility of including sexual orientation in public health surveys: health disparities in the Pacific Northwest. Am J Public Health 2010;100:460--7.
- Xu F, Sternberg MR, Markowitz LE. Men who have sex with men in the United States: demographic and behavioral characteristics and prevalence of HIV and HSV-2 infection; results from National Health and Nutrition Examination Survey 2001--2006. Sex Transm Dis 2010;37:399--405.
- Hutchins SS, Jiles R, Bernier R. Elimination of measles and of disparities in measles childhood vaccine coverage among racial and ethnic minority populations in the United States. J Infect Dis. 2004 May 1;189 Suppl 1:S146-52.
|
TABLE. Inequality in income, premature mortality, and health-related quality of life --- United States, 1997--2007 |
|||||||||||
|---|---|---|---|---|---|---|---|---|---|---|---|
|
Inequality measure |
Year |
||||||||||
|
1997 |
1998 |
1999 |
2000 |
2001 |
2002 |
2003 |
2004 |
2005 |
2006 |
2007 |
|
|
Median household income* |
$49,497 |
$51,295 |
$52,587 |
$52,500 |
$51,356 |
$50,756 |
$50,711 |
$50,535 |
$51,093 |
$51,473 |
$52,163 |
|
Household income inequality (Gini index)* |
0.4590 |
0.4560 |
0.4580 |
0.4620 |
0.4660 |
0.4620 |
0.4640 |
0.4660 |
0.4690 |
0.4700 |
0.4630 |
|
Between-state income inequality (Gini index)† |
0.0628 |
0.0636 |
0.0612 |
0.0646 |
0.0658 |
0.0671 |
0.0624 |
0.0701 |
0.0677 |
0.0713 |
0.0749 |
|
Premature mortality (years of potential life lost before age 75 yrs/100,000 population)§ |
7108.3 |
6960.6 |
6920.0 |
6899.5 |
6940.6 |
6965.2 |
6970.7 |
6841.5 |
6912.9 |
6882.0 |
6799.5 |
|
Between-state inequality in premature mortality (Gini index) § |
0.0762 |
0.0785 |
0.0820 |
0.0850 |
0.0819 |
0.0861 |
0.0868 |
0.0926 |
0.0939 |
0.0963 |
0.0956 |
|
Mean Health and Activities Limitation Index (HALex),¶ ages 18--65 yrs |
0.8766 |
0.8762 |
0.8779 |
0.8783 |
0.8747 |
0.8722 |
0.8711 |
0.8712 |
0.8708 |
0.8684 |
0.8662 |
|
Inequality in HALex¶ (Gini index), ages 18--65 yrs |
0.0928 |
0.0872 |
0.0848 |
0.0840 |
0.0871 |
0.0884 |
0.0888 |
0.0878 |
0.0886 |
0.0904 |
0.0862 |
|
* DeNavas-Walt, Carmen, Bernadette D. Proctor, and Jessica C. Smith, U.S. Census Bureau, Current Population Reports, P60-235, Income, Poverty, and Health Insurance Coverage in the United States: 2007, U.S. Government Printing Office, Washington, DC, 2008. † Based on the U.S. Census Bureau, Current Population Survey, 1997--2007, annual social and economic supplements. § Years of potential life lost estimates were extracted from CDC's Web-based Injury Statistics Query and Reporting System (WISQARS). Available at http://www.cdc.gov/injury/wisqars/index.html. Data source: CDC/National Center for Injury Prevention and Control (NCIPC). WISQARS years of potential life lost (YPLL) reports, 1999--2007. Atlanta, GA: US Department of Health and Human Services, CDC, NCIPC. Available at http://webappa.cdc.gov/sasweb/ncipc/ypll10.html. Population estimates were extracted from CDC Wonder. Available at http://wonder.cdc.gov/. ¶ Mean of and Inequality in Health and Activities Limitation Index were estimated by using data retrieved from the National Health Interview Surveys, 1997--2007. |
|||||||||||
Source: DeNavas-Walt, Carmen, Bernadette D. Proctor, and Jessica C. Smith, U.S. Census Bureau, Current Population Reports, P60-235, Income, Poverty, and Health Insurance Coverage in the United States: 2007, U.S. Government Printing Office, Washington, DC, 2008.
* 2005 U.S. dollars.
† Based on Gini index.
Alternate Text: The figure is a line graph that presents the median household income of persons in the United States from 1997 to 2007 and the Gini index that measures income inequality. Median income increased dramatically from 1997 to 1999, declined until 2004 before beginning an upward trend. The Gini index indicated that income inequality in the United States is highest among advance industrialized countries.
FIGURE 2. Average Health and Activities Limitation (HALex) and inequality in HALex among adults aged 18--65 years* --- United States, 1997--2007
Source: Gini index and mean of Health and Activities Limitation Index were estimated by using data retrieved from the National Health Interview Surveys, 1997--2007. Available at http://www.cdc.gov/nchs/nhis.htm.
* Based on Gini index.
Alternate Text: The figure is a line graph that presents the Health and Activities Limitation, or HALex, and inequalities in HALex among persons aged 18-65 years during 1997-2007. The graph indicates a decline in health-related quality of life over the time period while he Gini Index of inequalities fluctuated.
FIGURE 3. Premature mortality rate* and inequality in income and premature mortality rate between states† --- United States, 1997--2007
Source: Gini Index and mean of years of potential life lost (YPLL) were authors' calculation based on YPLL data extracted from CDC's Web-based Injury Statistics Query and Reporting System (WISQARS) (Available at http://www.cdc.gov/injury/wisqars/index.html.) and population estimates extracted from CDC WONDER (Available at http://wonder.cdc.gov). Between-state inequalities in household income were authors' calculation based on data from the U.S. Census Bureau, Current Population Survey, 1997--2007, annual social and economic supplements.
* Years of potential life lost (YPLL) before age 75 years per 100,000 population.
† Based on Gini index.
Alternate Text: The figure is a line graph that presents the premature mortality rate, which is based on years of potential life lost before age 75 years per 100,000 persons, and between-state income inequality and between-state inequality in premature mortality, measured by the Gini Index, from 1997-2007. YPLL steadily declined over the time period; however, inequality between states in both income and YPLL increased steadily.
FIGURE 4. State-specific Gini index of inequality in number of healthy days and average number of healthy days --- United States, 2007.
Source: Gini index and mean of number of healthy days was estimated by using data retrieved from the Behavioral Risk Factor Surveillance System, 2007. Available at http://www.cdc.gov/BRFSS.
Alternate Text: The figure is a bar graph that presents the state-specific average number of healthy days and inequality in number of health days as measured by the Gini Index from 1997 to 2007. Utah had the highest number of healthy days and West Virginia had the least. Most states with the highest number of healthy days had the lowest health inequality.
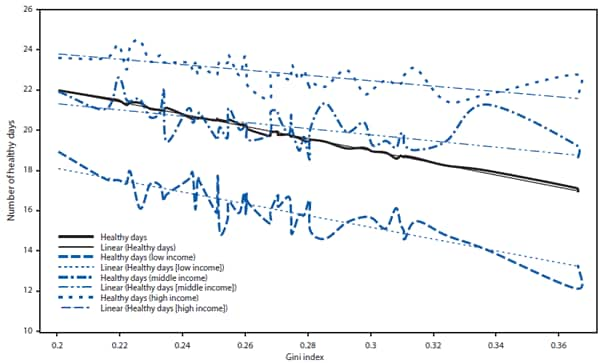
Source: Gini index and average number of healthy days was estimated by using data retrieved from the Behavioral Risk Factor Surveillance System, 2007. Available at http://www.cdc.gov/BRFSS/.
Alternate Text: The figure is a line graph that presents the average number of healthy days in three income levels (i.e., low, medium, and high) and the measure of inequality based on the Gini Index during 2007. At each level of income, higher inequality is associated with lower average number of healthy days.
|
Use of trade names and commercial sources is for identification only and does not imply endorsement by the U.S. Department of
Health and Human Services. |
All MMWR HTML versions of articles are electronic conversions from typeset documents.
This conversion might result in character translation or format errors in the HTML version.
Users are referred to the electronic PDF version (http://www.cdc.gov/mmwr)
and/or the original MMWR paper copy for printable versions of official text, figures, and tables.
An original paper copy of this issue can be obtained from the Superintendent of Documents, U.S.
Government Printing Office (GPO), Washington, DC 20402-9371;
telephone: (202) 512-1800. Contact GPO for current prices.
**Questions or messages regarding errors in formatting should be addressed to
mmwrq@cdc.gov.
