Controlled Substance Prescribing Patterns — Prescription Behavior Surveillance System, Eight States, 2013
1Division of Unintentional Injury Prevention, National Center for Injury Prevention and Control, CDC
2Prescription Drug Monitoring Program Center for Excellence, Brandeis University
Corresponding author: Leonard Paulozzi, Division of Unintentional Injury Prevention, National Center for Injury Prevention and Control, CDC. Telephone: 770-365-7616; e-mail: Lbp4@cdc.gov.
Abstract
Problem/Condition: Drug overdose is the leading cause of injury death in the United States. The death rate from drug overdose in the United States more than doubled during 1999–2013, from 6.0 per 100,000 population in 1999 to 13.8 in 2013. The increase in drug overdoses is attributable primarily to the misuse and abuse of prescription drugs, especially opioid analgesics, sedatives/tranquilizers, and stimulants. Such drugs are prescribed widely in the United States, with substantial variation by state. Certain patients obtain drugs for nonmedical use or resale by obtaining overlapping prescriptions from multiple prescribers. The risk for overdose is directly associated with the use of multiple prescribers and daily dosages of >100 morphine milligram equivalents (MMEs) per day.
Period Covered: 2013.
Description of System: The Prescription Behavior Surveillance System (PBSS) is a public health surveillance system that allows public health authorities to characterize and quantify the use and misuse of prescribed controlled substances. PBSS began collecting data in 2012 and is funded by CDC and the Food and Drug Administration. PBSS uses standard metrics to measure prescribing rates per 1,000 state residents by demographic variables, drug type, daily dose, and source of payment. Data from the system can be used to calculate rates of misuse by certain behavioral measures such as use of multiple prescribers and pharmacies within specified time periods. This report is based on 2013 de-identified data (most recent available) that represent approximately one fourth of the U.S. population. Data were submitted quarterly by prescription drug monitoring programs (PDMPs) in eight states (California, Delaware, Florida, Idaho, Louisiana, Maine, Ohio, and West Virginia) that routinely collect data on every prescription for a controlled substance to help law enforcement and health care providers identify misuse or abuse of such drugs.
Results: In all eight states, opioid analgesics were prescribed approximately twice as often as stimulants or benzodiazepines. Prescribing rates by drug class varied widely by state: twofold for opioids, fourfold for stimulants, almost twofold for benzodiazepines, and eightfold for carisoprodol, a muscle relaxant. Rates for opioids and benzodiazepines were substantially higher for females than for males in all states. In most states, opioid prescribing rates peaked in either the 45–54 years or the 55–64 years age group. Benzodiazepine prescribing rates increased with age. Louisiana ranked first in opioid prescribing, and Delaware and Maine had relatively high rates of use of long-acting (LA) or extended-release (ER) opioids. Delaware and Maine ranked highest in both mean daily opioid dosage and in the percentage of opioid prescriptions written for >100 MMEs per day. The top 1% of prescribers wrote one in four opioid prescriptions in Delaware, compared with one in eight in Maine. For the five states whose PDMPs collected the method of payment, the percentage of controlled substance prescriptions paid for in cash varied almost threefold, and the percentage paid by Medicaid varied sixfold. In West Virginia, for 1 of every 5 days of treatment with an opioid, the patient also was taking a benzodiazepine. Multiple-provider episode rates were highest in Ohio and lowest in Louisiana.
Interpretation: This report presents rates of population-based prescribing and behavioral measures of drug misuse in the general population that have not been available previously for comparison among demographic groups and states. The higher prescribing rates for opioids among women compared with men are consistent with a higher self-reported prevalence of certain common types of pain, such as lower back pain among women. The trend in opioid prescribing rates with age is consistent with an increase in the prevalence of chronic pain with age, but the increasing prescribing rates of benzodiazepines with age is not consistent with the fact that anxiety is most common among persons aged 30–44 years. The variation among states in the type of opioid or benzodiazepine of choice is unexplained. Most opioid prescribing occurs among a small minority of prescribers. Most of the prescriptions by top-decile prescribers probably are written by general, family medicine, internal medicine, and midlevel practitioners. The source of payment varied by state, for reasons that are unclear. Persons who are prescribed opioids also are commonly prescribed benzodiazepine sedatives despite the risk for additive depressant effects.
Public Health Actions: States can use their prescription drug monitoring programs to generate population-based measures for the prescribing of controlled substances and for behaviors that suggest their misuse. Comparing data with other states and tracking changes in these measures over time can be useful in measuring the effect of policies designed to reduce prescription drug misuse.
Introduction
The death rate from drug overdose in the United States more than doubled during 1999–2013, from 6.0 per 100,000 population in 1999 to 13.8 in 2013 (1), attributable largely to an increase in overdoses involving prescribed controlled substances, especially opioid analgesics and antianxiety/insomnia medications (2,3). Morbidity also has increased; during 2004–2011, the number of persons seen in emergency departments because of the misuse/abuse of prescription drugs increased 153% for opioid analgesics and 124% for antianxiety/insomnia medications (4,5).
To characterize and describe trends in controlled substance prescribing and prescription drug misuse, CDC and the Food and Drug Administration (FDA) funded the Prescription Behavior Surveillance System (PBSS) through an interagency agreement with the Bureau of Justice Assistance (BJA). BJA in turn contracted with the Prescription Drug Monitoring Program Center of Excellence at Brandeis University (http://www.pdmpexcellence.org) to develop, manage, and host PBSS.
PBSS collects data from participating state Prescription Drug Monitoring Programs (PDMPs), which are systems that are mandated to collect information from prescriptions for controlled drugs dispensed within a state (6). As of August 2015, PDMPs operated in all 50 states except Missouri. PDMPs were originally created primarily as a tool for law enforcement to identify patients, prescribers, or dispensers engaged in illegal activities such as drug diversion. Later, they became sources of information for prescribers on the prescription histories of their patients, which helps prescribers identify signs of prescription drug misuse or abuse, such as the use of multiple prescribers for the same drugs (7). Most PDMPs are managed by state health departments or boards of pharmacy.
PBSS represents an additional use of PDMP data for public health surveillance (8). PBSS allows comparisons to be made among states in the use and abuse of prescription drugs and will provide early warning of changes in such use. As with many surveillance systems, such as the Behavioral Risk Factor Surveillance System (http://www.cdc.gov/brfss), trends in PBSS data can be used to evaluate initiatives designed to change patient and provider behaviors to reduce prescription drug abuse and the resulting fatal overdoses. This is the first report to provide comparable, current data on controlled substance use from multiple state PDMPs for public health purposes. State agencies can use the information in this report to implement and evaluate interventions to address prescription drug abuse.
Methods
General Characteristics of PBSS
PBSS is an ongoing, population-based surveillance system that compiles data on all prescriptions for controlled drugs dispensed at pharmacies located within participating states. Regulations for the majority of states require that all pharmacies submit prescription information electronically to the system within 1 week of a prescription being filled (9), including prescriptions that were written out of state but dispensed in state. As of November 2014, a total of 44 of the 49 states with PDMPs also required mail-order, Internet, and out-of-state pharmacies to submit information on prescriptions written for their residents but dispensed out of state (10). Substance abuse treatment programs do not submit information to PDMPs on drugs they administer to patients. Veterans Administration facilities are authorized to submit data to state PDMPs and began doing so in 2014. As of September 2014, Indian Health Service facilities were preparing to participate in state PDMPs (11).
Selected states submit record-level PDMP data electronically to PBSS. States submit "legacy" data (i.e., data from previous years) upon joining the system and submit quarterly incident data thereafter. Quarterly data are available for use in PBSS within 3 months of the close of each calendar quarter. Data are available from most PBSS states for 2010 and following years, but only data from 2013, the most recent year for which data are available, are included in this report.
Drug Classes Included in PBSS
Prescription drugs regulated by the Controlled Substances Act (21 U.S.C. §§801–904) are termed "controlled substances" and are classified by the Drug Enforcement Administration (DEA) into five schedules (6). Prescription drugs prone to abuse usually are included in Schedules II–V (Schedule I includes illicit drugs). Schedule V is limited to drugs with the lowest potential for abuse (e.g., cough and cold formulations and antidiarrheal agents). As of 2014, all states in PBSS tracked at least drugs in Schedules II–IV. States can, at their discretion, add other drugs not scheduled by DEA to the list of drugs that must be reported to PDMPs. For example, some states added carisoprodol and/or the opioid analgesic tramadol before those drugs were scheduled by DEA in 2012 and 2014, respectively (12,13).
PBSS categorizes controlled prescription drugs primarily into three pharmacologic categories (opioid analgesics, benzodiazepines, and stimulants) rather than into schedules. PBSS also tracks selected other controlled drugs such as carisoprodol and the sleep aid zolpidem. Other controlled prescription drugs (e.g., barbiturates) are captured by PDMPs but are not tabulated separately by PBSS because those drugs were not considered important contributors to the drug overdose problem as of 2010 (3). Although the primary use of buprenorphine is for substance abuse treatment, PBSS categorizes it as an opioid analgesic. Cough and cold formulations containing opioids are not included in the opioid analgesic category in PBSS. Tramadol was not included in PBSS until 2014 and is not included in this report.
Data Source and Elements
The original source of information is a paper or electronic prescription form from a provider that is submitted to a pharmacy. Pharmacy software systems add the National Drug Classification (NDC) codes to the electronic prescription record based on the drug description. On receipt of data from pharmacies, PDMPs or their data management vendors use personal identifiers to link all the prescriptions for each patient, using a variety of deterministic or probabilistic methods. They also link all the prescriptions written by individual prescribers and dispensed by individual pharmacies based on their unique DEA numbers. Once linkage is completed, PDMPs anonymize the information by replacing patient, prescriber, and pharmacy identifying information with unique identifying numbers before submitting data to PBSS. These project-specific identifying numbers are maintained as PDMPs update their data to PBSS. PDMPs submit a standard set of 25 data elements (Box 1).
Data Processing at Prescription Drug Monitoring Program Center of Excellence
The Prescription Drug Monitoring Program Center of Excellence (COE) at Brandeis University processes data submitted by PBSS states. COE computes new variables using the submitted data, including patient age in years, the distance from patient to prescriber and from patient to dispenser, and the strength of an opioid prescription in standard units of morphine milligram equivalents (MMEs). The conversion factors for each opioid to MMEs were developed by CDC and are available on request from the Division of Unintentional Injury Prevention, National Center for Injury Prevention and Control, CDC. COE groups opioid analgesics into long-acting/extended-release forms or short-acting forms on the basis of their NDC codes. COE also assigns ranks to prescribers and dispensers by daily prescribing or dispensing volume and median distance from patient to prescriber or from patient to dispenser so they can be categorized into state-specific percentiles. COE further determines whether patients are prescribed different classes of drugs (e.g., opioids and benzodiazepines) simultaneously or are seeing multiple prescribers and dispensers for the same class or schedule of drugs.
The COE project team, in collaboration with CDC and FDA, has developed 43 prescription behavior measures (http://www.pdmpexcellence.org/content/prescription-behavior-surveillance-system-0). Measures of misuse/abuse are based on their association with overdose or clinical diagnosis of drug abuse (14,15). All measures are restricted to state residents. Prescriber and dispenser measures are restricted to in-state providers. Most measures are expressed as crude, population-based rates calculated from the most current state census information available from the U.S. Census Bureau.
Quality Control
Each quarterly update from a state consists of the latest data and the three preceding quarters of data, so any corrections to the data submitted by reporting pharmacies will be captured eventually in the PBSS database. PBSS staff inspect reports of the prescription behavior measures for values that appear to be out of range and assess types of errors and error rates in PBSS data by examining the percentage of records for each field that are corrected in successive quarterly updates for each state. Quarterly reports include the percentage of missing values for key variables such as patient sex, age, zip code, and method of payment. Demographic variables are rarely missing (<1%), but method of payment is missing for 5%–25% of prescriptions.
Surveillance Sites
Eight states submitted complete 2013 data to PBSS in time to be included in this first report: California, Delaware, Florida, Idaho, Louisiana, Maine, Ohio, and West Virginia. These eight states represent all four U.S. Census Bureau regions and comprise one fourth of the U.S. population.
Analysis
A subset of 12 of the most frequently employed behavior measures is included in this report (Box 2). Rates for drug classes and individual drugs are calculated per 1,000 state residents. Multiple-provider episode (MPE) rates are calculated per 100,000 state residents. An MPE is defined as an instance in which a patient fills prescriptions from five or more prescribers at five or more pharmacies for drugs of a particular class within a 6-month period. Annual MPE rates were calculated as the mean of the two 6-month rates during the calendar year. Overlapping prescribing is calculated as the percentage of prescribed days for a particular class of drugs that overlap with a prescription for another class of drugs. For the percentage of long-acting opioid prescriptions dispensed to "opioid-naïve" patients, patients were defined as "opioid-naïve" if they had not had an opioid prescription in the preceding 60 days.
Results
Opioid analgesics were prescribed at higher rates than stimulants or benzodiazepines in all states, with rates approaching one prescription per state resident (Table 1). Prescribing rates by drug class varied widely by state: 1.7-fold for opioids, 4.6-fold for stimulants, and 1.9-fold for benzodiazepines. Louisiana had the highest rate and California the lowest rate for all drug classes. Females had substantially higher rates for opioids and benzodiazepines than males in all states. For stimulants, male rates were at or above female rates in five states (California, Delaware, Idaho, Maine, and Ohio).
Opioid prescribing rates increased steadily with age in two states (California and Idaho) (Table 2) (Figure 1). In the other six states, prescribing rates peaked in either the 45–54 years or the 55–64 years age group. Louisiana had the highest prescribing rate for all age groups other than the 25–34 years age group. The peak prescribing rate for benzodiazepines was in the oldest age group (age ≥65 years) in all states but Delaware, where rates peaked among persons aged 55–64 years. For stimulants, prescription rates were highest among children aged <18 years in all states but Idaho. The age groups with the next highest rates were 18–24, 25–34, or 35–44 years. Children aged <18 years were prescribed stimulants 5.8 times more often in Louisiana than in California.
The variation from highest to lowest states was greater for individual types of opioids than for the category of opioids in general (Table 3). Louisiana ranked first for opioids largely because of its high rates for short-acting (SA) hydrocodone, 3.8 times the rate in Delaware, the state with the lowest rate. Hydrocodone SA accounted for 65% of Louisiana's opioid prescriptions and 21% of Delaware's opioid prescriptions (Figure 2). In contrast, oxycodone SA accounted for 43% of opioid prescriptions in Delaware and 15% of opioid prescriptions in Louisiana. California had the highest ratio of hydrocodone SA to oxycodone SA, 5.7. Delaware and Maine had high rates of prescribing of long-acting (LA) or extended-release (ER) opioids such as fentanyl LA, methadone, and oxycodone LA. Buprenorphine, a drug used primarily for outpatient substance abuse treatment rather than for pain, was prescribed nine times more often in Maine and West Virginia than in California. Maine moves from fourth to sixth in the state ranking if buprenorphine is not included in its total.
Overall, alprazolam, lorazepam, and clonazepam were the three most prescribed benzodiazepines (Table 4). Alprazolam accounted for almost half of all benzodiazepine prescriptions in Delaware (48.5%) (Figure 3). In contrast, it represented only 21.3% of such prescriptions in Maine, where lorazepam was the most prescribed product.
Amphetamine, methylphenidate, and lisdexamfetamine ranked first, second, and third, respectively, among stimulants in most states (Table 5). The proportion of stimulant prescriptions accounted for by amphetamines ranged from 38.4% in Delaware to 27.5% in West Virginia.
Carisoprodol had a 7.9-fold variation in prescribing rates, from a high of 69.1 in Louisiana to a low of 8.7 in Maine. This contrasts with 1.7-fold variation in rates between Louisiana and California for zolpidem (Table 6).
Delaware and Maine ranked highest in both mean daily opioid dosage and percentage of opioid prescriptions written for >100 MMEs per day (Table 7). Approximately one in every six opioid prescriptions in Delaware was for >100 MMEs per day. Ohio and West Virginia had the lowest overall daily dosage. California had the fifth highest overall daily dosage at 65.0 MMEs and the highest dosage among all states for fentanyl LA, morphine LA and SA, oxycodone LA and SA, and oxymorphone LA and SA.
The top 1% of prescribers in terms of numbers of their prescriptions wrote one in four opioid prescriptions in Delaware, compared with one in eight opioid prescriptions in Maine (Table 8), representing approximately 19 opioid prescriptions per day in the top percentile in Delaware. The top 10% (decile) of prescribers wrote half or more of the opioid prescriptions in all states. The top 10% of prescribers in Delaware wrote two thirds of all opioid prescriptions and wrote for the highest daily dosage among all states (88.6 MMEs/day). In general, the more prescriptions a prescriber wrote, the higher the daily dosage they specified.
For the five states whose PDMPs collected method of payment, the percentage paid for by cash for all controlled substances varied approximately threefold, and the percentage paid for by Medicaid varied approximately sixfold (Table 9). States with higher percentages of cash payment tended to be those with lower percentages of Medicaid payment. The percentages varied little between opioids and all controlled substances.
Overlapping prescriptions were common (Table 10). In West Virginia, for one of every 5 days of treatment with an opioid, the patient was also taking a benzodiazepine. For six of eight states, long-acting (LA) opioid prescriptions were more likely to overlap with other LA prescriptions than they were to overlap with short-acting (SA) opioid prescriptions.
Substantial fractions of LA/ER prescriptions were dispensed to persons who had not had an opioid prescription within the previous 60 days (i.e., opioid-naïve persons), especially in West Virginia and Idaho (Table 11). Dosages for LA/ER prescriptions for opioid-naïve patients (Table 11) were higher than daily dosages for opioids overall and lower than daily dosages for LA/ER opioids for all patients (Table 7).
MPE rates per 100,000 persons increased when their measure included more drug schedules (Table 12). Highest MPE rates for schedules II, III, and IV were among persons aged 35–54 years. Persons aged 18–34 years were almost universally more likely to see multiple prescribers than persons aged ≥55 years. MPE rates were highest in Ohio and lowest in Louisiana for both Schedules II and III and II–IV.
Discussion
PBSS is a novel surveillance system that allows public health officials to characterize the use and misuse of controlled prescription drugs. PBSS provides timely, population-based measures by both demographic characteristics and state. This report highlights the wide variations among states in multiple measures.
State ranks for prescribing of opioids, benzodiazepines, and stimulants in PBSS are consistent with their ranks in commercial prescription data (16,17). For example, California had the lowest opioid and benzodiazepine rates in this study and in a similar study that used data from IMS Health, a company that estimates state rates from a sample of pharmacies (http://www.imshealth.com/portal/site/imshealth). Population characteristics, such as ethnicity and socioeconomic status, and the availability of prescribers can explain only a small fraction of the variation in prescribing rates for opioid analgesics. Nor does the variation reflect variation in the prevalence of conditions for which analgesics are commonly prescribed (18). Similarly, the state variation in prescribing of stimulants is not likely attributable to variation in the prevalence of diagnoses of attention deficit/hyperactivity disorder (ADHD) and other conditions for which stimulants are prescribed (17). The contribution of other factors (e.g., physician norms, state policies, and drug marketing to prescribers and consumers) has not been well quantified.
The greater prescribing rate for opioids among women compared with men is consistent with a higher self-reported prevalence of certain common types of pain (e.g., chronic joint symptoms, lower back pain, and severe headaches) among women (19). The higher prescribing rates of benzodiazepines are consistent with higher female prevalence of receiving a diagnosis of anxiety disorder, the condition for which benzodiazepines are most commonly prescribed (20). Boys aged <17 years are more likely to be treated with stimulants than girls the same age, whereas females aged ≥17 years are slightly more likely than males in that age group to be so treated (17). The excess prescribing among adult women might reflect the fact that stimulants also are prescribed for weight control (21).
The age trend in opioid prescribing rates in California and Idaho is consistent with a general increase in the prevalence of chronic pain with age (22), but in most states, rates were higher in at least one age group among persons aged <65 years, suggesting that middle-aged persons in those states might be more likely to use opioids for reasons other than pain control (i.e., nonmedical use). The increasing prescribing rates of benzodiazepines with age also are not consistent with the age-specific prevalence of anxiety disorders, which occur most commonly among persons aged 30–44 years (23), or the age-specific prevalence of insomnia as reflected in the rate of use of medications for insomnia, which is greater among persons aged 50–59 years than among those aged ≥60 years (24). Benzodiazepines are prescribed most often to persons aged ≥65 years in most states in spite of the fact that their use is a known risk factor for falls in the elderly (25). Stimulants are prescribed to treat ADHD in children, which probably explains the highest prescribing rates in persons aged <18 years. In 2008, an estimated 4.5% of children and 1.2% of adults were dispensed a stimulant prescription in the United States (17). California had the lowest and Louisiana had the third highest rate of pharmacologically treated ADHD among U.S. children in 2003 (26). The markedly different stimulant prescribing rates among states identified in this report suggest that these rankings might not have changed. The likelihood that a patient will see multiple providers for stimulants, an indication of drug misuse, is greatest among those aged 20–39 years (27), which is consistent with the secondary peaks in prescribing rates in this age range in most of the states in this study.
The variation among states in the opioids of choice is largely unexplained. The high rates of use of LA opioids in Delaware and Maine were also noted in commercial data for 2012 (16). The preference for Schedule III (in 2013) hydrocodone SA over Schedule II oxycodone SA in California has been attributed to the fact that, until recently, California's PDMP monitored only Schedule II drugs (28). However, by 2013, all eight states had PDMPs that tracked at least Schedules II, III, and IV, although the Delaware PDMP only became active in 2012. Buprenorphine can be prescribed for substance abuse treatment only by office-based physicians who have completed special training and obtained a special waiver from DEA (29). The rate of such physicians (per 100,000 residents) varies widely by state and correlates roughly with state differences in buprenorphine rates noted in PBSS data (29). Better Medicaid funding, a higher rate of opioid overdose deaths, and specific state guidance for office-based buprenorphine use are associated with more waivered physicians (30).
The prescribing rate for benzodiazepines is influenced by level of use of alprazolam, lorazepam, and clonazepam, all of which are short-acting benzodiazepine sedatives that are often used for both anxiety and insomnia. These three drugs were the benzodiazepines most commonly involved in drug-related emergency department visits nationally in 2011, although lorazepam had lower emergency department visit rates than either alprazolam or clonazepam (5).
The proportion of prescribed stimulants accounted for by any one stimulant (e.g., amphetamine) varied less than the rate of prescribing of stimulants among states, suggesting that individual stimulants are not driving the interstate variation in the rate for the entire category. Amphetamine, methylphenidate, and lisdexamfetamine are used to treat ADHD in children and adults. Amphetamines and methylphenidate were the stimulants most commonly used nonmedically by college students in 2005 (31). In addition to using stimulants to improve concentration, adults also misuse them for weight loss (32).
Carisoprodol, a sedative prescribed as a muscle relaxant, has been subject to abuse (33). DEA placed it in Schedule IV in 2012 (13), although four states (Florida, Louisiana, Ohio, and West Virginia) had either scheduled it or monitored it via their state PDMPs previously (33). The insomnia drug zolpidem is also a federally scheduled drug because of its abuse potential (34). Overdose deaths involving zolpidem have increased in Florida in recent years (35).
California's low overall opioid dosage in spite of high dosage for commonly prescribed opioids is apparently because of its relatively low prescribing rates for higher-dosage Schedule II drugs such as morphine and oxycodone (Table 3). Hydrocodone typically is prescribed for acute pain and at much lower dosages than these other opioids. Daily dosage for LA/ER opioids is probably higher than that for SA opioids across all states because patients prescribed LA/ER opioids might have more serious pain requiring around-the-clock treatment and would be expected to have been on opioids for a longer period. The percentage of prescriptions >100 MMEs is consistent with the percentage reported in commercially insured populations in 2009 (15).
Ten percent of prescribers account for 50%–66% of opioid prescribing. However, this subset of prescribers does not account for all the differences in opioid prescribing rates among the states. For example, subtracting the prescriptions written by the top 10% in California and Louisiana would still leave much higher prescribing rates in Louisiana. Prescribers writing the most opioid prescriptions per day are more likely to be specialists in pain medicine, surgery, and physical medicine; however, these specialties account for <20% of opioid prescriptions nationwide (36). Such specialists cannot account for all the prescriptions written by top-decile prescribers, so that most such prescriptions probably are written by general practitioners, family medicine, internal medicine, and midlevel practitioners, who together prescribe approximately half of all opioid prescriptions (36). Nonetheless, the behavior of practitioners who work in self-identified pain clinics can influence a state's overall rates. Legislation regulating pain clinics has been associated with declines in opioid analgesic prescribing rates (37). Among states in this report, four states (Florida, Louisiana, Ohio, and West Virginia) had pain clinic laws in effect in 2013 (38).
Reasons for the variation in source of payment by state are unclear. Medicaid coverage varies by state, but the percentage paid for by Medicaid does not correlate with the extent of Medicaid coverage. For example, 16% of Delaware residents and 14% of Florida residents were covered by Medicaid in 2012 (39), yet the proportion of prescriptions covered by Medicaid was three times greater in Delaware than in Florida. High percentages of prescriptions paid for by cash generally are regarded as suspicious. For example, persons who seek prescriptions of the same controlled substances from multiple prescribers are more likely to pay for their prescriptions with cash (40).
PDMP results confirm that persons who are prescribed opioids are also commonly prescribed benzodiazepine sedatives despite the risk of their additive depressant effects (41). Short-acting opioids might be prescribed to handle "breakthrough" pain for patients already taking long-acting/extended-release opioids (42), but there is no clinical rationale for prescribing overlapping LA or overlapping SA opioid prescriptions. One previous study reported that 24% of LA/ER prescriptions overlapped another LA/ER prescription by ≥7 days (15). Some overlap might occur because persons fill prescriptions early. However, every 30-day LA/ER prescription would have to be refilled 3 days early to produce the 10% overlap typical in this report.
Short-acting opioids are probably safer for opioid-naïve patients because they have a shorter half-life and might have a lower risk for inadvertent overdose (42). Therefore, lower proportions of LA/ER opioids being prescribed to opioid-naïve persons are desirable. States that have difficulty linking all the prescriptions dispensed to individual patients might report inaccurately high rates of use of LA opioids by naïve patients because they fail to link the SA prescriptions that preceded the LA prescriptions in some cases.
Rates of patients involved in MPEs are all less than 1 per 1,000 state residents. However, the definition of MPE episodes used in this report (five or more prescribers and five or more pharmacies within 6 months) is more restrictive than other definitions (43). In addition, problems with linking prescriptions to patients in individual states might have artificially lowered their reported rates. By 2013, all eight states had laws that prohibited a patient from withholding information about prescriptions for controlled substances they have received from other health care practitioners (44). How such laws affect the rate of MPEs has not been evaluated. Various state and national clinical guidelines (42) recommend that prescribers use PDMPs to identify and prevent MPEs, but the impact of such guidelines on this behavior also has not been evaluated.
Limitations
The findings in this report are subject to at least four limitations. First, data submitted from pharmacies to PDMPs might not be accurate or complete. However, internal data quality checks in pharmacy computer systems identify inconsistencies and improbable values. Missing values were uncommon in 2013 with the exception of missing data on source of payment and missing data on patient sex in West Virginia, which did not require pharmacies to submit patient sex until October of 2013. Second, states have different methods of identifying unique patients, so the completeness and accuracy of linkages might vary by state. All states except California use probabilistic linkage methods, but their methods are not identical. For example, Ohio used a particularly sophisticated in-house probabilistic linkage method to maximize linkages of prescriptions to individual patients, so their rates of use of multiple providers might be least likely to be underestimates. California used a deterministic or "exact match" linkage method that might have missed some prescriptions recorded under slightly different names for the same patient. States that contracted with the same data vendors for PDMP operation can be assumed to have the same linkage procedures. Delaware, Florida, and Maine used the same data vendor in 2013, so their rates of multiple-provider episodes can be compared with greater accuracy. Third, pharmacies calculate the "days' supply" field based on quantity prescribed and daily dosage. PBSS measures of average daily dosage of opioids and of overlapping prescriptions depend on the days' supply field. But because some prescriptions specify that a drug should be taken as needed, the number of days' supply is necessarily an estimate. Finally, PDMPs do not routinely capture additional information that might be helpful such as patient diagnosis or prescriber specialty.
Conclusion
States can use their PDMPs as public health surveillance systems to generate timely population-based metrics for the prescribing of controlled substances and for behaviors that suggest their misuse. A report published by the Massachusetts Department of Public Health and its partners demonstrated how this might be done (8), and now other states can follow suit, using PBSS analyses conducted by PBSS or duplicating the PBSS measures internally. Tracking changes in these metrics over time can be useful in measuring the effect of policy changes designed to reduce prescription drug misuse. For example, the New York City Department of Health and Mental Hygiene has used New York State PDMP data to demonstrate the impact of a multipronged intervention on opioid prescribing and opioid-related deaths in one of its boroughs (45). The calculation of similar measures in multiple jurisdictions can now be conducted, and such comparisons can help identify norms and determine whether patterns or trends in one state are attributable to state policies or the result of larger, national influences. Explaining the variation in prescribing from state to state is an important topic for future research.
References
- CDC. WONDER. Atlanta, GA: US Department of Health and Human Services, CDC; 2014. Available at http://wonder.cdc.gov.
- Chen L, Hedegaard H, Warner M. Drug-poisoning deaths involving opioid analgesics: United States, 1999–2011. NCHS Data Brief; 2014. Available at http://www.cdc.gov/nchs/data/databriefs/db166.pdf.
- Jones CM, Mack KA, Paulozzi LJ. Pharmaceutical overdose deaths, United States, 2010. JAMA 2013;309:657–9.
- Substance Abuse and Mental Health Services Administration. The DAWN report: benzodiazepines in combination with opioid pain relievers or alcohol: greater risk of more serious ED visit outcomes. Rockville, MD: Substance Abuse and Mental Health Services Administration; 2014. Available at http://www.samhsa.gov/data/sites/default/files/DAWN-SR192-BenzoCombos-2014/DAWN-SR192-BenzoCombos-2014.pdf.
- Substance Abuse and Mental Health Services Administration. The DAWN report: highlights of the 2011 Drug Abuse Warning Network (DAWN) findings on drug-related emergency department visits. Rockville, MD: Substance Abuse and Mental Health Services Administration; 2013. Available at http://archive.samhsa.gov/data/2k13/DAWN127/sr127-DAWN-highlights.pdf.
- US General Accounting Office. Prescription drugs: state monitoring programs provide useful tool to reduce diversion. Washington, DC: US General Accounting Office; 2002. Available at http://www.gao.gov/new.items/d02634.pdf.
- Morgan L, Weaver M, Sayeed Z, Orr R. The use of prescription monitoring programs to reduce opioid diversion and improve patient safety. J Pain Palliat Care Pharmacother 2013;27:4–9.
- Katz N, Panas L, Kim M, et al. Usefulness of prescription monitoring programs for surveillance—analysis of Schedule II opioid prescription data in Massachusetts, 1996–2006. Pharmacoepidemiol Drug Saf 2010;19:115–23.
- Clark T, Eadie J, Kreiner P, Stickler G. Prescription drug monitoring programs: an assessment of the evidence for best practices. Waltham, MA: The Prescription Drug Monitoring Program Center of Excellence at Brandeis University; 2012. Available at http://www.pdmpexcellence.org/sites/all/pdfs/Brandeis_PDMP_Report_final.pdf.
- National Alliance for Model State Drug Laws. Prescription drug monitoring programs. Washington, DC: National Alliance for Model State Drug Laws; 2014. Available at http://www.namsdl.org/prescription-monitoring-programs.cfm.
- Gunderson C. Prescription Drug Monitoring Programs (PDMPs): Indian Health Service update [Presentation]. Harold Rogers Prescription Drug Monitoring Program Annual Meeting; Washington DC, September 23, 2014. Available at http://www.pdmpassist.org/pdf/PPTs/National2014/2-13_Thundercloud.pdf.
- Spiller HA, Scaglione JM, Aleguas A, et al. Effect of scheduling tramadol as a controlled substance on poison center exposures to tramadol. Ann Pharmacother 2010;44:1016–21.
- Reeves RR, Burke RS, Kose S. Carisoprodol: update on abuse potential and legal status. South Med J 2012;105:619–23.
- Paulozzi LJ, Kilbourne EM, Shah NG, et al. A history of being prescribed controlled substances and risk of drug overdose death. Pain Med 2012;13:87–95.
- Liu Y, Logan JE, Paulozzi LJ, Zhang K, Jones CM. Potential misuse and inappropriate prescription practices involving opioid analgesics. Am J Manag Care 2013;19:648–65.
- CDC. Vital signs: variation among states in prescribing of opioid pain relievers and benzodiazepines—United States, 2012. MMWR Morb Mortal Wkly Rep 2014;63:563–8.
- McDonald DC, Jalbert SK. Geographic variation and disparity in stimulant treatment of adults and children in the United States in 2008. Psychiatr Serv 2013;64:1079–86.
- McDonald DC, Carlson K, Izrael D. Geographic variation in opioid prescribing in the U.S. J Pain 2012;13:988–96.
- CDC. Summary health statistics for U.S. adults: National Health Interview Survey, 2011. Hyattsville, MD: US Department of Health and Human Services, CDC, National Center for Health Statistics; 2012. Available at http://www.cdc.gov/nchs/data/series/sr_10/sr10_256.pdf.
- Kessler RC, McGonagle KA, Zhao S, et al. Lifetime and 12-month prevalence of DSM-III-R psychiatric disorders in the United States: results from the National Comorbidity Survey. Arch Gen Psychiatry 1994;51:8–19.
- Hendricks EJ, Rothman RB, Greenway FL. How physician obesity specialists use drugs to treat obesity. Obesity (Silver Spring) 2009;17:1730–5.
- CDC. Health, United States, 2006, with Chartbook. Hyattsville, MD: US Department of Health and Human Services, CDC, National Center for Health Statistics; 2006. Available at http://www.cdc.gov/nchs/data/hus/hus06.pdf.
- Kessler RC, Wang PS. The descriptive epidemiology of commonly occurring mental disorders in the United States. Annu Rev Public Health 2008;29:115–29.
- Chong Y, Fryar C, Gu Q. Prescription sleep aid use among adults: United States, 2005–2010. Hyattsville, MD: US Department of Health and Human Services, CDC, National Center for Health Statistics, NCHS Data Brief; 2013. Available at http://www.cdc.gov/nchs/data/databriefs/db127.htm.
- Huang AR, Mallet L, Rochefort CM, Eguale T, Buckeridge DL, Tamblyn R. Medication-related falls in the elderly: causative factors and preventive strategies. Drugs Aging 2012;29:359–76.
- CDC. Mental health in the United States. Prevalence of diagnosis and medication treatment for attention-deficit/hyperactivity disorder—United States, 2003. MMWR Morb Mortal Wkly Rep 2005;54:847.
- Cepeda MS, Fife D, Berwaerts J, Yuan Y, Mastrogiovanni G. Shopping behavior for ADHD drugs: results of a cohort study in a pharmacy database. Drugs R D 2014;14:205–11.
- Paulozzi LJ, Kilbourne EM, Desai HA. Prescription drug monitoring programs and death rates from drug overdose. Pain Med 2011;12:747–54.
- Rosenblatt RA, Andrilla CH, Catlin M, Larson EH. Geographic and specialty distribution of US physicians trained to treat opioid use disorder. Ann Fam Med 2015;13:23–6.
- Stein BD, Gordon AJ, Dick AW, et al. Supply of buprenorphine waivered physicians: the influence of state policies. J Subst Abuse Treat 2015;48:104–11.
- Teter CJ, McCabe SE, LaGrange K, Cranford JA, Boyd CJ. Illicit use of specific prescription stimulants among college students: prevalence, motives, and routes of administration. Pharmacotherapy 2006;26:1501–10.
- Jeffers A, Benotsch EG, Koester S. Misuse of prescription stimulants for weight loss, psychosocial variables, and eating disordered behaviors. Appetite 2013;65:8–13.
- Fass JA. Carisoprodol legal status and patterns of abuse. Ann Pharmacother 2010;44:1962–7.
- Hajak G, Müller WE, Wittchen HU, Pittrow D, Kirch W. Abuse and dependence potential for the non-benzodiazepine hypnotics zolpidem and zopiclone: a review of case reports and epidemiological data. Addiction 2003;98:1371–8.
- Lee D, Delcher C, Maldonado-Molina MM, Bazydlo LA, Thogmartin JR, Goldberger BA. Trends in licit and illicit drug-related deaths in Florida from 2001 to 2012. Forensic Sci Int 2014;245C:178–86.
- Levy B, Paulozzi L, Mack KA, Jones CM. Trends in opioid analgesic-prescribing rates by specialty, U.S., 2007–2012. Am J Prev Med 2015; pii: S0749-3797(15)00089-6 [Epub ahead of print].
- Johnson H, Paulozzi LJ, Porucznik C, Mack K, Herter B. Decline in drug overdose deaths after state policy changes—Florida, 2010–2012. MMWR Morb Mortal Wkly Rep 2014;63:569–74.
- CDC Public Health Law Program. Menu of pain management clinic regulation. Atlanta, GA: US Department of Health and Human Services, CDC; 2014. Available at http://www.cdc.gov/phlp/docs/menu-pmcr.pdf.
- Kaiser Commission on Medicaid and the Uninsured. Why does Medicaid spending vary across states: a chart book of factors driving state spending. Washington, DC: Kaiser Family Foundation; 2012. Available at https://kaiserfamilyfoundation.files.wordpress.com/2013/01/8378.pdf.
- Cepeda MS, Fife D, Chow W, Mastrogiovanni G, Henderson SC. Opioid shopping behavior: how often, how soon, which drugs, and what payment method. J Clin Pharmacol 2013;53:112–7.
- Saunders KW, Von Korff M, Campbell CI, et al. Concurrent use of alcohol and sedatives among persons prescribed chronic opioid therapy: prevalence and risk factors. J Pain 2012;13:266–75.
- Chou R, Fanciullo GJ, Fine PG, et al. American Pain Society-American Academy of Pain Medicine Opioids Guidelines Panel. Clinical guidelines for the use of chronic opioid therapy in chronic noncancer pain. J Pain 2009;10:113–30.
- Cepeda MS, Fife D, Chow W, Mastrogiovanni G, Henderson SC. Assessing opioid shopping behavior. Drug Saf 2012;35:325–34.
- CDC Public Health Law Program. Doctor shopping laws. Atlanta, GA: US Department of Health and Human Services, CDC; 2014. Available at http://www.cdc.gov/phlp/docs/menu-shoppinglaws.pdf.
- Paone D, Tuazon E, Kattan J, et al. Decrease in rate of opioid analgesic overdose deaths—Staten Island, New York City, 2011–2013. MMWR Morb Mortal Wkly Rep 2015;64:491–4.
FIGURE 1. Opioid prescribing rates per 1,000 state residents, by age group — Prescription Behavior Surveillance System, eight states, 2013
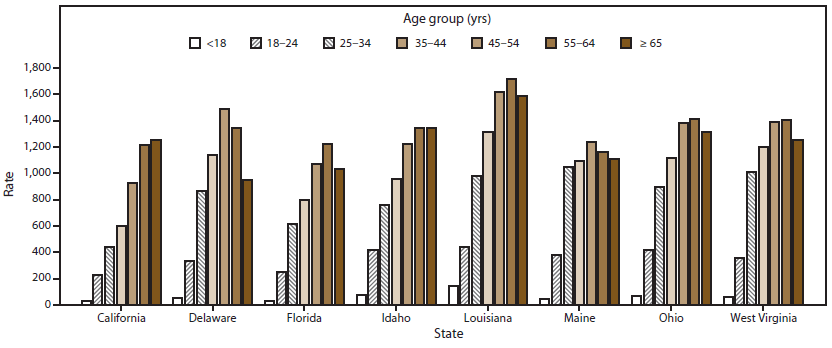
Alternate Text: The figure shows opioid prescribing rates per 1,000 state residents for eight states (California, Delaware, Florida, Idaho, Louisiana, Maine, Ohio, and West Virginia) that provided data to the Prescription Behavior Surveillance System for 2013. Rates of opioid prescribing are shown by seven age groups: age <18 years, age 18-24 years, age 25-34 years, age 35-44 years, age 45-54 years, age 55-64 years, and age ≥65 years.
FIGURE 2. Distribution of opioid prescriptions, by type of opioid drug* — Prescription Behavior Surveillance System, eight states, 2013
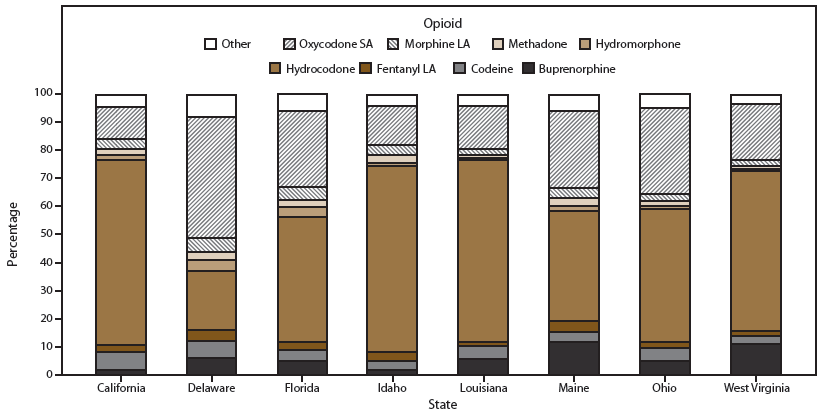
Abbreviations: LA = long-acting opioid formulation; SA = short-acting opioid formulation.
* Other includes types of opioids with minimal use (defined as <3%). Includes Butorphanol, Dihydrocodeine, Fentanyl SA, Meperidine, Oxymorphone LA, Oxymorphone SA, Oxycodone LA, Morphine SA, Pentazocine, Tapentadol, and others.
Alternate Text: The figure shows the distribution of opioid prescriptions for eight states (California, Delaware, Florida, Idaho, Louisiana, Maine, Ohio, and West Virginia) that provided data to the Prescription Behavior Surveillance System for 2013. Rates are shown by type of opioid drug prescribed.
FIGURE 3. Distribution of benzodiazepine prescriptions, by type of benzodiazepine drug* — Prescription Behavior Surveillance System, eight states, 2013
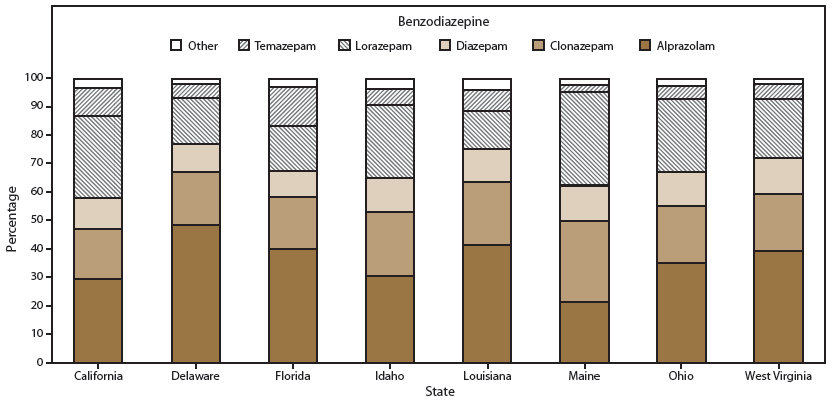
* Other includes types of benzodiazepines with minimal use (defined as <3%).
Alternate Text: The figure shows the distribution of benzodiazepine prescriptions for eight states (California, Delaware, Florida, Idaho, Louisiana, Maine, Ohio, and West Virginia) that provided data to the Prescription Behavior Surveillance System for 2013. Percentages are shown by type of benzodiazepine drug.
Use of trade names and commercial sources is for identification only and does not imply endorsement by the U.S. Department of
Health and Human Services.
References to non-CDC sites on the Internet are
provided as a service to MMWR readers and do not constitute or imply
endorsement of these organizations or their programs by CDC or the U.S.
Department of Health and Human Services. CDC is not responsible for the content
of pages found at these sites. URL addresses listed in MMWR were current as of
the date of publication.
All MMWR HTML versions of articles are electronic conversions from typeset documents.
This conversion might result in character translation or format errors in the HTML version.
Users are referred to the electronic PDF version (http://www.cdc.gov/mmwr)
and/or the original MMWR paper copy for printable versions of official text, figures, and tables.
An original paper copy of this issue can be obtained from the Superintendent of Documents, U.S.
Government Printing Office (GPO), Washington, DC 20402-9371;
telephone: (202) 512-1800. Contact GPO for current prices.
**Questions or messages regarding errors in formatting should be addressed to
mmwrq@cdc.gov.
