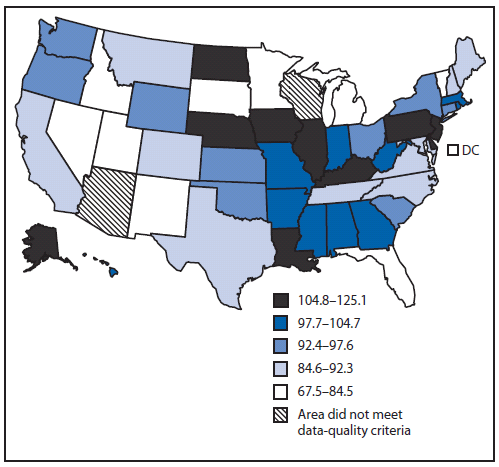
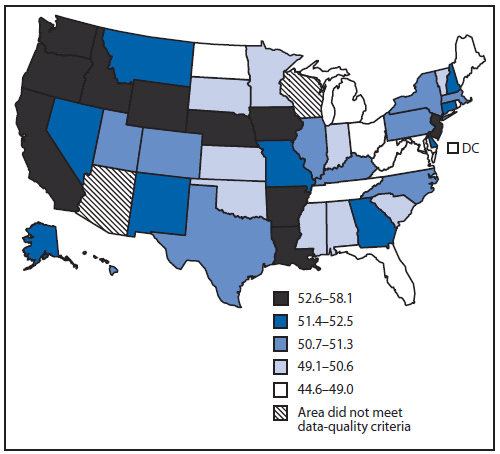
FIGURE 1. Rate* of late-stage colorectal cancer among men aged ≥50 years --- United States,† 2004--2006
Persons using assistive technology might not be able to fully access information in this file. For assistance, please send e-mail to: mmwrq@cdc.gov. Type 508 Accommodation and the title of the report in the subject line of e-mail.
Surveillance of Screening-Detected Cancers (Colon and Rectum, Breast, and Cervix) --- United States, 2004--2006
Abstract
Problem/Condition: Population-based screening is conducted to detect diseases or other conditions in persons before symptoms appear; effective screening leads to early detection and treatment, thereby reducing disease-associated morbidity and mortality. Based on systematic reviews of the evidence of the benefits and harms and assessments of the net benefit of screening, the U.S. Preventive Services Task Force (USPSTF) recommends population-based screening for colon and rectum cancer, female breast cancer, and uterine cervix cancer. Few publications have used national data to examine the stage at diagnosis of these screening-amenable cancers.
Reporting Period Covered: 2004--2006.
Description of Systems: Data were obtained from cancer registries affiliated with CDC's National Program of Cancer Registries (NPCR) and the National Cancer Institute's Surveillance, Epidemiology, and End Results (SEER) program. Combined data from the NPCR and SEER programs provide the best source of information on national population-based cancer incidence. Data on cancer screening were obtained from the Behavioral Risk Factor Surveillance System. This report provides stage-specific cancer incidence rates and screening prevalence by demographic characteristics and U.S. state.
Results: Approximately half of colorectal and cervical cancer cases and one third of breast cancer cases were diagnosed at a late stage of disease. Incidence rates of late-stage cancer differed by age, race/ethnicity, and state. Incidence rates of late-stage colorectal cancer increased with age and were highest among black men and women. Incidence rates of late-stage breast cancer were highest among women aged 60--79 years and black women. Incidence rates of late-stage cervical cancer were highest among women aged 50--79 years and Hispanic women. The percentage of persons who received recommended screening differed by age, race/ethnicity, and state.
Interpretation: Differences in late-stage cancer incidence rates might be explained partially by differences in screening use.
Public Health Action: The findings in this report emphasize the need for ongoing population-based surveillance and reporting to monitor late-stage cancer incidence trends. Screening can identify colorectal, cervical, and breast cancers in earlier and more treatable stages of disease. Multiple factors, including individual characteristics and health behaviors as well as provider and clinical systems factors, might account for why certain populations are underscreened. Cancer control planners, including comprehensive cancer-control programs, can use late-stage cancer incidence and screening prevalence data to identify populations that would benefit from interventions to increase screening utilization and to monitor performance of early detection programs.
Introduction
Population-based screening for cancer requires screening persons who might be at risk for but do not display symptoms of a particular cancer (1). Effective cancer screening reduces, through early detection and treatment, disease-associated morbidity and mortality (2--4). Screening also helps prevent cancer by detecting precancerous lesions (e.g., colorectal adenomatous polyps and cervical intraepithelial neoplasia) that can be removed. Based on systematic reviews of the evidence of the benefits and harms and assessments of the net benefit of screening, the U.S. Preventive Services Task Force (USPSTF) recommends population-based screening for colon and rectum cancer, female breast cancer, and uterine cervix cancer (5). Sponsored by the Agency for Healthcare Research and Quality, USPSTF is an independent panel of experts in prevention and primary care that systematically reviews the scientific evidence of the effectiveness of clinical preventive services, including screening for cancer, and develops recommendations for these services. USPSTF grades the strength of evidence as follows: "A" (strongly recommends), "B" (recommends), "C" (offers no recommendation for or against), "D" (recommends against), or "I" (finds insufficient evidence to recommend for or against) (5).
Progress against cancer can be measured by reductions in cancer mortality and also by trends in detecting cancer at earlier and more treatable stages of disease (6). Surveillance information about the stage of cancer at diagnosis is useful because it in part reflects prevalence and quality of screening (7).
Colorectal cancer is the third most commonly diagnosed cancer in both men and women in the United States (8). Incidence increases with age and is higher among men than among women and among blacks than among whites (9). The 5-year survival rate for persons who received a diagnosis of localized colorectal cancer is 91%, compared with 70% for regional-stage cancer and 11% for distant-stage cancer* (10). Studies of colorectal cancer show that black men and women are more likely to receive a diagnosis of late-stage disease than men and women in other racial/ethnic populations (11,12). Colorectal cancer incidence rates have been decreasing since 1985, most markedly during 1998--2005, partially as a result of increases in screening (8). Screening for colorectal cancer has been proven to reduce mortality through detection of adenomatous polyps before they progress to cancer as well as detection of early-stage cancer (2,13). USPSTF recommends that men and women of average risk begin regular colorectal cancer screening at age 50 years with any of three tests: a fecal occult blood test (FOBT) every year, a flexible sigmoidoscopy every 5 years, or a colonoscopy every 10 years (2,14). This is an "A" recommendation. The willingness of adults to utilize these tests depends on multiple factors, including individual disease risk, personal preference, and physician recommendation (15). Colorectal cancer screening rates are lower among persons aged 50--59 years, those with less education, and recent immigrants (13,16). Additionally, insurance coverage and geographic distance from a screening facility might affect a person's decision to obtain screening (15,16).
Breast cancer is the most commonly diagnosed cancer in women and a leading cause of premature mortality (8). The 5-year survival rate for women who receive a diagnosis of localized breast cancer is 98%, compared with 84% for regional stage and 23% for distant stage (10). Mammography can detect breast cancer at an early stage, when treatment is most effective (3). The incidence of female breast cancer increased from 1980-1999, due in part to the increased detection of localized disease and small (≤2 cm) tumors by mammography, the use of which more than doubled during this period (17). Since 1999, breast cancer incidence has decreased, partially because the use of mammography has stabilized and screening in the 1980s and 1990s had detected many undiagnosed prevalent cases, and because after 2002 many women stopped using hormone replacement therapy (17). Widespread use of screening and advances in treatment have resulted in substantial reductions in breast cancer mortality (18). USPSTF recommends biennial screening mammography for women aged 50--74 years (19). This is a "B" recommendation. The lowest prevalence of recommended breast cancer screening is among women who lack health insurance, Asian/Pacific Islander (API) and American Indian/Alaska Native (AI/AN) women, and recent immigrants (20,21).
The dramatic decrease in cervical cancer incidence and mortality since the mid-20th century has been termed one of the nation's foremost health success stories (22). This decrease is attributed to the convergence of three factors: an innovative breakthrough (the Pap test), public health promotion of the Pap test to women and to providers, and the routine use of the Pap test in primary-care practice (22). Although dramatic declines in cervical cancer mortality have occurred, nearly all cervical cancer cases could be prevented, and this cancer still ranks in the top 10 diagnosed cancers for black, AI/AN and Hispanic women and the 13th most common cancer among all women (8). Survival after cervical cancer diagnosis depends on stage at diagnosis; the 5-year survival rate for women who have localized disease is 92%, compared with 58% for regional disease and 17% for distant disease (10). Cervical cancer is diagnosed at a later stage more often in women aged ≥50 years, black women, and women who have not had a Pap test during the preceding 5 years (23,24). The Pap test detects cervical cancer and precancerous lesions (4). USPSTF recommends that women begin screening for cervical cancer with the Pap test within 3 years of onset of sexual activity or at age 21 years (whichever comes first) and be screened with three consecutive normal annual Pap tests and then at least every 3 years up to age 64 years (25). This is an "A" recommendation. Because the primary cause of cervical cancer is infection with certain types of human papillomavirus (HPV), HPV testing has been advanced as an alternative or adjunct to primary Pap screening. The USPSTF concluded in 2003 that the evidence was insufficient to recommend for or against the routine use of HPV testing as a primary screening for cervical cancer; this is an "I" recommendation (25). Prevalence of screening using the Pap test is lowest among women who lack health insurance, women with specific health risks such as smoking or being overweight or obese, women aged ≥65 years, API women, and recent immigrants (21,26,27).
This report provides incidence rates for late-stage cancers of the colon and rectum in men and women aged ≥50 years, of the breast in women aged ≥50 years, and of the cervix in women aged ≥20 years on the basis of data from cancer registries affiliated with CDC's National Program of Cancer Registries (NPCR) and the National Cancer Institute (NCI)'s Surveillance, Epidemiology, and End Results (SEER) program. This report also presents prevalence of recommended screening for these cancers based on data from the Behavioral Risk Factor Surveillance System (BRFSS), a state-based, ongoing telephone survey of adults aged ≥18 years (28).
Methods
Late-Stage Cancer Incidence
Data on new cases of invasive cancer diagnosed during 2004--2006 were obtained from population-based cancer registries affiliated with CDC's NPCR and NCI's SEER program. Combined, these programs cover all of the U.S. population and provide the best source of information on population-based cancer incidence for the nation. All participating cancer registries are members of the North American Association of Central Cancer Registries (NAACCR), a professional organization that establishes uniform data standards for cancer registration, trains cancer registry personnel, and certifies population-based cancer registries. CDC and NCI, in collaboration with NAACCR, maintain the U.S. Cancer Statistics (USCS) website, which contains the official federal statistics on cancer incidence from each registry that met data-quality criteria (29). Cancer registries demonstrated that cancer incidence data were of high quality by meeting six USCS publication criteria (29): 1) case ascertainment is ≥90% complete, 2) ≤5% of cases are ascertained solely on the basis of a death certificate, 3) ≤3% of cases are missing information on sex, 4) ≤3% of cases are missing information on age, 5) ≤5% of cases are missing information on race, and 6) ≥97% of the registry's records passed a set of single-field and inter-field computerized edits that test the validity and logic of data components. CDC analyzed data reported to NPCR as of January 31, 2009, and data reported to SEER as of November 2008. A total of 49 registries that met the data-quality criteria for every year during 2004--2006 were included in this analysis. These registries cover approximately 96% of the U.S. population, including 96% of the U.S. white population, 99% of the U.S. black population, 89% of the U.S. AI/AN population, 98% of the U.S. API population, and 96% of the U.S. Hispanic population.
Sites for incident cancers were coded according to the International Classification of Diseases (ICD) for Oncology (ICD-O) edition in use at the time of diagnosis, converted to the third edition coding (30): colon and rectum (C18--20, 26.0), breast (C50), and cervix (C53). Clinical and pathologic tumor characteristics such as size, multiplicity, depth of invasion and extension to regional or distant tissues, involvement of regional lymph nodes, and distant metastases were collected and classified using Collaborative Stage, a system used routinely by cancer registries (31). Collaborative Stage is used to derive three different staging systems, including SEER Summary Stage 2000, which characterizes cancers as localized, regional, distant, or unknown stage (31). Late-stage cancers include regional or distant stage. SEER Summary Stage is used to indicate prognosis, compare temporal trends, measure the success of cancer control efforts, and evaluate screening programs (31).
Population estimates used in the SEER*Stat software (available at http://seer.cancer.gov/seerstat) were a modified version of the annual time series of July 1 county population estimates by age, sex, and race/ethnicity produced by the U.S. Census Bureau (32). Modifications incorporated bridged single-race estimates that were derived from multiple-race categories in the 2000 Census (33). For most states, population estimates as of July 1 of each year were used to calculate annual incidence rates because these estimates are presumed to reflect the average population of a defined geographic area for a calendar year. However, certain county population estimates were adjusted to account for populations displaced along the Gulf Coast of Louisiana, Alabama, Mississippi, and Texas in fall 2005 by hurricanes Katrina and Rita (32). National total population estimates were not affected by these adjustments. Other specific modifications included using additional local information to estimate the native Hawaiian population accurately and to derive population estimates for a newly created county in Colorado (32). The modified county-level population estimates, summed to the state and national level, were used as denominators in rate calculations (32).
Average annual incidence rates per 100,000 persons were age-adjusted to the 2000 U.S. standard population by the direct method (34). Incidence rates were limited to age ≥50 years for colorectal and breast cancer and age ≥20 years for cervical cancer. Incidence rates were calculated for all races and ethnicities combined and for each of five major racial/ethnic populations (white, black, AI/AN, API, and Hispanic). Information regarding race and Hispanic ethnicity were collected separately. Hispanic ethnicity includes men and women from all race categories identified as Hispanic. Cancer registry data for AI/AN cases were linked with Indian Health Service (IHS) enrollment records to decrease the number of AI/AN persons who were misclassified as nonnative (35). The NAACCR Hispanic Identification Algorithm was applied to Hispanic ethnicity data to reduce misclassification of Hispanic persons as being of unknown ethnicity (36). Late-stage incidence rates were examined by age, race/ethnicity, and state. Corresponding 95% confidence intervals (CIs) were calculated as modified gamma intervals (37) and are presented to allow for comparisons among rates (38). For stability and reliability, rates were not reported if the numerator was fewer than 16 observations. All rate calculations were performed using SEER*Stat. Figures depict the geographic variability of age-adjusted incidence rates of late-stage cancer and percentage of cancers diagnosed at late stage by state, using quintiles as cutpoints.
Cancer Screening Prevalence
In 2008, BRFSS was conducted in all 50 states, the District of Columbia, Puerto Rico, Guam, and the U.S. Virgin Islands (28). BRFSS uses a multistage sampling design based on random-digit-dialing methods to select a representative sample from the non-institutionalized adult population aged ≥18 years in each state and territory. Details on methodology, random sampling procedures, design, and reliability and validity of measures used in BRFSS have been described previously (39,40). According to the Council of American Survey and Research Organizations guidelines, the median 2008 BRFSS cooperation rate (the proportion of all respondents interviewed of all eligible units in which a respondent was selected and actually contacted) was 75% and ranged from 59% to 88% among states (41). Questions on screening tests for colorectal, breast and cervical cancer were included in the core questionnaire in 2008 (42). Adult respondents were asked a series of questions about colorectal cancer screening including whether they had ever used a FOBT and if so, how long it had been since their most recent test and whether they had ever had a sigmoidoscopy or colonoscopy and if so, which procedure it was and how long it had been since their most recent exam. Recommended colorectal cancer screening was defined as having had a FOBT in the preceding year, a flexible sigmoidoscopy in the preceding 5 years, or a colonoscopy in the preceding 10 years. Adult female respondents were asked whether they had ever had a mammogram and how long it had been since their most recent mammogram. Current recommended breast cancer screening was defined as having had a mammogram in the preceding 2 years. Adult female respondents were asked whether they had ever had a Pap test and how long it had been since their most recent Pap test. Current recommended cervical cancer screening was defined as having had a Pap test in the preceding 3 years. Populations were restricted to the ages recommended for screening by USPSTF: ages 50--75 years for colorectal cancer screening, ages 50--74 years for breast cancer screening, and ages 21--64 years for cervical cancer screening. Percentages and exact CIs were weighted to the age, sex, racial, and ethnic distribution of the state's adult population according to the sampling design and age-adjusted to the 2000 U.S. standard population. Figures depict the geographic variability of age-adjusted estimated prevalence of cancer screening by state using quintiles as cutpoints.
Results
Colon and Rectum Cancer
During 2004--2006, a total of 99,205 late-stage colon and rectum cancer cases (rate: 94.2 per 100,000 men) were diagnosed in men aged ≥50 years in the United States (Table 1). Incidence rates increased with increasing age, from 40.9 among men aged 50--59 years to 182.9 among men aged ≥80 years. Incidence rates were highest among black men (114.0), followed by white (92.6), Hispanic (85.1), API (72.1), and AI/AN men (59.9). Incidence rates were lowest among AI/AN men aged 50--59 years (30.7) and highest among black men aged ≥80 years (192.9). State-specific late-stage colon and rectum incidence rates ranged from 67.5 to 125.1 and were highest in Alaska, Delaware, Illinois, Iowa, Kentucky, Louisiana, Nebraska, New Jersey, North Dakota, and Pennsylvania (range: 105.0--125.1) (Figure 1). Among all men, approximately half of colon and rectum cancers were late-stage (Table 1). This percentage decreased with increasing age, from 53.8% among men aged 50--59 years to 46.6% among men aged ≥80 years, primarily as a result of an increase in the number of unstaged cancers (rather than as a result of an increase in the number of localized cancers). The percentage of late-stage cancers was lowest for white men. AI/AN men aged 50--59 years had the highest percentage of late-stage cancers (61.5%). The percentage of late-stage cancers varied by state (range: 43%--57%) (Figure 2).
Overall, 61.9% of men aged 50--75 years reported recommended colorectal cancer screening in 2008 (Table 2). This percentage was lower for men aged 50--59 years (52.6%) and for men who were AI/AN (53.0%), API (50.7%), and Hispanic (46.5%). The percentage of men in each state who reported receiving recommended colorectal cancer screening varied (range: 51.3%--74.7%) (Figure 3) and was highest in Connecticut, Delaware, the District of Columbia, Maine, Maryland, Massachusetts, Michigan, New Hampshire, Rhode Island, and Vermont (range: 66.2%--74.7%).
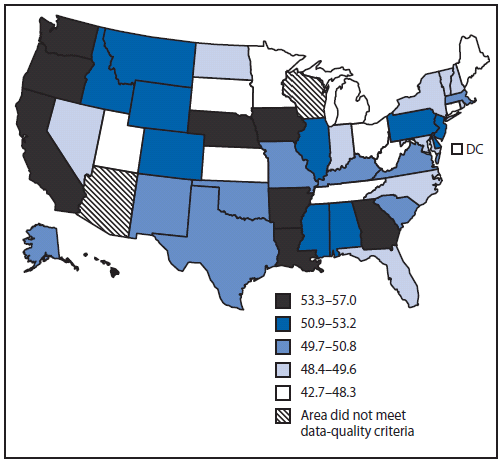
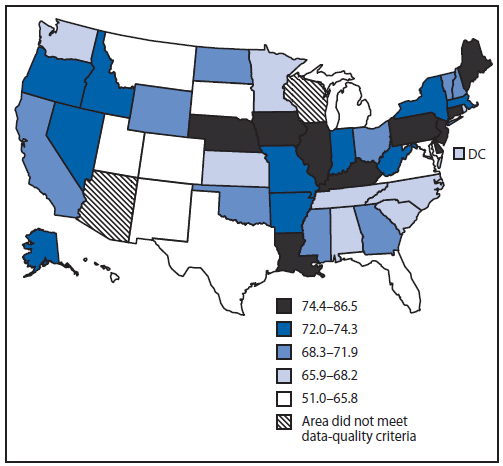
During 2004--2006, a total of 97,588 late-stage colon and rectum cancer cases (rate: 70.4 per 100,000 women) were diagnosed in women aged ≥50 years in the United States (Table 3). Incidence rates increased with increasing age, from 30.4 among women aged 50--59 years to 150.6 among women aged ≥80 years. Incidence rates were highest among black women (85.6), followed by white (68.6), Hispanic (60.2), API (57.2), and AI/AN (48.9) women. Incidence rates were lowest in AI/AN women aged 50--59 years (24.0) and highest among white women aged ≥80 years (151.0). Among states, late-stage colon and rectum incidence rates varied (range: 51.0--86.5) and were highest in Connecticut, Delaware, Illinois, Iowa, Kentucky, Louisiana, Maine, Nebraska, New Jersey, and Pennsylvania (range: 74.7--86.5) (Figure 4). Among all women, approximately half of colon and rectum cancers were late-stage (Table 3). This percentage decreased with increasing age, from 54.1% among women aged 50--59 years to 47.7% among women aged ≥80 years, as a result of an increase in the number of localized cancers up to age 79 years and an increase in the number of unstaged cancers in persons aged ≥80 years. The percentage of late-stage cancers was lowest (50.9%) for white women. AI/AN women aged 50--59 years had the highest percentage of late-stage cancers (60.5%). The percentage of late-stage cancers varied by state (range: 45%--58%) (Figure 5).
Overall, 62.0% of women aged 50--75 years reported recommended colorectal cancer screening in 2008 (Table 4). This percentage was lower for women aged 50--59 years (53.6%) and for women who were AI/AN (53.9%), API (56.4%), and Hispanic (51.0%). The percentage of women in each state who reported recommended colorectal cancer screening varied (range: 48.6%--72.5%) (Figure 6) and was highest in Connecticut, Delaware, Maine, Maryland, Massachusetts, Minnesota, New Hampshire, Rhode Island, Vermont, and Virginia (range: 68.2%--72.5%).
Breast Cancer
During 2004--2006, a total of 147,430 late-stage breast cancer cases (rate: 108.5 cases per 100,000 women) were diagnosed in women aged ≥50 years in the United States (Table 5). Incidence rates were lowest among women aged 50--59 years (93.0), highest among women aged 60--69 (119.2) and 70--79 (123.9) years, and intermediate among women aged ≥80 years (109.7). Incidence rates were highest among black women (124.3), followed by white (107.6), Hispanic (87.8), API (67.1), and AI/AN (61.4) women. Incidence rates were lowest in AI/AN women aged 50--59 years (48.8) and highest among black women aged 70--79 years (140.5). Among states, late-stage breast cancer incidence rates ranged from 92.2 to 132.1 and were highest in Alabama, the District of Columbia, Kansas, Louisiana, Mississippi, New Jersey, Oklahoma, Pennsylvania, Tennessee, and Washington (range: 115.0--132.1) (Figure 7). Among all women, approximately a third of breast cancers were late-stage (Table 5). This percentage decreased with increasing age, from 38.4% among women aged 50--59 years to 29.3% among women aged ≥80 years, because of an increase in the number of localized cancers in women up to age 79 years and an increase in the number of unstaged cancers in women aged ≥80 years. The percentage of late-stage cancers was lowest for white women (32.7%) and highest for black women (42.4%). Black women aged 50--59 years had the highest percentage of late-stage cancers (46.4%). Among states, the percentage of breast cancers that were late-stage varied by state (range: 27%--41%) (Figure 8).
Overall, 81.2% of women aged 50--74 years reported receiving recommended breast cancer screening in 2008 (Table 6). This percentage was lower only for women who were AI/AN (70.4%). The percentage of women in each state who reported receiving recommended breast cancer screening varied (range: 72.1%--89.8%) (Figure 9) and was highest in Connecticut, Delaware, the District of Columbia, Georgia, Maine, Massachusetts, Michigan, New Hampshire, New York, and Rhode Island (range: 83.9%--89.8%).
Cervical Cancer
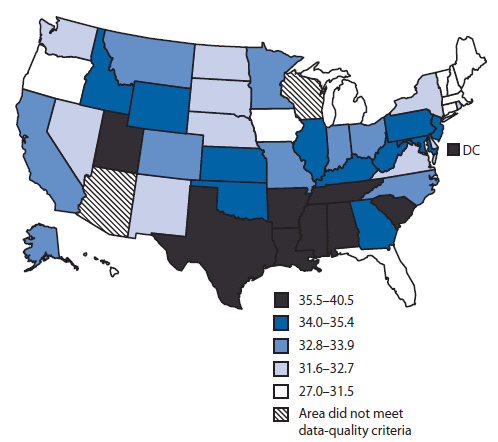
During 2004--2006, a total of 16,947 late-stage cervical cancer cases (5.2 per 100,000 women) were diagnosed in women aged ≥20 years in the United States (Table 7). Incidence rates were lowest among women aged 20--29 years (0.8), highest among women aged 50--79 years (range: 7.2--7.9), and intermediate among women aged 30--49 years or ≥80 years (4.1--6.3). Incidence rates were highest among Hispanic women (8.4), followed by black (7.8), API (5.2), white (4.9), and AI/AN (4.4) women. Incidence rates were lowest in white women aged 20--29 years (0.8) and highest among black women aged 70--79 years (15.1). Among states, late-stage cervical cancer incidence rates ranged from 3.0--8.3 and were highest in Arkansas, the District of Columbia, Illinois, Kentucky, Louisiana, Mississippi, Nevada, New Mexico, and Oklahoma (6.1--8.3) (Figure 10). Among all women, 47% of cervical cancers were late-stage (Table 7). This percentage was lowest among women aged 20--29 years (23.1%). The percentage of late-stage cancers was lowest for Hispanic women (45.9%) and highest for black women (52.8%). Among states, this percentage varied (range: 34%--53%) (Figure 11).
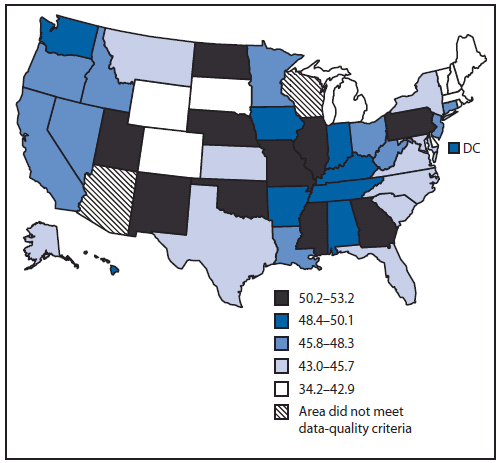
Overall, 87.6% of women aged 21--64 years had recommended cervical cancer screening in 2008 (Table 8). This percentage was lower for women who were aged ≥50 years (range: 83.1--86.0%), AI/AN (82.9%), and API (80.3%). The percentage of women in each state who had recommended cervical cancer screening varied (range: 81.0%--92.6%) (Figure 12) and was highest in Delaware, the District of Columbia, Maine, Massachusetts, Minnesota, New Hampshire, North Carolina, Rhode Island, Vermont, and Virginia (range: 90.3--92.6%).
Discussion
Interpretation of Screening-Amenable Cancer Incidence and Cancer Screening Prevalence
This report presents a snapshot of the situation in the United States using the most recent available estimates of late-stage cancer incidence (2004--2006) and screening prevalence (2008). During 2004--2006, approximately half of colorectal and cervical cancers and one third of breast cancers in the United States were diagnosed at a regional or distant stage, when treatment is not as effective and survival is worse compared with cancers diagnosed at a localized stage.
Examining both the rate and percentage of late-stage cancer is useful. Rates measure absolute burden of disease, which is useful for program planning. The rate of late-stage cancer provides some information about the overall (all stages combined) rate, the magnitude of which reflects the impact of underlying risk factors. Percentages measure proportionate burden of disease, which is helpful in comparing rates on different scales, such as by age. The percentage of late-stage cancer measures the proportion of cancers not detected at earlier, more treatable stage of disease, i.e., cancers that might have been detected with timely and effective screening. A high percentage of late-stage cancer may indicate, among other factors, low population-based screening rates.
Black men and women tended to have both higher rates of late-stage cancers and higher percentage of late-stage cancers than other racial/ethnic groups. AI/AN, API, and Hispanic men and women had lower rates but higher percentage of late-stage colorectal and female breast cancer than whites. Hispanic women had the highest rate of late-stage cervical cancer but the lowest percentage diagnosed at late-stage. The percentage of late-stage breast and colorectal cancers decreased with age, probably reflecting patterns of increasing use of colorectal and breast cancer screening with age. In contrast, the percentage of late-stage cervical cancers increased with women's age, which might reflect, in part, lower use of Pap tests.
The incidence rate and percentage of late-stage cancer varied by state. Unlike geographic patterns of heart disease and stroke incidence, which are highest in the South, mostly reflecting higher prevalence of cigarette smoking and hypertension (43), geographic patterns differed for each cancer site, reflecting differing importance of underlying demographic characteristics (e.g., age) and lifestyle behaviors (e.g., cigarette smoking, obesity, and screening use). Lifestyle behaviors that increase colorectal cancer risk include obesity, physical inactivity, excessive alcohol consumption, a diet high in red or processed meat and cigarette smoking (8,23). Lifestyle behaviors that increase breast cancer risk include being overweight or obese after menopause, using hormone replacement therapy, being physically inactive, and consuming more than one alcoholic drink a day (23). Lifestyle behaviors that increase cervical cancer risk include HPV infection and cigarette smoking (23,24). The prevalence of these lifestyle behaviors vary by state (28).
Population-based screenings for colorectal, breast and cervical cancer are proven interventions for decreasing the incidence and mortality from these cancers (2--4). However, millions of adults in the United States do not receive recommended screening for colorectal cancer (16), breast cancer (20), or cervical cancer (26). In this report, only 62% of adults met recommended screening guidelines for colorectal cancer; this percentage varied from 49% to 75% among states. Hispanic, AI/AN, and API men and women were less likely to receive colorectal cancer screening than white or black men and women. In this report, 81% of adult women aged 50--74 years had a mammogram during the preceding 2 years; this percentage varied from 72% to 90% among states. Similar to other reports, the lowest prevalence was among AI/AN women (20). In this report, 88% of women aged ≥21--64 years had received a Pap test during the preceding 3 years; this percentage varied by age and race/ethnicity and from 81% to 93% by state.
Limitations
The findings in this report are subject to at least five limitations. First, although these cancer incidence data covered 96% of the U.S. population and are the most inclusive study of the U.S. population, high-quality incidence data were not available from Arizona or Wisconsin. Second, data for AI/ANs are underreported in cancer registries (44). Linkage with external sources of information such as IHS enrollment records improved the quality of AI/AN data in this study (35); however, because IHS serves only federally recognized tribes, these data do not fully represent all AI/ANs, especially those in state-recognized tribes or those who do not seek care from IHS. Third, BRFSS collects self-reported use of screening tests that are not validated and respondents might not accurately recall the length of time since their most recent screening test and might either over-report or under-report the use of the screening test. In addition, respondents are not asked whether the test was used as a screening or diagnostic tool. Fourth, because BRFSS is a telephone survey of residential households, only adults in households with landline telephones are represented; therefore the results might not be representative of the U.S. population. Finally, the survey response rate was low, which increases the risk for response bias.
Public Health Action
The findings in this report emphasize the need for ongoing population-based surveillance and reporting to monitor cancer incidence trends. Cancer-control planners, including comprehensive cancer-control programs, can use cancer incidence and screening prevalence data to identify populations that would benefit from targeted screening interventions to realize the maximum benefits of cancer screening. The geographic pattern of late-stage cancers vary by cancer type. High rates of late-stage incidence of screening-amenable cancers might reflect in part demographic patterns, the ineffectiveness of screening programs (e.g., not reaching enough of the population, not reaching those at highest risk, or technical problems with the screening tests), or problems with quality of follow-up for abnormal screening test results. States might find it helpful to compare their demographic data with the national data presented in this report or with data from other states to determine the extent to which these factors might play a role.
Screening for colorectal, breast, and cervical cancer can identify cancer in earlier and more treatable stages of disease. Multiple factors, including individual characteristics and health behaviors as well as provider and clinical systems factors, influence why certain populations are underscreened. Identifying which men and women do not receive recommended screening is an important step in reducing cancer mortality. For example, screening rates are lower for men and women with low income, without health insurance, and without access to care and vary by age, education, race/ethnicity, and recent immigration (45). Even among men and women with health insurance, 34% had not received a FOBT during the preceding year or a lower endoscopy during the preceding 10 years (16), and 16% of women had not received mammography during the preceding 2 years (20). Social and economic disparities, lack of awareness of the need for screening, lack of physician recommendation, and lack of insurance coverage, are major factors in the underuse of cancer screening (15,26,46).
Screening rates also differ by type of cancer. This variation may be due to factors previously discussed as well as the length of time since the test was first developed and used as a screening tool, recommendation of the test as a clinical preventive service, and inclusion of the test as a health insurance benefit. Mandated health insurance coverage of screening tests vary by state (21). Screening rates are highest for the Pap test (88% in this report) which was introduced in the 1940s and quickly integrated into routine clinical practice (22). Screening rates for mammography (81% in this report) nearly doubled from 1987 to 1992; USPSTF guidelines were published in 1989 and private insurance coverage and Medicare benefits were mandated shortly after (17,45). Screening rates are lowest for colorectal cancer screening (62% in this report), tests for which were developed and recommended later than those for breast and cervical cancer screening (2,8). Screening rates seem to have plateaued for cervical and breast cancer screening (26) but are increasing steadily for colorectal cancer screening (16).
The U.S. Task Force on Community Preventive Services identified three primary strategies to increase screening rates: increasing community demand (47), increasing community access (48), and increasing provider delivery (49). The Community Guide recommended interventions such as patient reminder systems, small media (e.g., videos, letters, flyers, and brochures), one-on-one provider interactions, reducing structural barriers (e.g., providing more convenient hours and increasing attention to language, health literacy, and cultural factors), reducing financial barriers, and use of provider assessment and feedback to increase screening (50). These recommendations are echoed in the 2010 National Institute of Health panel on enhancing use and quality of colorectal cancer screening, which advised the elimination of financial barriers and implementation of proven interventions such as patient reminder systems and one-on-one provider interactions (51).
One program that is using these recommended strategies successfully to improve access to breast and cervical cancer screening and diagnostic services is the National Breast and Cervical Cancer Early Detection Program (NBCCEDP). NBCCEDP has provided these services to low-income, uninsured, and underinsured women for the preceding 20 years (52) and is the only national organized screening program in the United States. The program provides free or low-cost mammography and Pap tests to women with low income or without adequate health insurance in all 50 states, the District of Columbia, 12 tribes and tribal organizations, and five U.S. territories. NBCCEDP has program standards for timeliness and completeness of follow-up for abnormal screening tests and treatment initiation after precancer or cancer diagnosis. Funded programs are required to collect data on screening test characteristics and follow-up for all women who receive services paid for by the program. A recent study examining the timeliness and completeness of follow-up showed that the majority of women screened by NBCCEDP received appropriate and timely diagnostic follow-up and initiated treatment (53). An estimated 8%--11% of U.S. women of screening age are eligible to receive NBCCEDP services; approximately 14.3% of eligible women are screened for breast cancer (52), and 9% are screened for cervical cancer (54). Many states have augmented these federal funds to expand the population of uninsured women that they can reach (55); however, recent economic constraints on state, tribal, and territorial program funding have resulted in reduced services (56,57).
A program that emphasizes population-based approaches to increase screening is the Colorectal Cancer Control Program established recently by the CDC (58). This program provides funding to 25 states and four tribal organizations to promote colorectal cancer screening using evidence-based strategies recommended by the Task Force on Community Preventive Services and to provide colorectal cancer screening and follow-up care to low-income men and women aged 50--64 years who are underinsured or uninsured for screening (59).
The potential benefit of screening is realized only when it results in a timely diagnosis of disease that then is treated effectively (60). Quality of follow-up of abnormal screening tests is recognized increasingly as an important aspect of cancer screening (61). Patients with low income or who belong to certain racial/ethnic groups have longer delays in receiving appropriate diagnostic and treatment services following an abnormal screening test; however, many of these disparities can be explained by differences in health-care use and health-care setting, as well as by lack of adequate health insurance (62--65). Facilitating cancer screening (66) should be a focus of emerging practice-based quality-improvement demonstration systems such as the patient-centered medical home (67). Screening registries, such as the Breast Cancer Surveillance Consortium (68), can be used to track the screening process and monitor the quality, timeliness, and completeness of follow-up of abnormal screening tests as well as entry into treatment services (69). To address disparities in the receipt of timely and quality diagnostic services, programs that offer services such as case management or patient navigation to assist persons in accessing follow-up and treatment appear promising (70,71).
After determining the extent to which factors might affect the incidence of late-stage diagnoses and screening rates, States might find it helpful to determine the next steps for appropriate interventions. Comprehensive cancer control is an integrated and coordinated approach for reducing the burden of cancer incidence, morbidity, and mortality through a continuum of services including prevention, early detection, treatment, survivorship, and palliation (72). A key part of this is promoting recommended cancer screening guidelines using culturally-sensitive interventions and ensuring that evidence-based screening tests and treatments are available and accessible. Because this is accomplished most effectively at the local and state level, CDC's National Comprehensive Cancer Control Program (72) provides financial support and technical assistance to all 50 states, the District of Columbia, seven tribes and tribal organizations, and seven U.S. Associated Pacific Islands/territories to develop and implement a coordinated cancer-control plan. Cancer-control planners can use several online resources to discover the source of disparities in cancer incidence and cancer screening and to identify the most effective, evidence-based interventions to increase screening adherence. Cancer Control P.L.A.N.E.T. (Plan, Link, Act, Network with Evidence-based Tools) (http://cancercontrolplanet.cancer.gov) provides tools to assess the cancer and/or risk factor burden within a state, identify potential partners, understand research findings and recommendations, access evidence-based programs and products, and find guidelines for planning and evaluation. State Cancer Profiles (http://statecancerprofiles.cancer.gov/index.html) integrates surveillance into cancer control planning by characterizing the cancer and risk factor burden in geographic and demographic groups. U.S. Cancer Statistics (http://apps.nccd.cdc.gov/uscs/) presents high-quality cancer incidence and mortality statistics for the United States for 1999--2006. The Guide to Community Preventive Services (http://www.thecommunityguide.org/cancer/index.html) summarizes the effectiveness of population-based interventions so that cancer-control planners can choose the programs and policies that are right for their communities.
Health Care Reform
On March 23, 2010, the Patient Protection and Affordable Care Act (P.L. 111--148) became law (73). This act requires private health insurers and Medicare to cover recommended clinical preventive services graded "A" or "B" by USPSTF, including the screening tests described in this report, at no cost to insured patients (74). In addition, private insurers will be required to provide mammograms at no cost to women aged ≥40 years. This law expands the Medicaid state option to provide clinical preventive services recommended with a rating of "A" or "B" by USPSTF and increases the federal medical assistance percentage (FMAP) by one percentage point in states that eliminate cost sharing for these services. In addition, the law substantially expands Medicaid eligibility to persons, including nonpregnant childless adults, with incomes ≤133% of the federal poverty level (FPL) and optional coverage for those with incomes >133% of FPL. The law also expands private insurance coverage through employer mandates and tax credits for health insurance benefits and subsidies for persons to purchase insurance through state-based exchanges.
Ensuring coverage of recommended cancer screening, in part by removing financial barriers, is a critical first step in increasing the number of persons in the United States who receive these services. An important next step is ensuring appropriate and timely follow-up of abnormal screening tests (71) which requires a systematic approach to follow-up and surveillance (75). Systematic screening programs have been implemented in some managed care settings (76) and in programs such as the NBCCEDP (52) and the Colorectal Cancer Control Program (58) and could be applied across the U.S. population. The development of population-based registries of persons eligible for screening, for example, the Breast Cancer Surveillance Consortium (69), would help define the population eligible for screening and identify opportunities for targeted outreach to disparate populations. By working collaboratively, public health authorities can promote quality improvement and systems change interventions to assure evidence-based screening practice in clinical settings. The complexity of adequate follow-up testing after abnormal screening tests underscores the importance of public health authorities continuing to facilitate and ensure appropriate diagnostic testing and treatment thorough surveillance and case management of those persons who screen positive.
Acknowledgments
This report is based in part on data reported to CDC by state and regional cancer registry staffs and by BRFSS state coordinators.
References
- Morrison AS, ed. Monographs in Epidemiology and Biostatistics; No. 19: screening in chronic disease. 2nd ed. New York, NY: Oxford University Press; 1992.
- Whitlock EP, Lin JS, Liles E, Beil TL, Fu R. Screening for colorectal cancer: a targeted, updated systematic review for the U.S. Preventive Services Task Force. Ann Intern Med 2008;149:638--58.
- Nelson HD, Tyne K, Naik A, Bougatsos C, Chan BK, Humphrey L. Screening for breast cancer: an update for the U.S. Preventive Services Task Force. Ann Intern Med 2009;151:727--37.
- Hartman K, Hall S, Nanda K, Boggess J, Zoulnoun D. Screening for cervical cancer: systematic evidence review. Rockville, MD: US Department of Health and Human Services, Agency for Healthcare Research and Quality; 2002..
- U.S. Preventive Services Task Force. Prevention and care management. Available at http://www.ahrq.gov/clinic/prevenix.htm.
- Edwards BK, Howe HL, Ries LAG, et al. Annual report to the nation on the status of cancer, 1973--1999, featuring implications of age and aging on U.S. cancer burden. Cancer 2002;94:2766--92.
- Polednak AP. Trends in late-stage breast, cervical and colorectal cancers in blacks and whites. Ethn Dis 2000;10:60--8.
- Edwards BK, Ward E, Kohler BA, et al. Annual report to the nation on the status of cancer, 1975--2006, featuring colorectal cancer trends and impact of interventions (risk factors, screening, and treatment) to reduce future rates. Cancer 2010;116:544--73.
- Jackson-Thompson J, Ahmed F, German RR, Lai SM, Friedman C. Descriptive epidemiology of colorectal cancer in the United States, 1998--2001. Cancer 2006;107:1103--11.
- Horner MJ, Ries LAG, Krapcho M, et al. SEER cancer statistics review 1975--2006. Bethesda, MD: National Cancer Institute; 2009. Available at http://seer.cancer.gov/csr/1975_2006.
- Rim SH, Seeff L, Ahmed F, King JB, Coughlin SS. Colorectal cancer incidence in the United States, 1999--2004 : an updated analysis of data from the National Program of Cancer Registries and the Surveillance, Epidemiology, and End Results Program. Cancer 2009;115:1967--76.
- Irby K, Anderson WF, Henson DE, Devesa SS. Emerging and widening colorectal carcinoma disparities between Blacks and Whites in the United States (1975--2002). Cancer Epidemiol Biomarkers Prev 2006;15:792--7.
- Smith RA, Cokkinides V, Brooks D, Saslow D, Brawley OW. Cancer screening in the United States, 2010: a review of current American Cancer Society guidelines and issues in cancer screening. CA Cancer J Clin 2010;60:99--119.
- U.S. Preventive Services Task Force. Screening for colorectal cancer: U.S. Preventive Services Task Force recommendation statement. Ann Intern Med 2008;149:627--37.
- Subramanian S, Klosterman M, Amonkar MM, Hunt TL. Adherence with colorectal cancer screening guidelines: a review. Preventive Medicine. 2004;38:536--50.
- CDC. Vital signs: Colorectal cancer screening among adults aged 50--75 years---United States, 2008. MMWR 2010;59:808--12.
- Jemal A, Ward E, Thun MJ. Recent trends in breast cancer incidence rates by age and tumor characteristics among U.S. women. Breast Cancer Res 2007;9:R28.
- Berry DA, Cronin KA, Plevritis SK, et al. Effect of screening and adjuvant therapy on mortality from breast cancer. N Engl J Med. 2005;353:1784--92.
- U.S. Preventive Services Task Force. Screening for breast cancer: U.S. Preventive Services Task Force recommendation statement. Ann Intern Med 2009;151:716--26, W-236.
- CDC. Vital signs: breast cancer screening among women aged 50--74 years---United States, 2008. MMWR 2010;59:813--6.
- American Cancer Society. Cancer prevention and early detection: facts and figures 2009. Atlanta, GA: American Cancer Society; 2009.
- Rust G, Satcher D, Fryer GE, Levine RS, Blumenthal DS. Triangulating on success: innovation, public health, medical care, and cause-specific US mortality rates over a half century (1950--2000). Am J Public Health 2010;100:S95--104.
- American Cancer Society. Cancer facts and figures 2009. Atlanta, GA: American Cancer Society; 2009.
- Watson M, Saraiya M, Benard V, et al. Burden of cervical cancer in the United States, 1998--2003. Cancer 2008;113:2855--64.
- Berg AO, Allan JD, Frame P, et al. Screening for cervical cancer: recommendations and rationale. Am J Nurs 2003;103:101--10.
- CDC. Health, United States, 2009: with special feature on medical technology. Hyattsville, MD: US Department of Health and Human Services, CDC, National Center for Health Statistics; 2010.
- Nelson W, Moser RP, Gaffey A, Waldron W. Adherence to cervical cancer screening guidelines for US women aged 25--64: data from the 2005 Health Information National Trends Survey (HINTS). J Womens Health 2009;18:1759--68.
- Chowdhury P, Balluz L, Town M, et al. Surveillance of certain health behaviors and conditions among states and selected local areas---Behavioral Risk Factor Surveillance System, United States, 2007. In: Surveillance Summaries, February 5, 2010. MMWR 2010;59(No. SS-1).
- U.S. Cancer Statistics Working Group. United States cancer statistics: 1999--2006. Incidence and mortality web-based report. Atlanta, GA: US Department of Health and Human Services, CDC and National Cancer Institute; 2010. Available at http://www.cdc.gov/uscs.
- Fritz A, Percy C, Jack A. International classification of diseases for oncology. Geneva, Switzerland: World Health Organization; 2000.
- Young JL Jr, Roffers SD, Ries LAG, Fritz AG, AA H, eds. SEER summary staging manual---2000: codes and coding instructions. No. NIH Pub. No. 01-4969. Bethesda, MD: National Cancer Institute; 2001.
- National Cancer Institute. Surveillance Epidemiology and End Results (SEER) Program. Population estimates used in NCI's SEERstat software. Available at http://seer.cancer.gov/popdata/methods.html.
- CDC. National Vital Statistics System. U.S. census populations with bridged race categories. Available at http://www.cdc.gov/nchs/nvss.htm.
- Anderson R, Rosenberg H. Age standardization of death rates: implementation of the year 2000 standard. Natl Vital Stat Rep 1998;47:1--16.
- Espey DK, Wu X-C, Swan J, et al. Annual report to the nation on the status of cancer, 1975--2004, featuring cancer in American Indians and Alaska Natives. Cancer 2007;110:2119--52.
- North American Association of Central Cancer Registries Latino Research Work Group. NAACCR guideline for enhancing Hispanic/Latino identification: revised NAACCR Hispanic/Latino identification algorithm [NHIA v2.2]. Springfield, IL: North American Association of Central Cancer Registries; 2009.
- Tiwari RC, Clegg LX, Zou Z. Efficient interval estimation for age-adjusted cancer rates. Stat Methods Med Res 2006;15:547--69.
- Schenker N, Gentleman JF. On judging the significance of differences by examining the overlap between confidence intervals. Am Stat 2001;55:182--86.
- CDC. Behavioral Risk Factor Surveillance System operational and user's guide, Version 3.0. Atlanta, GA: US Department of Health and Human Services, CDC; 2006. Available at ftp://ftp.cdc.gov/pub/Data/Brfss/userguide.pdf.
- Nelson DE, Holtzman D, Bolen J, Stanwyck CA, Mack KA. Reliability and validity of measures from the Behavioral Risk Factor Surveillance System (BRFSS). Soz Praventivmed. 2001;46 Suppl 1:S3--42.
- CDC. 2008 Behavioral Risk Factor Surveillance System summary data quality report, version April 3, 2009. Atlanta, GA: US Department of Health and Human Services, CDC; 2009. Available at ftp://ftp.cdc.gov/pub/Data/Brfss/2008_Summary_Data_Quality_Report.pdf.
- CDC. 2008 Behavioral Risk Factor Surveillance System survey questionnaire. Atlanta, GA: US Department of Health and Human Services, CDC; 2008. Available at http://www.cdc.gov/brfss/questionnaires/pdf-ques/2008brfss.pdf.
- CDC. Heart disease and stroke maps. Atlanta, GA: US Department of Health and Human Services, CDC; 2005. Available at http://apps.nccd.cdc.gov/giscvh2.
- Clegg LX, Reichman ME, Hankey BF, et al. Quality of race, Hispanic ethnicity, and immigrant status in population-based cancer registry data: implications for health disparity studies. Cancer Causes Control. 2007;18:177--87.
- Swan J, Breen N, Coates RJ, Rimer BK, Lee NC. Progress in cancer screening practices in the United States. Cancer 2003;97:1528--40.
- Jerant AF, Fenton JJ, Franks P. Determinants of racial/ethnic colorectal cancer screening disparities. Arch Intern Med 2008;168:1317--24.
- Baron RC, Rimer BK, Breslow RA, et al. Client-directed interventions to increase community demand for breast, cervical, and colorectal cancer screening. Am J Prev Med 2008;35:S34--55.
- Baron RC, Rimer BK, Coates RJ, et al. Client-directed interventions to increase community access to breast, cervical, and colorectal cancer screening---a systematic review. Am J Prev Med 2008;35:S56--66.
- Sabatino SA, Habarta N, Baron RC, et al. Interventions to increase recommendation and delivery of screening for breast, cervical, and colorectal cancers by healthcare providers---systematic reviews of provider assessment and feedback and provider incentives. Am J Prev Med 2008;35:S67--74.
- U.S. Task Force on Community Preventive Services. Recommendations for client- and provider-directed interventions to increase breast, cervical, and colorectal cancer screening. Am J Prev Med. 2008;35:S21--5.
- Allen J, Barlow W, Duncan R, et al. NIH State-of-the-Science Conference statement: enhancing use and quality of colorectal cancer screening. NIH Consens State Sci Statements 2010;27.
- CDC. National Breast and Cervical Cancer Early Detection Program. Available at http://www.cdc.gov/cancer/nbccedp.
- Richardson LC, Royalty J, Howe W, Helsel W, Kammerer W, Benard VB. Timeliness of breast cancer diagnosis and initiation of treatment in the National Breast and Cervical Cancer Early Detection Program, 1996--2005. Am J Public Health 2009.
- Tangka FK OHB, Gardner JG, Turner J, et al. Meeting the cervical cancer screening needs of underserved women: the National Breast and Cervical Cancer Early Detection Program, 2004--2006. Cancer Causes Control 2010;21:1081--90.
- US Government Accountability Office. Report to Congressional Requesters. MEDICAID: Source of screening affects women's eligibility for coverage of breast and cervical cancer treatment in some states. GAO-09-384. Washington, DC: US Government Accountability Office; 2009. Available at http://www.gao.gov/new.items/d09384.pdf.
- Stone K. State breast cancer screening programs struggle financially Oncology NEWS International 2010;19. Available at http://www.cancernetwork.com/breast-cancer/content/article/10165/1568197.
- Krisberg K. Budget cuts straining capacity of public health departments: Services in demand. The Nation's Health 2010;40:1--16.
- Seeff LC, DeGroff A, Tangka F, et al. Development of a federally funded demonstration colorectal cancer screening program. Prev Chronic Dis 2008;5:A64.
- CDC. Colorectal Cancer Control Program 2010. Available at http://www.cdc.gov/cancer/crccp/index.htm.
- Taplin SH, Clauser S, Rodgers AB, Breslau E, Rayson D. Interfaces across the cancer continuum offer opportunities to improve the process of care. J Natl Cancer Inst Monogr 2010;2010:104--10.
- Yabroff KR, Washington KS, Leader A, Neilson E, Mandelblatt J. Is the promise of cancer-screening programs being compromised? Quality of follow-up care after abnormal screening results. Med Care Res Rev 2003;60:294--331.
- Battaglia TA, Santana MC, Bak S, et al. Predictors of timely follow-up after abnormal cancer screening among women seeking care at urban community health centers. Cancer 2010;116:913--21.
- Kuo T-M, Benard VB, Berkman ND, Martin CK, Richardson LC. Timing of colposcopy after cervical cytologic abnormalities. Obstet Gynecol 2010;115:629--36.
- Laiyemo AO, Doubeni C, Pinsky PF, et al. Race and colorectal cancer disparities: health-care utilization vs different cancer susceptibilities. J Natl Cancer Inst 2010;102:538--46.
- Wujcik D, Fair AM. Barriers to diagnostic resolution after abnormal mammography: a review of the literature. Cancer Nurs 2008;31:E16--30.
- Wender RC, Altshuler M. Can the medical home reduce cancer morbidity and mortality? Prim Care 2009;36:845--58.
- Patient-Centered Primary Care Collaborative. Proof in practice: a compilation of patient centered medical home pilot and demonstration projects. Washington, DC: Patient-Centered Primary Care Collaborative; 2009. Available at http://www.pcpcc.net/files/PilotGuidePip.pdf.
- National Cancer Institute. Breast Cancer Surveillance Consortium: evaluating screening performance in practice. NIH Publication No. 04-5490. 2004. Available at http://breastscreening.cancer.gov/espp.pdf.
- Goldman LE, Haneuse SJ, Miglioretti DL, et al. An assessment of the quality of mammography care at facilities treating medically vulnerable populations. Medical Care 2008;46:701--08.
- Lobb R, Allen JD, Emmons KM, Ayanian JZ. Timely care after an abnormal mammogram among low-income women in a public breast cancer screening program. Arch Intern Med 2010;170:521--28.
- Bastani R, Yabroff KR, Myers RE, Glenn B. Interventions to improve follow-up of abnormal findings in cancer screening. Cancer 2004;101:1188--200.
- CDC. National Comprehensive Cancer Control Program. Available at http://www.cdc.gov/cancer/ncccp/.
- The Patient Protection and Affordable Care Act of 2010. Pub. L. No. 111--48 (March 23, 2010), as amended through May 1, 2020. Available at http://docs.house.gov/energycommerce/ppacacom.pdf.
- Koh HK, Sebelius KG. Promoting Prevention through the Affordable Care Act. N Eng J Med 2010;363:1296--99.
- Breen N, Meissner HI. Toward a system of cancer screening in the United States: Trends and opportunities. Ann Rev Public Health 2005;26:561-82.
- Zapka JG, Lemon SC. Interventions for patients, providers, and health care organizations. Cancer 2004;101(5 Suppl):1165-1187.
* A localized cancer is one that is confined to the primary site, a regional cancer is one that has spread directly beyond the primary site or to regional lymph nodes, and a distant cancer is one that has spread to other organs.
Source: CDC's National Program of Cancer Registries (NPCR) and the National Cancer Surveillance, Epidemiology, and End Results (SEER) program.
* Rates are per 100,000 and age-adjusted to the 2000 U.S. Standard population.
† Data from NPCR and SEER registries meet U.S. Cancer Statistics publication criteria for 2004--2006 and cover approximately 96.1% of the U.S. population (29).
Alternate Text: The figure shows state data from CDC’s National Program of Cancer Registries (NPCR) and the National Cancer Surveillance, Epidemiology, and End Results (SEER) program regarding the rate per 100,000 age-adjusted U.S. population of colorectal cancer among U.S. men aged ≥50 years during 2004–2006.
FIGURE 2. Percentage of colorectal cancers diagnosed at late stage among men aged ≥50 years --- United States,* 2004--2006
Source: CDC's National Program of Cancer Registries (NPCR) and the National Cancer Surveillance, Epidemiology, and End Results (SEER) program.
* Data from NPCR and SEER registries meet U.S. Cancer Statistics publication criteria for 2004--2006 and cover approximately 96.1% of the U.S. population (29).
Alternate Text: The figure shows state data from CDC’s National Program of Cancer Registries (NPCR) and the National Cancer Surveillance, Epidemiology, and End Results (SEER) program regarding the percentage of colorectal cancers diagnosed at late stage among U.S. men aged ≥50 years during 2004–2006.
FIGURE 3. Percentage of men aged 50--75 years who had recommended colorectal cancer screening* --- Behavioral Risk Factor Surveillance System, United States, 2008
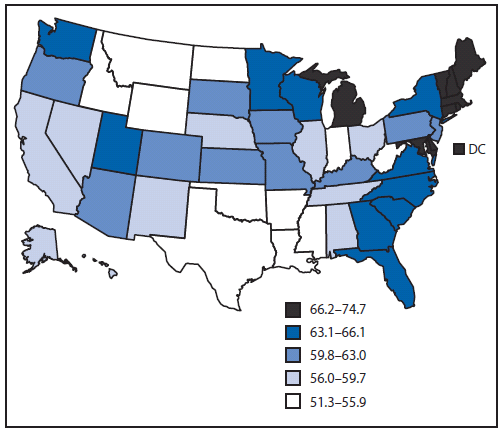
* Determined by having met the U.S. Preventive Services Task Force recommendation of having a fecal occult blood test in the past year, a flexible sigmoidoscopy in the past 5 years, or a colonoscopy in the preceding 10 years (14).
Alternate Text: The figure shows state data from the Behavioral Risk Factor Surveillance System for 2008 indicating the percentage of U.S. men aged 50–75 years who had recommended colorectal cancer screening in 2008.
FIGURE 4. Rate* of late-stage colorectal cancer among women aged ≥50 years --- United States,† 2004--2006
Source: CDC's National Program of Cancer Registries (NPCR) and the National Cancer Surveillance, Epidemiology, and End Results (SEER) program.
* Rates are per 100,000 and age-adjusted to the 2000 U.S. Standard population.
† Data from NPCR and SEER registries meet U.S. Cancer Statistics publication criteria for 2004--2006 and cover approximately 96.1% of the U.S. population (29).
Alternate Text: The figure shows state data from CDC’s National Program of Cancer Registries (NPCR) and the National Cancer Surveillance, Epidemiology, and End Results (SEER) program regarding the percentage of colorectal cancers diagnosed at late stage among U.S.women aged ≥50 years during 2004–2006.
FIGURE 5. Percentage of colorectal cancers diagnosed at late stage among women aged ≥50 years --- United States,* 2004--2006
Source: CDC's National Program of Cancer Registries (NPCR) and the National Cancer Surveillance, Epidemiology, and End Results (SEER) program.
* Data from NPCR and SEER registries meet U.S. Cancer Statistics publication criteria for 2004--2006 and cover approximately 96.1% of the U.S. population (29).
Alternate Text: The figure shows state data from CDC’s National Program of Cancer Registries (NPCR) and the National Cancer Surveillance, Epidemiology, and End Results (SEER) program regarding the percentage of colorectal cancers diagnosed at late stage among U.S. women aged ≥50 years during 2004–2006.
FIGURE 6. Percentage of women aged 50--75 years who had recommended colorectal cancer screening* --- Behavioral Risk Factor Surveillance System, United States, 2008
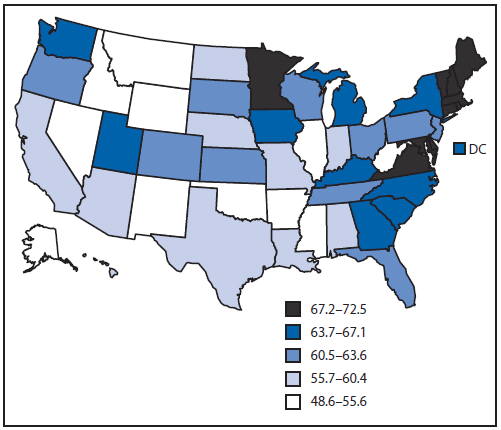
* Determined by having met the U.S. Preventive Services Task Force recommendation of having a fecal occult blood test in the past year, a flexible sigmoidoscopy in the past 5 years, or a colonoscopy in the preceding 10 years (14).
Alternate Text: The figure shows state data from the Behavioral Risk Factor Surveillance System for 2008 regarding the percentage of U.S. women aged 50–75 years who had recommended colorectal cancer screening, determined by having met the U.S. Preventive Services Task Force recommendation of having a fecal occult blood test in the past year, a flexible sigmoidoscopy in the past 5 years, or a colonoscopy in the preceding 10 years.
FIGURE 7. Rate* of late-stage invasive female breast cancer among women aged ≥50 years --- United States,† 2004--2006
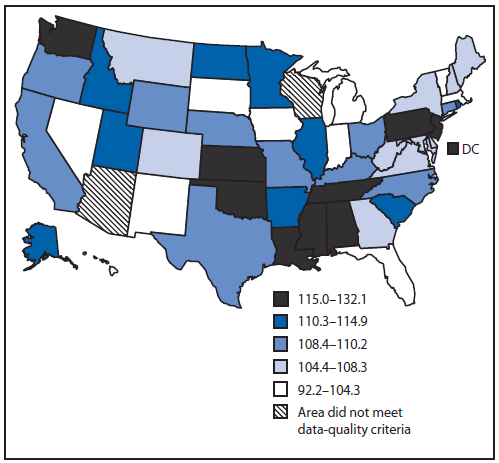
Source: CDC's National Program of Cancer Registries (NPCR) and the National Cancer Surveillance, Epidemiology, and End Results (SEER) program.
* Rates are per 100,000 and age-adjusted to the 2000 U.S. Standard population.
† Data from NPCR and SEER registries meet U.S. Cancer Statistics publication criteria for 2004--2006 and cover approximately 96.1% of the U.S. population (29).
Alternate Text: The figure shows state data from CDC’s National Program of Cancer Registries (NPCR) and the National Cancer Surveillance, Epidemiology, and End Results (SEER) program regarding the age-adjusted rate per 100,000 U.S. population of late-stage invasive female breast cancer among U.S. women aged ≥50 years during 2004–2006.
FIGURE 8. Percentage of breast cancers diagnosed at late stage among women aged ≥50 years --- United States,* 2004--2006
Source: CDC's National Program of Cancer Registries (NPCR) and the National Cancer Surveillance, Epidemiology, and End Results (SEER) program.
* Data from NPCR and SEER registries meet U.S. Cancer Statistics publication criteria for 2004--2006 and cover approximately 96.1% of the U.S. population (29).
Alternate Text: The figure shows state data from CDC’s National Program of Cancer Registries (NPCR) and the National Cancer Surveillance, Epidemiology, and End Results (SEER) program regarding the percentage of breast cancers diagnosed at late stage among U.S. women aged ≥50 years during 2004–2006.
FIGURE 9. Percentage of women aged 50--74 years who had recommended breast cancer screening* --- Behavioral Risk Factor Surveillance System, United States, 2008
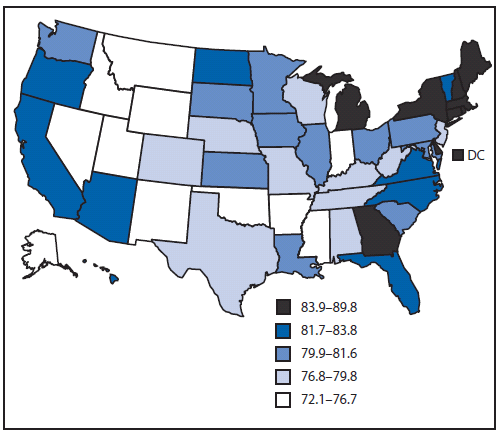
* Determined by having met the U.S. Preventive Services Task Force recommendation of having had a mammogram in the preceding 2 years (19).
Alternate Text: The figure shows state data from the Behavioral Risk Factor Surveillance System for 2008 regarding the percentage of U.S. women aged 50–74 years who had recommended breast cancer screening as determined by having met the U.S. Preventive Services Task Force recommendation of having had a mammogram in the preceding 2 years.
FIGURE 10. Rate* of late-stage invasive cervical cancer among women aged ≥20 years --- United States,† 2004--2006
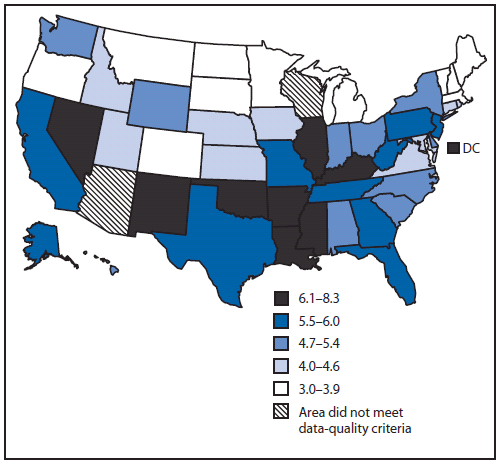
Source: CDC's National Program of Cancer Registries (NPCR) and the National Cancer Surveillance, Epidemiology, and End Results (SEER) program.
* Rates are per 100,000 and age-adjusted to the 2000 U.S. Standard population.
† Data from NPCR and SEER registries meet U.S. Cancer Statistics publication criteria for 2004--2006 and cover approximately 96.1% of the U.S. population (29).
Alternate Text: The figure shows state data from CDC’s National Program of Cancer Registries (NPCR) and the National Cancer Surveillance, Epidemiology, and End Results (SEER) program regarding the rate of late-stage invasive cervical cancer among U.S. women aged ≥20 years during 2004–2006.
FIGURE 11. Percentage of cervical cancers diagnosed at late stage among women aged ≥20 years --- United States,* 2004--2006
Source: CDC's National Program of Cancer Registries (NPCR) and the National Cancer Surveillance, Epidemiology, and End Results (SEER) program.
* Data from NPCR and SEER registries meet U.S. Cancer Statistics publication criteria for 2004--2006 and cover approximately 96.1% of the U.S. population (29).
Alternate Text: The figure shows state data from CDC’s National Program of Cancer Registries (NPCR) and the National Cancer Surveillance, Epidemiology, and End Results (SEER) program regarding the percentage of cervical cancers diagnosed at late stage U.S. among women aged ≥20 years during 2004–2006.
FIGURE 12. Percentage of women aged 21--64 years who had recommended cervical cancer screening* --- Behavioral Risk Factor Surveillance System, United States, 2008
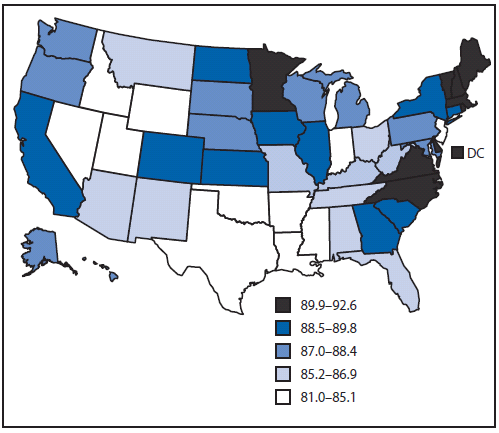
* Determined by having met the U.S. Preventive Services Task Force recommendation of having had a Pap test in the preceding 3 years (25).
Alternate Text: The figure shows state data from the Behavioral Risk Factor Surveillance System for 2008 regarding the percentage of U.S. women aged 21–64 years who had recommended cervical cancer screening as determined by having met the U.S. Preventive Services Task Force recommendation of having had a Pap test in the preceding 3 years.
|
TABLE 1. (Continued) Invasive colorectal cancer incidence,* men aged ≥50 years, by stage, age, and race/ethnicity --- United States,† 2004--2006 |
||||||||||||
|---|---|---|---|---|---|---|---|---|---|---|---|---|
|
Age group at diagnosis (yrs) |
Localized§ |
Regional§ |
Distant§ |
Unstaged |
||||||||
|
No. |
Rate |
(95% CI) |
No. |
Rate |
(95% CI) |
No. |
Rate |
(95% CI) |
No. |
Rate |
(95% CI) |
|
|
All races/ethnicities (continued) |
||||||||||||
|
≥50 |
80,911 |
77.7 |
(77.1--78.2) |
64,655 |
61.7 |
(61.2--62.2) |
34,550 |
32.5 |
(32.2--32.8) |
16,356 |
16.4 |
(16.2--16.7) |
|
50--59 |
16,078 |
30.3 |
(29.9--30.8) |
13,499 |
25.5 |
(25.0--25.9) |
8,181 |
15.4 |
(15.1--15.8) |
2,538 |
4.8 |
(4.6--5.0) |
|
60--69 |
22,159 |
71.6 |
(70.7--72.6) |
18,114 |
58.4 |
(57.6--59.3) |
10,207 |
32.8 |
(32.2--33.5) |
3,537 |
11.4 |
(11.0--11.8) |
|
70--79 |
25,777 |
129.8 |
(128.2--131.4) |
19,711 |
99.3 |
(97.9--100.7) |
9,799 |
49.3 |
(48.3--50.3) |
4,600 |
23.2 |
(22.5--23.9) |
|
≥80 |
16,897 |
156.8 |
(154.5--159.2) |
13,331 |
123.7 |
(121.6--125.8) |
6,363 |
59.2 |
(57.7--60.6) |
5,681 |
54.2 |
(52.8--55.6) |
|
White |
||||||||||||
|
≥50 |
70,150 |
77.3 |
(76.8--77.9) |
55,896 |
61.3 |
(60.8--61.8) |
28,874 |
31.3 |
(30.9--31.6) |
13,522 |
15.5 |
(15.3--15.8) |
|
50--59 |
13,093 |
29.2 |
(28.7--29.7) |
11,091 |
24.7 |
(24.3--25.2) |
6,481 |
14.4 |
(14.1--14.8) |
1,919 |
4.3 |
(4.1--4.5) |
|
60--69 |
18,849 |
70.7 |
(69.7--71.7) |
15,377 |
57.6 |
(56.6--58.5) |
8,360 |
31.2 |
(30.5--31.9) |
2,797 |
10.5 |
(10.1--10.9) |
|
70--79 |
22,775 |
130.0 |
(128.3--131.7) |
17,372 |
99.2 |
(97.7--100.7) |
8,418 |
48.0 |
(47.0--49.1) |
3,832 |
21.9 |
(21.2--22.6) |
|
≥80 |
15,433 |
159.5 |
(157.0--162.1) |
12,056 |
124.6 |
(122.4--126.8) |
5,615 |
58.2 |
(56.7--59.7) |
4,974 |
52.9 |
(51.4--54.4) |
|
Black |
||||||||||||
|
≥50 |
7,364 |
79.9 |
(78.0--81.8) |
6,282 |
67.6 |
(65.9--69.4) |
4,395 |
46.4 |
(45.0--47.9) |
1,932 |
23.1 |
(22.0--24.2) |
|
50--59 |
2,028 |
36.7 |
(35.1--38.3) |
1,768 |
32.0 |
(30.5--33.5) |
1,341 |
24.3 |
(23.0--25.6) |
414 |
7.5 |
(6.8--8.2) |
|
60--69 |
2,288 |
80.8 |
(77.6--84.2) |
1,998 |
70.3 |
(67.2--73.4) |
1,426 |
50.0 |
(47.4--52.7) |
486 |
17.1 |
(15.7--18.7) |
|
70--79 |
2,051 |
129.6 |
(124.0--135.3) |
1,647 |
103.6 |
(98.6--108.8) |
1,063 |
67.1 |
(63.1--71.3) |
531 |
34.0 |
(31.2--37.1) |
|
≥80 |
997 |
134.2 |
(126.0--142.8) |
869 |
117.0 |
(109.3--125.1) |
565 |
75.9 |
(69.7--82.4) |
501 |
68.9 |
(63.0--75.2) |
|
American Indian/Alaska Native |
||||||||||||
|
≥50 |
288 |
44.3 |
(39.0--50.2) |
246 |
36.4 |
(31.7--41.7) |
168 |
23.5 |
(19.8--27.7) |
80 |
13.7 |
(10.7--17.3) |
|
50--59 |
68 |
15.5 |
(12.1--19.7) |
78 |
17.8 |
(14.1--22.3) |
56 |
12.8 |
(9.7--16.7) |
16 |
3.6 |
(2.1--5.9) |
|
60--69 |
104 |
48.5 |
(39.6--58.8) |
79 |
35.6 |
(28.1--44.4) |
63 |
28.6 |
(21.9--36.6) |
24 |
11.3 |
(7.2--16.8) |
|
70--79 |
85 |
80.3 |
(64.1--99.5) |
58 |
55.2 |
(41.8--71.4) |
31 |
28.4 |
(19.3--40.4) |
21 |
19.6 |
(12.1--30.1) |
|
≥80 |
31 |
67.8 |
(46.0--96.5) |
31 |
67.1 |
(45.5--95.4) |
18 |
39.2 |
(23.2--62.2) |
19 |
42.1 |
(25.3--65.8) |
|
Asian/Pacific Islander |
||||||||||||
|
≥50 |
2,022 |
53.8 |
(51.4--56.3) |
1,797 |
48.3 |
(46.0--50.7) |
913 |
23.8 |
(22.3--25.5) |
314 |
9.2 |
(8.2--10.3) |
|
50--59 |
515 |
23.2 |
(21.2--25.3) |
447 |
20.1 |
(18.3--22.0) |
251 |
11.3 |
(9.9--12.8) |
55 |
2.5 |
(1.9--3.2) |
|
60--69 |
617 |
51.0 |
(47.1--55.2) |
538 |
44.5 |
(40.8--48.5) |
286 |
23.6 |
(20.9--26.5) |
90 |
7.4 |
(6.0--9.1) |
|
70--79 |
584 |
89.5 |
(82.4--97.1) |
498 |
76.1 |
(69.5--83.1) |
243 |
36.9 |
(32.4--41.9) |
78 |
12.0 |
(9.5--15.0) |
|
≥80 |
306 |
99.1 |
(88.3--110.9) |
314 |
101.5 |
(90.5--113.4) |
133 |
43.2 |
(36.2--51.3) |
91 |
30.5 |
(24.6--37.5) |
|
Hispanic |
||||||||||||
|
≥50 |
4,481 |
62.6 |
(60.7--64.6) |
4,054 |
55.9 |
(54.1--57.7) |
2,168 |
29.3 |
(28.0--30.6) |
1,018 |
15.5 |
(14.5--16.5) |
|
50--59 |
1,168 |
25.6 |
(24.1--27.1) |
1,072 |
23.5 |
(22.1--24.9) |
603 |
13.2 |
(12.2--14.3) |
237 |
5.2 |
(4.6--5.9) |
|
60--69 |
1,318 |
58.6 |
(55.4--61.8) |
1,279 |
56.7 |
(53.6--59.9) |
696 |
30.8 |
(28.5--33.1) |
238 |
10.6 |
(9.3--12.0) |
|
70--79 |
1,317 |
105.2 |
(99.6--111.1) |
1,144 |
91.8 |
(86.5--97.3) |
616 |
49.0 |
(45.2--53.0) |
270 |
21.6 |
(19.1--24.4) |
|
≥80 |
678 |
119.9 |
(111.0--129.4) |
559 |
98.9 |
(90.8--107.5) |
253 |
44.6 |
(39.3--50.5) |
273 |
49.6 |
(43.9--55.9) |
|
Abbreviation: CI = confidence interval. Source: CDC's National Program of Cancer Registries (NPCR) and the National Cancer Surveillance, Epidemiology, and End Results (SEER) program. * Rates are per 100,000 and age-adjusted to the 2000 U.S. Standard population; 95% confidence intervals were calculated as modified gamma intervals (37). † Data from NPCR and SEER registries meet U.S. Cancer Statistics publication criteria for 2004--2006 and cover approximately 96.1% of the U.S. population (29). § A localized cancer is one that is confined to the primary site, a regional cancer is one that has spread directly beyond the primary site or to regional lymph nodes, and a distant cancer is one that has spread to other organs. |
||||||||||||
|
TABLE 3. Invasive colorectal cancer incidence* among women aged ≥50 years, by stage, age, and race/ethnicity --- United States,† 2004--2006 |
|||||||
|---|---|---|---|---|---|---|---|
|
Age group at diagnosis (yrs) |
Overall |
Late (Regional + Distant)§ |
|||||
|
No. |
Rate |
(95% CI) |
No. |
Rate |
(95% CI) |
% |
|
|
All races/ethnicities |
|||||||
|
≥50 |
191,283 |
137.3 |
(136.7--137.9) |
97,588 |
70.4 |
(69.9--70.8) |
51.0 |
|
50--59 |
31,344 |
56.2 |
(55.6--56.9) |
16,968 |
30.4 |
(30.0--30.9) |
54.1 |
|
60--69 |
40,625 |
116.6 |
(115.5--117.8) |
21,838 |
62.6 |
(61.8--63.5) |
53.8 |
|
70--79 |
56,139 |
215.4 |
(213.6--217.2) |
28,664 |
110.0 |
(108.7--111.3) |
51.1 |
|
≥80 |
63,175 |
315.0 |
(312.5--317.4) |
30,118 |
150.6 |
(148.9--152.4) |
47.7 |
|
White |
|||||||
|
≥50 |
161,416 |
133.8 |
(133.1--134.4) |
82,193 |
68.6 |
(68.1--69.0) |
50.9 |
|
50--59 |
23,910 |
51.9 |
(51.2--52.5) |
13,097 |
28.4 |
(27.9--28.9) |
54.8 |
|
60--69 |
32,916 |
111.8 |
(110.6--113.0) |
17,693 |
60.0 |
(59.1--60.9) |
53.8 |
|
70--79 |
47,971 |
212.5 |
(210.6--214.5) |
24,442 |
108.4 |
(107.0--109.7) |
51.0 |
|
≥80 |
56,619 |
316.0 |
(313.4--318.6) |
26,961 |
151.0 |
(149.2--152.8) |
47.6 |
|
Black |
|||||||
|
≥50 |
22,144 |
162.5 |
(160.4--164.7) |
11,690 |
85.6 |
(84.1--87.2) |
52.8 |
|
50--59 |
5,490 |
82.7 |
(80.6--85.0) |
2,990 |
45.0 |
(43.4--46.7) |
54.5 |
|
60--69 |
5,800 |
154.8 |
(150.8--158.8) |
3,186 |
85.0 |
(82.0--88.0) |
54.9 |
|
70--79 |
5,976 |
241.1 |
(235.0--247.3) |
3,159 |
127.4 |
(123.0--132.0) |
52.9 |
|
≥80 |
4,878 |
307.0 |
(298.4--315.7) |
2,355 |
148.6 |
(142.6--154.7) |
48.3 |
|
American Indian/Alaska Native |
|||||||
|
≥50 |
713 |
90.5 |
(83.8--97.7) |
392 |
48.9 |
(44.1--54.2) |
55.0 |
|
50--59 |
185 |
39.7 |
(34.2--45.9) |
112 |
24.0 |
(19.8--28.9) |
60.5 |
|
60--69 |
197 |
83.3 |
(72.0--95.8) |
110 |
46.5 |
(38.1--56.0) |
55.8 |
|
70--79 |
208 |
158.5 |
(137.6--181.6) |
105 |
80.2 |
(65.5--97.1) |
50.5 |
|
≥80 |
123 |
156.1 |
(129.6--186.3) |
65 |
82.5 |
(63.6--105.2) |
52.8 |
|
Asian/Pacific Islander |
|||||||
|
≥50 |
4,966 |
104.3 |
(101.4--107.3) |
2,726 |
57.2 |
(55.0--59.4) |
54.9 |
|
50--59 |
1,222 |
47.7 |
(45.1--50.5) |
653 |
25.4 |
(23.5--27.4) |
53.4 |
|
60--69 |
1,241 |
89.1 |
(84.2--94.2) |
714 |
51.2 |
(47.5--55.1) |
57.5 |
|
70--79 |
1,416 |
158.2 |
(150.1--166.7) |
775 |
86.5 |
(80.5--92.8) |
54.7 |
|
≥80 |
1,087 |
231.5 |
(218.0--245.7) |
584 |
124.2 |
(114.3--134.7) |
53.7 |
|
Hispanic |
|||||||
|
≥50 |
10,047 |
110.8 |
(108.6--113.0) |
5,504 |
60.2 |
(58.6--61.8) |
54.8 |
|
50--59 |
2,342 |
49.2 |
(47.3--51.3) |
1,378 |
29.0 |
(27.5--30.5) |
58.8 |
|
60--69 |
2,645 |
99.9 |
(96.2--103.8) |
1,474 |
55.6 |
(52.8--58.5) |
55.7 |
|
70--79 |
2,828 |
169.1 |
(162.9--175.4) |
1,524 |
91.1 |
(86.6--95.8) |
53.9 |
|
≥80 |
2,232 |
236.9 |
(227.2--247.0) |
1,128 |
119.8 |
(112.9--127.0) |
50.5 |
|
See page 18 for footnotes. |
|||||||
|
TABLE 5. (Continued) Invasive breast cancer incidence* among women aged ≥50 years, by stage, age, and race/ethnicity --- United States,† 2004--2006 |
||||||||||||
|---|---|---|---|---|---|---|---|---|---|---|---|---|
|
Age group at diagnosis (yrs) |
Localized§ |
Regional§ |
Distant§ |
Unstaged |
||||||||
|
No. |
Rate |
(95% CI) |
No. |
Rate |
(95% CI) |
No. |
Rate |
(95% CI) |
No. |
Rate |
(95% CI) |
|
|
All races/ethnicities (continued) |
||||||||||||
|
≥50 |
270,898 |
199.9 |
(199.1--200.6) |
124,308 |
91.6 |
(91.1--92.1) |
23,122 |
16.9 |
(16.7--17.1) |
20,812 |
14.6 |
(14.4--14.8) |
|
50--59 |
78,682 |
141.3 |
(140.4--142.3) |
44,758 |
80.7 |
(80.0--81.5) |
6,825 |
12.2 |
(12.0--12.5) |
4,146 |
7.5 |
(7.2--7.7) |
|
60--69 |
78,532 |
224.0 |
(222.5--225.6) |
35,539 |
101.1 |
(100.1--102.2) |
6,364 |
18.1 |
(17.7--18.6) |
4,317 |
12.3 |
(12.0--12.7) |
|
70--79 |
68,981 |
265.6 |
(263.6--267.6) |
26,634 |
102.6 |
(101.4--103.8) |
5,534 |
21.3 |
(20.7--21.9) |
4,593 |
17.6 |
(17.1--18.1) |
|
≥80 |
44,703 |
226.1 |
(224.0--228.2) |
17,377 |
87.6 |
(86.3--88.9) |
4,399 |
22.1 |
(21.5--22.8) |
7,756 |
38.0 |
(37.1--38.8) |
|
White |
||||||||||||
|
≥50 |
238,740 |
206.6 |
(205.8--207.5) |
105,272 |
91.4 |
(90.8--91.9) |
18,980 |
16.3 |
(16.0--16.5) |
17,426 |
14.1 |
(13.9--14.3) |
|
50--59 |
66,787 |
145.2 |
(144.1--146.3) |
36,546 |
79.8 |
(79.0--80.6) |
5,281 |
11.5 |
(11.2--11.8) |
3,236 |
7.0 |
(6.8--7.3) |
|
60--69 |
68,926 |
232.5 |
(230.8--234.3) |
30,109 |
101.3 |
(100.2--102.5) |
5,217 |
17.6 |
(17.1--18.0) |
3,511 |
11.9 |
(11.5--12.3) |
|
70--79 |
61,994 |
276.0 |
(273.9--278.2) |
23,148 |
103.1 |
(101.8--104.5) |
4,623 |
20.6 |
(20.0--21.2) |
3,914 |
17.3 |
(16.8--17.9) |
|
≥80 |
41,033 |
232.6 |
(230.3--234.8) |
15,469 |
87.4 |
(86.0--88.8) |
3,859 |
21.7 |
(21.0--22.4) |
6,765 |
37.0 |
(36.1--37.9) |
|
Black |
||||||||||||
|
≥50 |
21,845 |
155.2 |
(153.1--157.3) |
14,356 |
100.1 |
(98.5--101.8) |
3,401 |
24.1 |
(23.3--25.0) |
2,241 |
16.2 |
(15.6--16.9) |
|
50--59 |
7,831 |
118.1 |
(115.5--120.7) |
6,033 |
91.0 |
(88.7--93.3) |
1,246 |
18.8 |
(17.7--19.8) |
565 |
8.5 |
(7.8--9.3) |
|
60--69 |
6,479 |
172.3 |
(168.1--176.5) |
4,095 |
108.6 |
(105.3--112.0) |
942 |
25.1 |
(23.5--26.7) |
513 |
13.6 |
(12.5--14.9) |
|
70--79 |
4,890 |
196.8 |
(191.3--202.4) |
2,724 |
109.7 |
(105.6--113.9) |
766 |
30.9 |
(28.7--33.1) |
460 |
18.6 |
(16.9--20.4) |
|
≥80 |
2,645 |
168.0 |
(161.7--174.6) |
1,504 |
95.2 |
(90.5--100.2) |
447 |
28.2 |
(25.7--31.0) |
703 |
43.4 |
(40.3--46.8) |
|
American Indian/Alaska Native |
||||||||||||
|
≥50 |
840 |
97.8 |
(91.0--104.9) |
457 |
51.0 |
(46.3--56.1) |
87 |
10.4 |
(8.3--12.9) |
105 |
12.9 |
(10.5--15.7) |
|
50--59 |
308 |
66.1 |
(58.9--73.9) |
198 |
42.6 |
(36.9--49.0) |
29 |
6.2 |
(4.2--8.9) |
27 |
5.8 |
(3.8--8.5) |
|
60--69 |
272 |
112.3 |
(99.3--126.6) |
142 |
58.5 |
(49.3--69.1) |
29 |
12.1 |
(8.1--17.5) |
34 |
14.0 |
(9.7--19.6) |
|
70--79 |
184 |
139.9 |
(120.4--161.7) |
75 |
55.9 |
(43.9--70.1) |
16 |
12.6 |
(7.2--20.5) |
20 |
15.1 |
(9.2--23.3) |
|
≥80 |
76 |
97.3 |
(76.6--121.9) |
42 |
53.8 |
(38.7--72.8) |
¶ |
¶ |
¶ |
24 |
30.5 |
(19.5--45.4) |
|
Asian/Pacific Islander |
||||||||||||
|
≥50 |
6,691 |
126.8 |
(123.7--129.9) |
3,121 |
58.0 |
(55.9--60.1) |
477 |
9.1 |
(8.3--10.0) |
274 |
5.5 |
(4.9--6.2) |
|
50--59 |
2,810 |
109.9 |
(105.9--114.0) |
1,507 |
59.1 |
(56.1--62.1) |
207 |
8.1 |
(7.0--9.3) |
96 |
3.7 |
(3.0--4.6) |
|
60--69 |
2,053 |
145.6 |
(139.3--152.0) |
876 |
61.8 |
(57.8--66.1) |
129 |
9.1 |
(7.6--10.8) |
72 |
5.1 |
(4.0--6.4) |
|
70--79 |
1,304 |
144.6 |
(136.8--152.6) |
511 |
56.6 |
(51.8--61.8) |
90 |
10.1 |
(8.1--12.4) |
43 |
4.8 |
(3.5--6.4) |
|
≥80 |
524 |
110.7 |
(101.4--120.6) |
227 |
48.2 |
(42.1--54.9) |
51 |
10.8 |
(8.1--14.2) |
63 |
13.6 |
(10.5--17.5) |
|
Hispanic |
||||||||||||
|
≥50 |
13,411 |
137.9 |
(135.6--140.3) |
7,461 |
74.5 |
(72.8--76.2) |
1,278 |
13.3 |
(12.5--14.0) |
1,155 |
12.4 |
(11.7--13.2) |
|
50--59 |
4,936 |
103.8 |
(100.9--106.7) |
3,326 |
69.9 |
(67.6--72.4) |
444 |
9.3 |
(8.5--10.2) |
339 |
7.1 |
(6.4--7.9) |
|
60--69 |
4,157 |
156.4 |
(151.6--161.2) |
2,191 |
82.1 |
(78.7--85.6) |
388 |
14.5 |
(13.1--16.1) |
296 |
11.1 |
(9.9--12.4) |
|
70--79 |
3,003 |
178.5 |
(172.2--185.0) |
1,377 |
81.8 |
(77.5--86.3) |
272 |
16.2 |
(14.3--18.2) |
249 |
14.9 |
(13.1--16.9) |
|
≥80 |
1,315 |
139.8 |
(132.4--147.6) |
567 |
60.4 |
(55.5--65.5) |
174 |
18.5 |
(15.8--21.4) |
271 |
28.7 |
(25.4--32.3) |
|
Abbreviation: CI = confidence interval. Source: CDC's National Program of Cancer Registries (NPCR) and the National Cancer Surveillance, Epidemiology, and End Results (SEER) program. * Rates are per 100,000 and age--adjusted to the 2000 U.S. Standard population; 95% confidence intervals were calculated as modified gamma intervals (37). † Data from NPCR and SEER registries meet U.S. Cancer Statistics publication criteria for 2004--2006 and cover approximately 96.1% of the U.S. population (29). § A localized cancer is one that is confined to the primary site, a regional cancer is one that has spread directly beyond the primary site or to regional lymph nodes, and a distant cancer is one that has spread to other organs. ¶ Data not reported when case count is <16. |
||||||||||||
|
TABLE 7. (Continued) Invasive cervical cancer incidence* among women aged ≥20 years, by stage, age, and race/ethnicity --- United States,† 2004--2006 |
||||||||||||
|---|---|---|---|---|---|---|---|---|---|---|---|---|
|
Age group at diagnosis (yrs) |
Localized§ |
Regional§ |
Distant§ |
Unstaged |
||||||||
|
No. |
Rate |
(95% CI) |
No. |
Rate |
(95% CI) |
No. |
Rate |
(95% CI) |
No. |
Rate |
(95% CI) |
|
|
All races/ethnicities (continued) |
||||||||||||
|
≥20 |
16,298 |
5.3 |
(5.2--5.4) |
13,003 |
4.0 |
(4.0--4.1) |
3,944 |
1.2 |
(1.2--1.2) |
2,808 |
0.9 |
(0.8--0.9) |
|
20--29 |
1,307 |
2.3 |
(2.2--2.4) |
388 |
0.7 |
(0.6--0.7) |
70 |
0.1 |
(0.1--0.2) |
215 |
0.4 |
(0.3--0.4) |
|
30--39 |
4,632 |
7.9 |
(7.7--8.1) |
2,018 |
3.5 |
(3.3--3.6) |
390 |
0.7 |
(0.6--0.7) |
455 |
0.8 |
(0.7--0.9) |
|
40--49 |
4,931 |
7.5 |
(7.3--7.8) |
3,284 |
5.0 |
(4.8--5.1) |
899 |
1.4 |
(1.3--1.4) |
467 |
0.7 |
(0.6--0.8) |
|
50--59 |
2,579 |
4.7 |
(4.5--4.9) |
2,956 |
5.3 |
(5.2--5.5) |
1,055 |
1.9 |
(1.8--2.0) |
453 |
0.8 |
(0.7--0.9) |
|
60--69 |
1,544 |
4.4 |
(4.2--4.6) |
2,026 |
5.8 |
(5.5--6.0) |
743 |
2.1 |
(2.0--2.3) |
398 |
1.1 |
(1.0--1.3) |
|
70--79 |
864 |
3.3 |
(3.1--3.6) |
1,413 |
5.4 |
(5.2--5.7) |
484 |
1.9 |
(1.7--2.0) |
367 |
1.4 |
(1.3--1.6) |
|
≥80 |
441 |
2.2 |
(2.0--2.4) |
918 |
4.6 |
(4.3--4.9) |
303 |
1.5 |
(1.4--1.7) |
453 |
2.2 |
(2.0--2.4) |
|
White |
||||||||||||
|
≥20 |
12,955 |
5.2 |
(5.2--5.3) |
9,902 |
3.7 |
(3.7--3.8) |
3,047 |
1.1 |
(1.1--1.2) |
2,011 |
0.7 |
(0.7--0.8) |
|
20--29 |
1,075 |
2.4 |
(2.3--2.6) |
294 |
0.7 |
(0.6--0.7) |
59 |
0.1 |
(0.1--0.2) |
162 |
0.4 |
(0.3--0.4) |
|
30--39 |
3,835 |
8.4 |
(8.1--8.7) |
1,594 |
3.5 |
(3.3--3.7) |
315 |
0.7 |
(0.6--0.8) |
325 |
0.7 |
(0.6--0.8) |
|
40--49 |
3,917 |
7.5 |
(7.2--7.7) |
2,460 |
4.6 |
(4.5--4.8) |
682 |
1.3 |
(1.2--1.4) |
316 |
0.6 |
(0.5--0.7) |
|
50--59 |
1,982 |
4.4 |
(4.2--4.6) |
2,269 |
5.0 |
(4.8--5.2) |
842 |
1.8 |
(1.7--2.0) |
315 |
0.7 |
(0.6--0.8) |
|
60--69 |
1,186 |
4.0 |
(3.8--4.2) |
1,556 |
5.2 |
(5.0--5.5) |
556 |
1.9 |
(1.7--2.0) |
269 |
0.9 |
(0.8--1.0) |
|
70--79 |
627 |
2.8 |
(2.6--3.0) |
1,044 |
4.7 |
(4.4--5.0) |
350 |
1.6 |
(1.4--1.7) |
265 |
1.2 |
(1.0--1.3) |
|
≥80 |
333 |
1.9 |
(1.7--2.1) |
685 |
3.9 |
(3.6--4.2) |
243 |
1.4 |
(1.2--1.6) |
359 |
2.0 |
(1.8--2.2) |
|
Black |
||||||||||||
|
≥20 |
2,181 |
5.5 |
(5.3--5.7) |
2,274 |
5.9 |
(5.6--6.1) |
729 |
1.9 |
(1.8--2.1) |
506 |
1.3 |
(1.2--1.5) |
|
20--29 |
149 |
1.7 |
(1.4--2.0) |
79 |
0.9 |
(0.7--1.1) |
¶ |
¶ |
¶ |
27 |
0.3 |
(0.2--0.4) |
|
30--39 |
502 |
5.9 |
(5.4--6.4) |
313 |
3.7 |
(3.3--4.1) |
61 |
0.7 |
(0.6--0.9) |
69 |
0.8 |
(0.6--1.0) |
|
40--49 |
641 |
7.2 |
(6.6--7.7) |
610 |
6.8 |
(6.2--7.3) |
170 |
1.9 |
(1.6--2.2) |
97 |
1.1 |
(0.9--1.3) |
|
50--59 |
394 |
6.0 |
(5.4--6.6) |
502 |
7.6 |
(6.9--8.3) |
176 |
2.7 |
(2.3--3.1) |
75 |
1.1 |
(0.9--1.4) |
|
60--69 |
256 |
6.8 |
(6.0--7.7) |
329 |
8.7 |
(7.8--9.7) |
155 |
4.1 |
(3.5--4.8) |
87 |
2.3 |
(1.9--2.9) |
|
70--79 |
157 |
6.3 |
(5.4--7.4) |
265 |
10.7 |
(9.4--12.1) |
109 |
4.4 |
(3.6--5.3) |
75 |
3.0 |
(2.4--3.8) |
|
≥80 |
82 |
5.2 |
(4.1--6.5) |
176 |
11.1 |
(9.5--12.9) |
51 |
3.2 |
(2.4--4.2) |
76 |
4.7 |
(3.7--5.9) |
|
American Indian/Alaska Native |
||||||||||||
|
≥20 |
112 |
3.9 |
(3.2--4.7) |
92 |
3.5 |
(2.8--4.3) |
21 |
0.8 |
(0.5--1.3) |
¶ |
¶ |
¶ |
|
20--29 |
16 |
2.4 |
(1.4--3.9) |
¶ |
¶ |
¶ |
¶ |
¶ |
¶ |
¶ |
¶ |
¶ |
|
30--39 |
41 |
7.0 |
(5.0--9.5) |
18 |
3.1 |
(1.8--4.9) |
¶ |
¶ |
¶ |
¶ |
¶ |
¶ |
|
40--49 |
33 |
5.3 |
(3.6--7.4) |
25 |
4.0 |
(2.6--5.9) |
¶ |
¶ |
¶ |
¶ |
¶ |
¶ |
|
50--59 |
¶ |
¶ |
¶ |
19 |
4.1 |
(2.5--6.4) |
¶ |
¶ |
¶ |
¶ |
¶ |
¶ |
|
60--69 |
¶ |
¶ |
¶ |
16 |
6.4 |
(3.7--10.5) |
¶ |
¶ |
¶ |
¶ |
¶ |
¶ |
|
70--79 |
¶ |
¶ |
¶ |
¶ |
¶ |
¶ |
¶ |
¶ |
¶ |
¶ |
¶ |
¶ |
|
≥80 |
¶ |
¶ |
¶ |
¶ |
¶ |
¶ |
¶ |
¶ |
¶ |
¶ |
¶ |
¶ |
|
Asian/Pacific Islander |
||||||||||||
|
≥20 |
710 |
4.7 |
(4.3--5.1) |
609 |
4.3 |
(4.0--4.7) |
133 |
0.9 |
(0.8--1.1) |
80 |
0.6 |
(0.4--0.7) |
|
20--29 |
20 |
0.6 |
(0.4--0.9) |
¶ |
¶ |
¶ |
¶ |
¶ |
¶ |
¶ |
¶ |
¶ |
|
30--39 |
148 |
3.9 |
(3.3--4.6) |
69 |
1.8 |
(1.4--2.3) |
¶ |
¶ |
¶ |
¶ |
¶ |
¶ |
|
40--49 |
241 |
7.3 |
(6.4--8.2) |
152 |
4.6 |
(3.9--5.4) |
37 |
1.1 |
(0.8--1.5) |
18 |
0.5 |
(0.3--0.9) |
|
50--59 |
141 |
5.5 |
(4.7--6.5) |
137 |
5.4 |
(4.5--6.3) |
30 |
1.2 |
(0.8--1.7) |
22 |
0.9 |
(0.5--1.3) |
|
60--69 |
79 |
5.5 |
(4.4--6.9) |
109 |
7.8 |
(6.4--9.4) |
26 |
1.8 |
(1.2--2.7) |
¶ |
¶ |
¶ |
|
70--79 |
59 |
6.5 |
(4.9--8.4) |
88 |
9.8 |
(7.8--12.0) |
21 |
2.4 |
(1.5--3.6) |
¶ |
¶ |
¶ |
|
≥80 |
22 |
4.7 |
(2.9--7.0) |
46 |
9.7 |
(7.1--13.0) |
¶ |
¶ |
¶ |
¶ |
¶ |
¶ |
|
Hispanic |
||||||||||||
|
≥20 |
2,644 |
7.5 |
(7.2--7.8) |
2,122 |
6.8 |
(6.5--7.1) |
463 |
1.5 |
(1.4--1.7) |
402 |
1.3 |
(1.2--1.5) |
|
20--29 |
244 |
2.4 |
(2.1--2.7) |
80 |
0.8 |
(0.6--1.0) |
22 |
0.2 |
(0.1--0.3) |
42 |
0.4 |
(0.3--0.6) |
|
30--39 |
824 |
8.8 |
(8.2--9.4) |
410 |
4.4 |
(4.0--4.9) |
66 |
0.7 |
(0.5--0.9) |
83 |
0.9 |
(0.7--1.1) |
|
40--49 |
799 |
10.6 |
(9.9--11.4) |
597 |
8.0 |
(7.3--8.6) |
125 |
1.7 |
(1.4--2.0) |
70 |
0.9 |
(0.7--1.2) |
|
50--59 |
397 |
8.4 |
(7.5--9.2) |
456 |
9.6 |
(8.7--10.5) |
101 |
2.1 |
(1.7--2.6) |
68 |
1.4 |
(1.1--1.8) |
|
60--69 |
222 |
8.3 |
(7.3--9.5) |
303 |
11.4 |
(10.1--12.7) |
73 |
2.7 |
(2.2--3.5) |
41 |
1.5 |
(1.1--2.1) |
|
70--79 |
119 |
7.0 |
(5.8--8.4) |
184 |
10.9 |
(9.4--12.6) |
43 |
2.6 |
(1.9--3.5) |
57 |
3.4 |
(2.5--4.4) |
|
≥80 |
39 |
4.2 |
(3.0--5.7) |
92 |
9.8 |
(7.9--12.0) |
33 |
3.5 |
(2.4--4.9) |
41 |
4.4 |
(3.1--5.9) |
|
Abbreviation: CI = confidence interval. Source: CDC's National Program of Cancer Registries (NPCR) and the National Cancer Surveillance, Epidemiology, and End Results (SEER) program. * Rates are per 100,000 and age-adjusted to the 2000 U.S. Standard population; 95% confidence intervals were calculated as modified gamma intervals (37). † Data from NPCR and SEER registries meet U.S. Cancer Statistics publication criteria for 2004--2006 and cover approximately 96.1% of the U.S. population (29). § A localized cancer is one that is confined to the primary site, a regional cancer is one that has spread directly beyond the primary site or to regional lymph nodes, and a distant cancer is one that has spread to other organs. ¶ Data not reported when case count <16. ** Statistic could not be calculated. |
||||||||||||
Use of trade names and commercial sources is for identification only and does not imply endorsement by the U.S. Department of
Health and Human Services.
References to non-CDC sites on the Internet are
provided as a service to MMWR readers and do not constitute or imply
endorsement of these organizations or their programs by CDC or the U.S.
Department of Health and Human Services. CDC is not responsible for the content
of pages found at these sites. URL addresses listed in MMWR were current as of
the date of publication.
All MMWR HTML versions of articles are electronic conversions from typeset documents.
This conversion might result in character translation or format errors in the HTML version.
Users are referred to the electronic PDF version (http://www.cdc.gov/mmwr)
and/or the original MMWR paper copy for printable versions of official text, figures, and tables.
An original paper copy of this issue can be obtained from the Superintendent of Documents, U.S.
Government Printing Office (GPO), Washington, DC 20402-9371;
telephone: (202) 512-1800. Contact GPO for current prices.
**Questions or messages regarding errors in formatting should be addressed to
mmwrq@cdc.gov.
