Persons using assistive technology might not be able to fully access information in this file. For assistance, please send e-mail to: mmwrq@cdc.gov. Type 508 Accommodation and the title of the report in the subject line of e-mail.
Increasing Prevalence of Diagnosed Diabetes — United States and Puerto Rico, 1995–2010
In 2010, an estimated 18.8 million persons in the United States had diagnosed diabetes mellitus and another 7.0 million had undiagnosed diabetes (1). Since 1990, the prevalence of diagnosed diabetes in the United States has risen sharply (2,3) among all age groups, both sexes, and all racial/ethnic groups for which data are available (2). To learn whether the increase has been greater in some regions of the United States than in others, data on self-reported diabetes in adults collected during 1995–2010 by the Behavioral Risk Factor Surveillance System (BRFSS) were analyzed. The analysis showed that the age-adjusted prevalence of diagnosed diabetes increased during the interval in every state, the District of Columbia (DC), and Puerto Rico. In 1995, age-adjusted prevalence was ≥6% in only three states, DC, and Puerto Rico, but by 2010 it was ≥6% in every state, DC, and Puerto Rico, and ≥10.0% in six states and Puerto Rico. Strategies to prevent diabetes and its preventable risk factors are needed, especially for those at highest risk for diabetes, to slow the rise in diabetes prevalence across the United States. Continued surveillance of diabetes prevalence and incidence, its risk factors, and prevention efforts is important to measure progress of prevention efforts.
Trends from 1995–2010 were assessed using BRFSS data. Because of changes to BRFSS methods,* 2011 data were not included. BRFSS, a collaborative project of CDC and U.S. states and territories, collects information on health behaviors and conditions using state-based, ongoing, random-digit–dialed telephone surveys of noninstitutionalized U.S. civilian adults aged ≥18 years. The annual median response rate during the period studied ranged from 68.4% (1995) to 54.6% (2010). State sample sizes ranged from 1,193 in Montana to 5,107 in Maryland (1995), and from 1,964 in Alaska to 35,109 in Florida (2010). For each year of 1995–2010, the prevalence of diagnosed diabetes was calculated as the percentage of the population answering "yes" to the question, "Have you ever been told by a doctor that you have diabetes?" Women who had been told that they had diabetes only during pregnancy and respondents told they had prediabetes or borderline diabetes were not considered to have diabetes. Sampling weights and statistical software that account for the complex sampling design of BRFSS were used to estimate state prevalence and median prevalence by U.S. Census region.† Estimates were age-adjusted using the 2000 U.S. standard population and trends analyzed by state, territory, and U.S. Census region. State-specific and regional trends in age-adjusted diagnosed diabetes prevalence incorporating all 16 years of BRFSS data were assessed using least squares regression. Linear and quadratic terms for time (year of survey) were included in the models. The p-value for each overall model was <0.001.
During 1995–2010, the age-adjusted prevalence of diagnosed diabetes among U.S. adults increased in all geographic areas, with the median prevalence for all states, DC, and Puerto Rico increasing from 4.5% to 8.2% (Table). In 1995, age-adjusted prevalence was ≥6% in only three states, DC, and Puerto Rico, but, by 2010, it was ≥6% in all areas (Table, Figure 1). In 2010, median age-adjusted prevalence was highest among states in the South (9.8%) versus states in the Midwest (7.5%), Northeast (7.3%), and West (7.3%). In 2010, age-adjusted prevalence was highest (≥10.0%) in Alabama, Mississippi, Puerto Rico, South Carolina, Tennessee, Texas, and West Virginia, and lowest (6.0%–6.9%) in 12 states: Alaska, Colorado, Connecticut, Iowa, Minnesota, Montana, North Dakota, Oregon, South Dakota, Wisconsin, Vermont, and Wyoming.
During 1995–2010, the relative increase in age-adjusted prevalence of diabetes ranged from 8.5% in Puerto Rico to 226.7% in Oklahoma, with an overall median increase of 82.2%. The age-adjusted prevalence increased by ≥50% in 42 states and by ≥100% in 18 states. States in the South had the largest relative increase in prevalence, with the age-adjusted median increasing >100% (Table, Figure 2). The next largest increase was seen in the West, where the median increased 82.5%, followed by a 66.7% increase in the Midwest and a 62.2% increase in the Northeast.
Reported by
Linda S. Geiss, MA, Yanfeng Li, MD, Karen Kirtland, PhD, Lawrence Barker, PhD, Nilka R. Burrows, MPH, Edward W. Gregg, PhD, Div of Diabetes Translation, National Center for Chronic Disease Prevention and Health Promotion, CDC. Corresponding contributor: Linda S. Geiss, lgeiss@cdc.gov, 770-488-1056.
Editorial Note
This report documents the substantial increase in the prevalence of diagnosed diabetes throughout the 50 states, DC, and Puerto Rico over a 16-year period (1995–2010). Although the rate of increase was not uniform, the age-adjusted prevalence increased by >50% in most states and by ≥100% in 18 states.
This increase is likely the result of improved survival of persons with diabetes and increasing diabetes incidence. Nationally representative data (4) suggest that mortality among U.S. adults with diabetes declined substantially between 1997 and 2006, and at a faster rate than among adults without diabetes. This trend is paralleled by improvements in the health of persons with diabetes, including lower levels of risk factors for complications (e.g., hyperglycemia and uncontrolled blood pressure), decreased rates of complications associated with increased risk of death, and improvements in quality of care and medical treatments (5–7).
The major driver of the increase in diabetes prevalence is the increase in the incidence of diabetes in the United States since 1990 (2,3). Increasing incidence might be the result of many factors, including changes in diagnostic criteria, enhanced detection of undiagnosed diabetes, demographic changes in the U.S. population (e.g., aging of the population and growth of minority populations who are at greater risk for diabetes), and an increase in the prevalence of risk factors for the development of diabetes (e.g., obesity and sedentary lifestyle). Although the contribution of each factor to increasing diabetes incidence cannot be discerned, the increase in diabetes prevalence coincides with the increase in obesity prevalence across the United States (3,8,9).§
The prevalence of diagnosed diabetes is highest in southern and Appalachian states (3,9,10), and it is increasing rapidly in these areas. This might be because of the greater prevalence of risk factors for diabetes (e.g., obesity and sedentary lifestyle), a larger proportion of African American ancestry in the population, and cultural and other factors that contribute to poor nutrition and unhealthy lifestyles (9,10).¶
The findings in this report are subject to at least three limitations. First, during the period of study, BRFSS data were limited to adults living in noninstitutional households who had landline telephones. These sample restrictions, declining response rates (54.6% in 2010), and increases over time in the number of households with only cellular telephones might have biased the analysis of diabetes trends. However, the trends presented here are consistent with national survey data, which also have shown dramatic increases in diagnosed diabetes in the United States during this same period (2). Second, although the validity of self-reported diabetes is high for diagnosed diabetes, approximately one quarter of all adults with diabetes are undiagnosed (1) and therefore, not included in prevalence estimates. Finally, these estimates of diagnosed diabetes do not differentiate between type 1 and type 2 diabetes. However, because type 2 diabetes accounts for 90%–95% of all diabetes (1), the results presented should reflect type 2 diabetes trends.
Strategies that target the entire population and high-risk groups are needed to reverse the trend of increasing diabetes prevalence. An example of an approach for persons at high-risk is the CDC-led National Diabetes Prevention Program,** a public-private partnership of community organizations, private insurers, employers, health-care organizations, and government agencies. With the goal of preventing or delaying the onset of type 2 diabetes in high-risk persons, the National Diabetes Prevention Program supports the nationwide implementation of evidence-based, community, lifestyle programs that promote modest weight loss, good nutritional practices, and increased physical activity among persons at high risk. Continued surveillance of diabetes prevalence and incidence, its risk factors, and prevention efforts is important to measure progress toward reducing the incidence of diabetes across the United States.
References
- CDC. National diabetes fact sheet: national estimates and general information on diabetes and prediabetes in the United States, 2011. Atlanta, GA: US Department of Health and Human Services, CDC; 2011. Available at http://www.cdc.gov/diabetes/pubs/factsheet11.htm. Accessed September 20, 2012.
- CDC. Diabetes data and trends. Atlanta, GA: US Department of Health and Human Services, CDC, National Diabetes Surveillance System. Available at www.cdc.gov/diabetes/statistics. Accessed November 8, 2012.
- Geiss LS, Cowie C. Type 2 diabetes and persons at high risk of diabetes. In: Venkat Narayan KM, Williams D, Gregg EW, Cowie C, eds. Diabetes public health: from data to policy. New York, NY: Oxford University Press; 2011:15–32.
- Gregg EW, Cheng YJ, Saydah S, et al. Trends in death rates among U.S. adults with and without diabetes between 1997 and 2006. Findings from the National Health Interview Survey. Diabetes Care 2012;35:1252–7.
- Li Y, Burrows NR, Gregg EW, Albright A, Geiss LS. Declining rates of hospitalization for nontraumatic lower-extremity amputation in the diabetic population aged 40 years or older: U.S., 1988–2008. Diabetes Care 2012;35:273–7.
- CDC. Incidence of end-stage renal disease attributed to diabetes among persons with diagnosed diabetes—United States and Puerto Rico, 1996–2007. MMWR 2010;59:1361–6.
- Saaddine JB, Cadwell B, Gregg EW, et al. Improvements in diabetes processes of care and intermediate outcomes: United States, 1988–2002. Ann Intern Med 2006;144:465–74.
- Mokdad AH, Ford ES, Bowman BA, et al. Diabetes trends in the U.S.: 1990–1998. Diabetes Care 2000;23:1278–83.
- CDC. Estimated county-level prevalence of diabetes and obesity—United States, 2007. MMWR 2009;58:1259–63.
- Barker LE, Kirtland KA, Gregg EW, Geiss LS, Thompson TJ. Geographic distribution of diagnosed diabetes in the U.S. A diabetes belt. Am J Prev Med 2011;40:434–9.
* Information about changes to BRFSS is available at http://www.cdc.gov/surveillancepractice/reports/brfss/brfss_faqs.html.
† Northeast: Connecticut, Maine, Massachusetts, New Hampshire, New Jersey, New York, Pennsylvania, Rhode Island, and Vermont; Midwest: Illinois, Indiana, Iowa, Kansas, Michigan, Minnesota, Missouri, Nebraska, North Dakota, Ohio, South Dakota, and Wisconsin; South: Alabama, Arkansas, Delaware, District of Columbia, Florida, Georgia, Kentucky, Louisiana, Maryland, Mississippi, North Carolina, Oklahoma, South Carolina, Tennessee, Texas, Virginia, and West Virginia; West: Alaska, Arizona, California, Colorado, Hawaii, Idaho, Montana, Nevada, New Mexico, Oregon, Utah, Washington, and Wyoming.
§ Interactive motion charts showing the concomitant growth of diabetes and obesity over time across the United States and within states are available at http://www.cdc.gov/diabetes/atlas.
¶ Interactive atlases showing the distribution and trends of diabetes prevalence, diabetes incidence, obesity, and leisure-time physical inactivity across the United States and within states are available at http://www.cdc.gov/diabetes/atlas.
** Additional information available at http://www.cdc.gov/diabetes/prevention/index.htm.
What is already known on this topic?
In 2010, an estimated 18.8 million persons in the United States had diagnosed diabetes and another 7.0 million had undetected diabetes. Prevalence of diagnosed diabetes in the United States has been rising sharply since 1990 among all age groups, both sexes, and in all racial/ethnic groups for which data are available.
What is added by this report?
Based on self-reported data collected during 1995–2010 by the Behavioral Risk Factor Surveillance System, the median age-adjusted prevalence of diagnosed diabetes for all states, District of Columbia (DC), and Puerto Rico increased from 4.5% to 8.2%. In 1995, age-adjusted prevalence was ≥6% in only three states, DC, and Puerto Rico; by 2010 it was ≥6.0% in all states, DC, and Puerto Rico, and ≥10.0% in six states and Puerto Rico.
What are the implications for public health practice?
Strategies to prevent diabetes and its risk factors, both in the general population and among those at high risk for developing diabetes, are needed to reverse the persistent and ubiquitous upward trend of diabetes prevalence in the United States.
|
TABLE. (Continued) Age-adjusted prevalence* of diagnosed diabetes† among adults aged ≥18 years, by U.S. Census region and state — Behavioral Risk Factor Surveillance System (BRFSS), United States,§ 1995–2010¶ |
|||||||||
|---|---|---|---|---|---|---|---|---|---|
|
Region/State |
1995** |
2000 |
2005 |
2010 |
% change (1995–2010) |
||||
|
% |
(95% CI) |
% |
(95% CI) |
% |
(95% CI) |
% |
(95% CI) |
||
|
West (median) |
4.0 |
(3.6–4.8) |
5.5 |
(5.0–6.1) |
6.5 |
(6.0–6.9) |
7.3 |
(6.7–7.8) |
82.5 |
|
Alaska |
4.2 |
(2.6–6.7) |
4.4 |
(3.2–6.0) |
5.6 |
(4.4–7.3) |
6.0 |
(4.7–7.7) |
42.9 |
|
Arizona |
4.8 |
(3.5–6.6) |
5.9 |
(4.2–8.3) |
7.3 |
(6.1–8.7) |
7.5 |
(6.6–8.6) |
56.3 |
|
California |
6.2 |
(4.8–7.8) |
7.1 |
(6.0–8.4) |
7.4 |
(6.5–8.3) |
8.6 |
(8.1–9.1) |
38.7 |
|
Colorado |
3.7 |
(2.9–4.8) |
5.2 |
(4.2–6.5) |
5.1 |
(4.6–5.7) |
6.1 |
(5.6–6.6) |
64.9 |
|
Hawaii |
3.5 |
(2.6–4.5) |
5.1 |
(4.5–5.9) |
7.0 |
(6.2–7.8) |
7.6 |
(6.9–8.5) |
117.1 |
|
Idaho |
3.6 |
(2.9–4.4) |
4.8 |
(4.1–5.5) |
6.8 |
(6.2–7.6) |
7.7 |
(7.0–8.5) |
113.9 |
|
Montana |
2.9 |
(2.1–4.0) |
4.5 |
(3.7–5.4) |
5.2 |
(4.6–6.0) |
6.3 |
(5.5–7.1) |
117.2 |
|
Nevada |
5.0 |
(3.9–6.5) |
6.8 |
(5.1–9.0) |
7.1 |
(6.1–8.4) |
8.4 |
(7.2–9.7) |
68.0 |
|
New Mexico |
5.7 |
(4.4–7.3) |
6.6 |
(5.7–7.6) |
7.0 |
(6.3–7.8) |
8.0 |
(7.3–8.7) |
40.4 |
|
Oregon |
4.0 |
(3.3–4.8) |
5.8 |
(5.0–6.7) |
6.5 |
(6.0–6.9) |
6.6 |
(6.0–7.2) |
65.0 |
|
Utah |
4.2 |
(3.3–5.4) |
5.7 |
(4.7–7.0) |
6.4 |
(5.7–7.2) |
7.3 |
(6.7–7.9) |
73.8 |
|
Washington |
3.1 |
(2.6–3.8) |
5.5 |
(4.8–6.4) |
6.3 |
(6.0–6.7) |
7.3 |
(6.9–7.8) |
135.5 |
|
Wyoming |
3.3 |
(2.6–4.2) |
5.0 |
(4.1–6.0) |
6.3 |
(5.7–7.0) |
6.8 |
(6.1–7.4) |
106.1 |
|
Puerto Rico |
11.7 |
(10.1–13.4) |
9.3 |
(8.3–10.4) |
12.5 |
(11.4–13.6) |
12.7 |
(11.6–13.9) |
8.5 |
|
Abbreviation: CI = confidence interval. * Age-adjusted to the 2000 U.S. standard population; weighted estimates. † Respondents were asked, "Has a doctor, nurse, or other health professional ever told you that you had diabetes?" Refused, "don't know," and missing responses were excluded from analyses. Women who were told they had diabetes only during pregnancy were considered not to have diabetes. § Includes the District of Columbia and Puerto Rico. ¶ Incorporating all 16 years of BRFSS data, state-specific and regional trends in age-adjusted diagnosed diabetes prevalence were assessed using least squares regression. Linear and quadratic terms for time were included in the models. The p-value for each overall model was <0.001. Nonsignificant quadratic terms were dropped from the models. Quadratic trends were significant for the District of Columbia (p=0.002), Maine (p=0.05), Montana (p=0.04), New York (p=0.003), North Carolina (p=0.002), Oregon (p=0.01), South Carolina (p=0.02), South Dakota (p=0.003), Washington (p=0.001), West Virginia (p=0.004), and Puerto Rico (p=0.03), and the Northeast (p=0.02) and South (p=0.02) U.S. Census regions. ** Estimates for the District of Columbia and Puerto Rico used 1996 data. |
|||||||||
FIGURE 1. Age-adjusted prevalence (%) of diagnosed diabetes among adults aged ≥18 years — Behavioral Risk Factor Surveillance System, United States, 2010
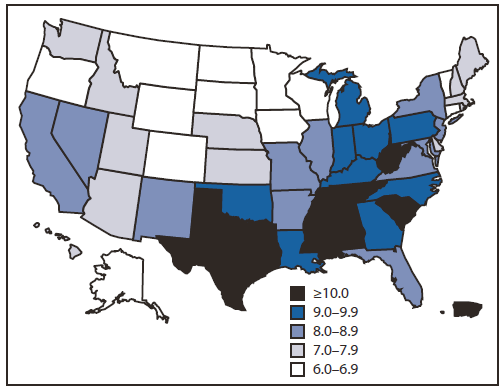
Alternate Text: The figure above shows age-adjusted prevalence of diagnosed diabetes among adults aged ≥18 years in the United States during 2010. In 1995, age-adjusted prevalence was ≥6% in only three states, DC, and Puerto Rico, but, by 2010, it was ≥6% in all areas.
FIGURE 2. Percentage change in age-adjusted prevalence of diagnosed diabetes among adults aged ≥18 years — Behavioral Risk Factor Surveillance System, United States,1995–2010
Alternate Text: The figure above shows the percent change in age-adjusted prevalence of diagnosed diabetes among adults aged ≥18 years in the United States, during1995-2010. During 1995-2010, the relative increase in age-adjusted prevalence of diabetes ranged from 8.5% in Puerto Rico to >225% in Oklahoma, with an overall median increase of 82.2%. The age-adjusted prevalence increased by ≥50% in 42 states and by ≥100% in 18 states. States in the South had the largest relative increase in prevalence, with the age-adjusted median increasing >100%.
Use of trade names and commercial sources is for identification only and does not imply endorsement by the U.S. Department of
Health and Human Services.
References to non-CDC sites on the Internet are
provided as a service to MMWR readers and do not constitute or imply
endorsement of these organizations or their programs by CDC or the U.S.
Department of Health and Human Services. CDC is not responsible for the content
of pages found at these sites. URL addresses listed in MMWR were current as of
the date of publication.
All MMWR HTML versions of articles are electronic conversions from typeset documents.
This conversion might result in character translation or format errors in the HTML version.
Users are referred to the electronic PDF version (http://www.cdc.gov/mmwr)
and/or the original MMWR paper copy for printable versions of official text, figures, and tables.
An original paper copy of this issue can be obtained from the Superintendent of Documents, U.S.
Government Printing Office (GPO), Washington, DC 20402-9371;
telephone: (202) 512-1800. Contact GPO for current prices.
**Questions or messages regarding errors in formatting should be addressed to
mmwrq@cdc.gov.
