Persons using assistive technology might not be able to fully access information in this file. For assistance, please send e-mail to: mmwrq@cdc.gov. Type 508 Accommodation and the title of the report in the subject line of e-mail.
Prevalence of Stroke — United States, 2006–2010
In 2008, mortality from stroke was the fourth leading cause of death in the United States, and stroke was a leading cause of long-term severe disability (1). Nearly half of older stroke survivors experience moderate to severe disability (2). Care for stroke survivors cost an estimated $18.8 billion in the United States during 2008, and lost productivity and premature mortality cost an additional $15.5 billion (3). A 3.6% decline in stroke mortality during 2007–2008 (1,4) means that the prevalence of stroke (defined in this report as the percentage of noninstitutionalized persons who have ever experienced stroke) will increase if stroke incidence and the mean length of post-stroke survival does not decrease and the proportion of institutionalized stroke survivors does not change. Measuring the prevalence of stroke at the state level enables CDC and state health officials to target resources to populations or regions with high prevalence. A previous report of state-level stroke prevalence used 2005 Behavioral Risk Factor Surveillance System (BRFSS) data (5). To measure recent trends in stroke prevalence by sociodemographic characteristics and state of residence, CDC analyzed 2006–2010 data from BRFSS. This report describes the results of that analysis, which indicated that during this period, overall self-reported stroke prevalence did not change. However, consistent with findings in the previous report, there were disparities in stroke prevalence identified by age, race/ethnicity, and level of education (4). Specifically, older adults, blacks, American Indians/Alaska Natives, persons with lower levels of education, and persons living in the southeastern United States had higher stroke prevalence.
BRFSS is a state-based surveillance system. Each year, state health departments (with assistance from CDC) conduct random-digit–dialed, landline telephone surveys of the noninstitutionalized civilian population aged ≥18 years in all 50 states, the District of Columbia (DC), Puerto Rico, Guam, and the U.S. Virgin Islands.* Median response rates during 2006–2010 ranged from 50.6% to 54.6%. Since 2005, the core component of the survey has included a cardiovascular disease section, which includes one question related to stroke: "Has a doctor, nurse, or other health professional ever told you that you had stroke?" Participants who answered "yes" to this question were defined as having self-reported stroke. Participants were excluded if they answered "don't know" or refused to answer this question. Stroke prevalence was calculated based on the proportion of the population answering "yes." Data on the following sociodemographic characteristics were obtained from BRFSS core questions and included in this analysis: age group (18–44 years, 45–64 years, and ≥65 years), sex, race/ethnicity (white, black, Hispanic, Asian or Native Hawaiian/Other Pacific Islander [Asian/NHOPI], and American Indian/Alaska Native),† level of education, and state of residence.
Data analyses were conducted using statistical software. Sample weights were applied in all analyses to account for the probability of nonresponse and noncoverage in the complex sampling design. Age-adjusted prevalence of stroke was estimated using the 2000 U.S. standard population (6). Linear trends across survey periods were assessed using orthogonal polynomial coefficients, and results with a p-value <0.05 were considered significant.
The total number of BRFSS participants ranged from 347,790 in 2006 to 444,927 in 2010 from all 50 states and DC. The sample size for states (including DC) ranged from 1,964 (Alaska, 2010) to 39,549 (Florida, 2007).
Age-adjusted prevalence of stroke was 2.7% in 2006 and 2.6% in 2010 (p for trend = 0.05). A nearly 10-fold difference in stroke prevalence estimates was observed between persons aged ≥65 years and those aged 18–44 years, and this pattern appeared to be consistent over the entire study period (Table 1). Among racial/ethnic groups, age-adjusted prevalence was highest among American Indians/Alaska Natives and lowest among Asians/NHOPIs. Age-adjusted prevalence was higher among adults with a lower level of education compared with those with a higher level of education. From 2006 to 2010, no statistically significant change in stroke prevalence was observed among women or among any particular age group, race/ethnicity, or level of education. For men, prevalence declined from 2.8% in 2006 to 2.5% in 2009, and then increased to 2.7% in 2010 (p for trend <0.01) (Table 1).
In 2006, age-adjusted stroke prevalence ranged from 1.8% (Colorado, Massachusetts, North Dakota and Vermont) to 4.4% (Alabama). In 2010, age-adjusted stroke prevalence ranged from 1.5% in Connecticut to 4.1% in Alabama (Table 2). From 2006 to 2010, only two states had a significant decline in stroke prevalence: Georgia, from 3.3% to 2.8% (p for trend <0.01) and South Dakota, from 2.2% to 1.8% (p for trend = 0.04). In 2010, the states with higher stroke prevalence generally were states in the southeastern United States and Nevada (Figure).
Reported by
Jing Fang, MD, Kate M. Shaw, MS, Mary G. George, MD, Div for Heart Disease and Stroke Prevention, National Center for Chronic Disease Prevention and Health Promotion, CDC. Corresponding contributor: Jing Fang, jfang@cdc.gov, 770-488-5142.
Editorial Note
In 2007, CDC reported state-specific stroke prevalence based on BRFSS data for 2005 (5). That report showed large disparities by sex, race/ethnicity, education, and state of residence in the prevalence of stroke. During the past 5 years, the age-adjusted prevalence of stroke marginally declined, from 2.7% to 2.6%. However, for men and for the states of Georgia and South Dakota, significant declines occurred. No other report on recent trends of stroke prevalence in the United States is available; however, one report demonstrated that stroke hospitalizations declined from 1997 to 2004 (7). The Framingham Heart Study (which predominantly included whites) showed that, during the past 50 years, annual incidence of stroke has declined, but lifetime risk for stroke declined at a slower rate (8). A similar decline in stroke incidence has not been observed among blacks (9).
The prevalence of stroke depends on incidence, mortality, and mean length of survival after stroke. During 2006–2010, stroke mortality declined continuously (3). However, no incidence data were reported for this period. The percentage of institutionalized stroke survivors actually might have increased; trends in stroke hospitalization data show that the percentage of stroke patients discharged to long-term–care facilities increased from 1988 to 2004 (7).
Because no national surveillance of stroke incidence exists in the United States, prevalence data can provide some evidence of disparities in stroke incidence. American Indians/Alaska Natives and blacks had higher stroke prevalence than other racial/ethnic groups. Persons with lower levels of education had higher stroke prevalence. These disparities have not decreased since 2005 (5). Similar to trends observed in stroke mortality,§ the southeastern region had a higher prevalence of stroke than other regions of the United States. Hypertension is the leading risk factor for stroke and is more prevalent in the southeastern region of the United States (10). Increased clinical and community action to control hypertension is needed not only to reduce the incidence of stroke but to eliminate disparities in stroke incidence.
The findings in this report are subject to the at least four limitations. First, BRFSS does not include persons in institutions, long-term–care facilities, nursing homes, the military, or correctional institutions, and therefore might exclude a substantial proportion of persons with stroke, leading to underestimation of actual stroke prevalence. Second, because the response rate was only 50.6%–54.6%, the generalizability of the findings is questionable to the extent that nonrespondents differed from respondents. However, sample weights have been applied in all analyses to account for the varying probabilities of nonresponse in the complex survey sampling design, so the impact of noncoverage bias and nonresponse bias on prevalence estimates might be minimal. Third, BRFSS is conducted in English and Spanish only, which could exclude those who cannot speak either of those languages. Finally, BRFSS data are self-reported and therefore are subject to recall bias and social desirability bias.
CDC's State Heart Disease and Stroke Prevention Program currently funds programs in 41 states and DC, as well as the Paul Coverdell National Acute Stroke Registry, to improve the quality of acute stroke care.¶ A major goal of these programs is to build capacity to conduct public health activities to prevent and improve control of the major risk factors for heart disease and stroke, including hypertension and high cholesterolemia. The findings in this report demonstrate the variation in stroke prevalence during 2006–2010, a period in which stroke mortality declined continuously. Especially in states with high stroke prevalence, these findings can help public health officials to develop targeted programs for heart disease and stroke prevention.
References
- Miniño AM, Murphy SL, Xu J, Kochanek KD. Deaths: final data for 2008. Natl Vital Stat Rep 2011;59(10).
- Kelly-Hayes M, Beiser A, Kase CS, Scaramucci A, D'Agostino RB, Wolf PA. The influence of gender and age on disability following ischemic stroke: the Framingham Study. J Stroke Cerebrovasc Dis 2003;12:119–26.
- Roger VL, Go AS, Lloyd-Jones DM, et al. Heart disease and stroke statistics—2012 update: a report from the American Heart Association. Circulation 2012;125:e2–220.
- Gillum RF, Kwagyan J, Obisesan TO. Ethnic and geographic variation in stroke mortality trends. Stroke 2011;42:3294–6.
- CDC. Prevalence of stroke—United States, 2005. MMWR 2007;56:469–74.
- Klein RJ, Schoenborn CA. Age adjustment using the 2000 projected U.S. population. Healthy People 2010 Stat Notes 2001;20:1–10.
- Fang J, Alderman MH, Keenan NL, Croft JB. Declining US stroke hospitalization since 1997: National Hospital Discharge Survey, 1988–2004. Neuroepidemiology 2007;29:243–9
- Carandang R, Seshadri S, Beiser A, et al. Trends in incidence, lifetime risk, severity, and 30–day mortality of stroke over the past 50 years. JAMA 2006;296:2939–46.
- Kleindorfer DO, Khoury J, Moomaw CJ, et al. Stroke incidence is decreasing in whites but not in blacks: a population-based estimate of temporal trends in stroke incidence from the Greater Cincinnati/Northern Kentucky Stroke Study. Stroke 2010;41:1326–31.
- Liao Y, Greenlund KJ, Croft JB, Keenan NL, Giles WH. Factors explaining excess stroke prevalence in the US Stroke Belt. Stroke 2009;40:3336–41.
* Additional information available at http://www.cdc.gov/brfss.
† Persons identified as Hispanic might be of any race. Persons identified as white, black, or other race are all non-Hispanic.
§ Additional information available at http://www.cdc.gov/dhdsp/atlas/stroke_mortality_atlas/index.htm.
¶ Additional information available at http://www.cdc.gov/dhdsp/programs/nhdsp_program/index.htm.
What is already known on this topic?
CDC previously reported that in 2005, 2.6% of U.S. adults had a history of stroke. The prevalence of stroke was higher among older persons, American Indians/Alaska Natives, blacks, and persons with lower levels of education compared with younger persons, whites, and persons with higher levels of education. Also in 2005, a nearly twofold difference was observed between states with the lowest and highest estimated stroke prevalence.
What is added by this report?
This report describes overall and state-specific trends in stroke prevalence in the United States during 2006–2010. The overall prevalence of stroke in the United States during this period declined from 2.7% to 2.6%. Significant linear declines were observed in two states (Georgia and South Dakota), and a linear increase was not observed in any state. Disparities by age, race/ethnicity, education, and state of residence persisted.
What are the implications for public health practice?
Results from this report can help state stroke prevention programs increase state capacity to control and prevent stroke and related risk factors. In addition, especially in states with high stroke prevalence, these findings can help public health officials to develop targeted programs for heart disease and stroke prevention.
FIGURE. Age-adjusted prevalence of stroke* among noninstitutionalized adults aged ≥18 years,† by state — Behavioral Risk Factor Surveillance System, United States, 2010
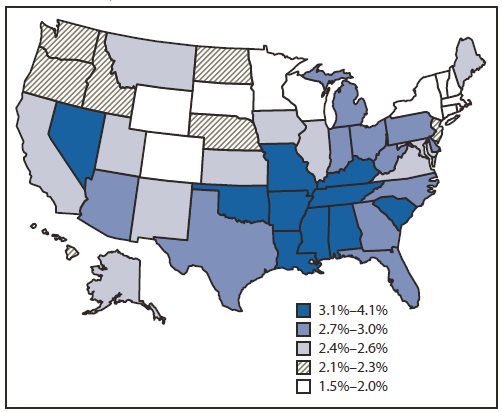
* Age-adjusted to the 2000 U.S. standard population; weighted estimates.
† Respondents were asked, "Has a doctor, nurse, or other health professional ever told you that you had a stroke?" Refused, "don't know," and missing responses were excluded from analyses.
Alternate Text: The figure above shows age-adjusted prevalence of stroke among noninstitutional¬ized adults aged ≥18 years, by state, in the United States during 2010, based on data from the Behavioral Risk Factor Surveillance System. In 2010, the states with higher stroke prevalence generally were states in the southeastern United States and Nevada.
Use of trade names and commercial sources is for identification only and does not imply endorsement by the U.S. Department of
Health and Human Services.
References to non-CDC sites on the Internet are
provided as a service to MMWR readers and do not constitute or imply
endorsement of these organizations or their programs by CDC or the U.S.
Department of Health and Human Services. CDC is not responsible for the content
of pages found at these sites. URL addresses listed in MMWR were current as of
the date of publication.
All MMWR HTML versions of articles are electronic conversions from typeset documents.
This conversion might result in character translation or format errors in the HTML version.
Users are referred to the electronic PDF version (http://www.cdc.gov/mmwr)
and/or the original MMWR paper copy for printable versions of official text, figures, and tables.
An original paper copy of this issue can be obtained from the Superintendent of Documents, U.S.
Government Printing Office (GPO), Washington, DC 20402-9371;
telephone: (202) 512-1800. Contact GPO for current prices.
**Questions or messages regarding errors in formatting should be addressed to
mmwrq@cdc.gov.
