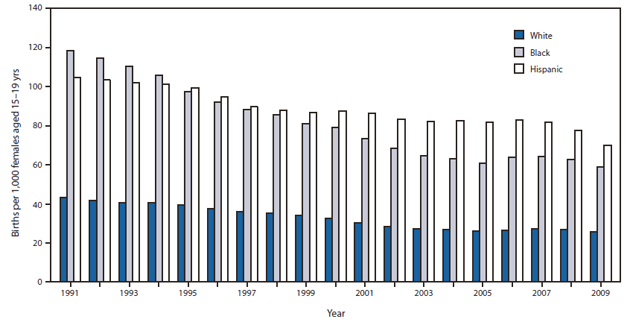
FIGURE. Birth rate for teens aged 15--19 years, by race/ethnicity* --- National Vital Statistics System, United States, 1991--2009
Persons using assistive technology might not be able to fully access information in this file. For assistance, please send e-mail to: mmwrq@cdc.gov. Type 508 Accommodation and the title of the report in the subject line of e-mail.
Vital Signs: Teen Pregnancy --- United States, 1991--2009
On April 5, this report was posted as an MMWR Early Release on the MMWR website (http://www.cdc.gov/mmwr).
Abstract
Background: In 2009, approximately 410,000 teens aged 15--19 years gave birth in the United States, and the teen birth rate remains higher than in other developed countries.
Methods: To describe U.S. trends in teen births and related factors, CDC used data on 1) teen birth rates during 1991--2009 from the National Vital Statistics System, 2) sexual intercourse and contraceptive use among high school students during 1991--2009 from the national Youth Risk Behavior Survey, and 3) sex education, parent communication, use of long-acting reversible contraceptives (LARCs), and receipt of reproductive health services among teens aged 15--19 years from the 2006--2008 National Survey of Family Growth.
Results: In 2009, the national teen birth rate was 39.1 births per 1,000 females, a 37% decrease from 61.8 births per 1,000 females in 1991 and the lowest rate ever recorded. State-specific teen birth rates varied from 16.4 to 64.2 births per 1,000 females and were highest among southern states. Birth rates for black and Hispanic teens were 59.0 and 70.1 births per 1,000 females, respectively, compared with 25.6 for white teens. From 1991 to 2009, the percentage of high school students who ever had sexual intercourse decreased from 54% to 46%, and the percentage of students who had sexual intercourse in the past 3 months but did not use any method of contraception at last sexual intercourse decreased from 16% to 12%. From 1999 to 2009, the percentage of students who had sexual intercourse in the past 3 months and used dual methods at last sexual intercourse (condoms with either birth control pills or the injectable contraceptive Depo-Provera) increased from 5% to 9%. During 2006--2008, 65% of female teens and 53% of male teens received formal sex education that covered saying no to sex and provided information on methods of birth control. Overall, 44% of female teens and 27% of male teens had spoken with their parents about both topics, but among teens who had ever had sexual intercourse, 20% of females and 31% of males had not spoken with their parents about either topic. Only 2% of females who had sexual intercourse in the past 3 months used LARCs at last sexual intercourse.
Conclusions: Teen birth rates in the United States have declined but remain high, especially among black and Hispanic teens and in southern states. Fewer high school students are having sexual intercourse, and more sexually active students are using some method of contraception. However, many teens who have had sexual intercourse have not spoken with their parents about sex, and use of LARCs remains rare.
Implications for Public Health Practice: Teen childbearing is associated with adverse consequences for mothers and their children and imposes high public sector costs. Prevention of teen pregnancy requires evidence-based sex education, support for parents in talking with their children about pregnancy prevention and other aspects of sexual and reproductive health, and ready access to effective and affordable contraception for teens who are sexually active.
Introduction
Despite declines since 1991 (1), the teen birth rate in the United States remains as much as nine times higher as in other developed countries (2),* and significant racial/ethnic and geographic disparities exist in the United States (3,4). Compared with births to adult women, births to teens are at greater risk for low birth weight, preterm birth, and death in infancy (5,6). Teen childbearing also perpetuates a cycle of disadvantage; teen mothers are less likely to finish high school, and their children are more likely to have low school achievement, drop out of high school, and give birth themselves as teens (7,8). Each year, teen childbearing costs the United States approximately $6 billion in lost tax revenue and nearly $3 billion in public expenditures. However, these costs are $6.7 billion lower than they would have been had teen childbearing not decreased (9).
This report describes trends in birth rates among U.S. teens aged 15--19 years and percentages of high school students having sexual intercourse and using contraceptives. The prevalence of four measures with the potential to reduce teen pregnancy (i.e., sex education, communication with parents, use of long-acting reversible contraceptives, and receipt of reproductive health services) (10--14) also are examined among never-married teens aged 15--19 years.
Methods
Data sources were natality files from the National Vital Statistics System and two nationally representative surveys: the national Youth Risk Behavior Survey (YRBS) and the National Survey of Family Growth (NSFG). U.S. natality files are compiled annually and include demographic information such as maternal age, race, and Hispanic origin for all births in the United States. This report includes preliminary national and state-specific data for 2009 (which include 99.95% of all births during that year) (15) and final data from 1991--2008 (1,3,5).
YRBS is a school-based, self-administered survey conducted by CDC using a multistage cluster sample to obtain data representative of students in grades 9--12 attending private and public schools in the United States. In this report, 1991--2009 data were used to assess the percentage of students who ever had sexual intercourse and the percentage of currently sexually active students† who did not use any method of contraception at last sexual intercourse. Use of selected contraceptive methods§ at last sexual intercourse among sexually active students was assessed from 1999, the first year that use of the injectable contraceptive Depo-Provera was measured, through 2009. In addition, because research has shown that many youths do not use condoms consistently (16) and use of an additional birth control method is recommended (17), dual method use (i.e., condoms with birth control pills or Depo-Provera) was assessed. Temporal changes were analyzed overall and by sex and race/ethnicity using logistic regression analyses that simultaneously assessed linear and quadratic (e.g., leveling off or change in direction) time effects (18). Racial/ethnic data are presented only for black (non-Hispanic), white (non-Hispanic), and Hispanic students (of any race); the numbers of students from other racial/ethnic groups were too small for meaningful analysis.
NSFG is an in-person, household survey based on a stratified, multistage probability sample that is nationally representative of eligible women and men aged 15--44 years. For this report, 2006--2008 data were used to examine the prevalence of receiving sex education, parental communication, use of long-acting reversible contraceptives (LARCs) and receipt of reproductive health services, among never-married teens aged 15--19 years (16,19). LARCs were defined as intrauterine devices and contraceptive implants (Norplant and Implanon) (14). Receipt of reproductive health services was measured in terms of whether female teens had received a method of birth control or a prescription from a health-care provider in the preceding 12 months. This measure was evaluated because females can only obtain LARCs and other hormonal methods¶ from a health-care provider.
Results
Teen birth rates. In 2009, approximately 410,000 births occurred among teens aged 15--19 years; the teen birth rate fell to 39.1 births per 1,000 females, a 37% decrease from 61.8 births per 1,000 females in 1991 and the lowest rate ever recorded. During that period, the birth rate decreased 50% among black teens, 41% among white teens, and 33% among Hispanic teens. In 2009, birth rates for black teens (59.0 per 1,000 females) and Hispanic teens (70.1 per 1,000 females) were more than twice that of white teens (25.6 per 1,000 females). Although birth rates were higher among black teens than Hispanic teens during 1991--1994, Hispanic teens had higher birth rates during 1995--2009 (Figure).
In 2009, birth rates were lowest in the Northeast and upper Midwest and highest among southern states. State-specific birth rates varied from 16.4 to 22.7 births per 1,000 females aged 15--19 years in states with the lowest birth rates (Connecticut, Massachusetts, New Hampshire, New Jersey and Vermont), to 59.3 to 64.2 births per 1,000 females aged 15--19 years in states with the highest birth rates (Arkansas, Mississippi, New Mexico, Oklahoma, and Texas).** Birth rates for white and Hispanic teens have been highest in the Southeast, whereas birth rates for black teens have been highest in the upper Midwest and Southeast (3).
Sexual behavior and use of contraception. In 2009, 46% of high school students reported ever having had sexual intercourse, a decrease from 54% in 1991. In 2009, for female students, the percentage who ever had sexual intercourse was highest among black students (58%) and similar among white (45%) and Hispanic students (45%). For male students, the percentage who ever had sexual intercourse was higher among black students (72%) than Hispanic (53%) and white students (40%) and higher among Hispanic than white students. During 1991--2009, the overall percentage of female and male students who ever had sexual intercourse decreased; however, this decrease did not occur among white female students, Hispanic female students, or Hispanic male students, and beginning in 2001, the decrease among black male students leveled off (Table 1).
In 2009, 12% of sexually active students did not use any method of contraception at last sexual intercourse, a decrease from 16% in 1991. In 2009, both for female and male students, the percentage who did not use any method of contraception at last sexual intercourse was higher among Hispanic students (females, 23%; males, 16%) and black students (females, 20%; males, 12%) than white students (females, 10%; males, 6%). During 1991--2009, the overall percentage of sexually active female and male students who did not use contraception at last sexual intercourse decreased. This decrease occurred for female and male students in every racial/ethnic group, but for black female students, the decrease leveled off beginning in 2005 (Table 1).
In 2009, 44% of sexually active female students and 60% of sexually active male students used condoms at last sexual intercourse. Among sexually active female students, 18% used birth control pills or Depo-Provera without condoms, and 10% used dual methods (i.e., condoms with birth control pills or Depo-Provera). Among sexually active male students, 10% did not use a condom but their partner used birth control pills or Depo-Provera, and 8% used dual methods in which they used a condom and their partner used birth control pills or Depo-Provera. During 1999--2009, condom use without birth control pills or Depo-Provera remained the most commonly used contraceptive method; the percentage of students who used dual methods (condoms with birth control pills or Depo-Provera) was low, but increased from 5% in 1999 to 9% in 2009. However, whereas this increase occurred among male and female students overall, it was only observed among white students (Table 1).
During 2006--2008, use of long-acting reversible contraceptives (LARCs) (i.e., intrauterine devices and contraceptive implants) was rare (16). Only 2% of sexually active females aged 15--19 years reported using one of these methods at last intercourse.
Sex education, parent communication, and receipt of services. During 2006--2008, most teens said they had received formal sex education before age 18 years that either covered saying no to sex (females, 87%; males, 81%) or provided information on methods of birth control (females, 70%; males, 62%); 65% of females and 53% of males received education on both topics (Table 2). Among teens who had ever had sexual intercourse, 5% of females and 13% of males had received no formal education on either topic.
Approximately half of all teens had spoken with their parents either about how to say no to sex or about methods of birth control†† (Table 2). Fewer teens (females, 44%; males, 27%) had spoken with their parents about both topics, and 24% of females and 38% of males had not spoken with their parents about either topic. The percentage of teens who spoke with their parents about methods of birth control was higher among those who had ever had sexual intercourse (females, 70%; males, 64%) than among those who had not (females, 48%; males 35%) (Table 2). However, among those who had ever had sexual intercourse, 20% of females and 31% of males had never spoken with their parents either about how to say no to sex or about methods of birth control.
Among sexually active females, during 2006--2008, 55% (95% confidence interval [CI] = 48%--63%) either had received a method of birth control or a prescription from a health-care provider in the preceding 12 months; this percentage was higher among sexually active teens who had spoken with their parents about birth control (64%; CI = 55%--71%) compared with those who had not (37%; CI = 26%--50%). Among those sexually active females who had received a method of birth control or a prescription from a health-care provider in the preceding 12 months, 56% (CI = 47%--64%) reported using a hormonal method (i.e., birth control pills, injectable contraceptives, contraceptive patches and rings), or a LARC (i.e., contraceptive implants and intrauterine devices) at last sexual intercourse.
Conclusions and Comment
The teen birth rate in the United States declined during 1991--2009 to its lowest level in the nearly 70 years these data have been collected (1). Nonetheless, in 2009, approximately 410,000, or 4% of all female teens aged 15--19 years, gave birth in the United States, and the teen birth rate remains nearly three to four times higher in those states with the highest birth rates (>59 births per 1,000 females), compared with those states with the lowest rates (<23 births per 1,000 females). Moreover, the teen birth rate in the United States remains six to nine times higher than in developed countries with the lowest birth rates. Even in U.S. states with the lowest rates, the teen birth rate is nearly three to five times higher than in developed countries with the lowest birth rates, and in U.S. states with the highest rates, the teen birth rate is approximately 10 to 15 times higher than in other developed countries with the lowest birth rates (2).
Paralleling the decline in births to teens aged 15--19 years during 1991--2009, the percentage of high school students who had ever had sexual intercourse and the percentage of sexually active students who did not use any method of contraception at last sexual intercourse both decreased. However, these decreases were not consistently observed across all race/ethnicity groups. Moreover, among sexually active high school students, use of hormonal methods (i.e., birth control pills or the injectable contraceptive Depo-Provera), alone or in combination with condoms, remains low. Among teens aged 15--19 years, use of LARCs (i.e., intrauterine devices and contraceptive implants), remains rare. Unlike condoms, use of these methods is limited in part because they must be obtained from a health-care provider; the findings in this report suggest that only half of sexually active females receive birth control methods from a health-care provider. Although approximately 98% of health-care providers offer birth control pills and the injectable contraceptive Depo-Provera on site or through prescription, the need to be referred to another doctor might impede the use of intrauterine devices and contraceptive implants (20). In addition, teens who receive these methods do not always use them; the findings in this report suggest that only half of sexually active females who received a method of birth control from a health-care provider used a LARC or another hormonal method at last intercourse.
Numerous sex education programs have been shown to be effective in delaying sexual initiation or increasing contraceptive use (10). Research also has shown that parent-child communication can delay sexual initiation and reduce sexual risk behaviors (11--13). Nonetheless, consistent with other recent publications (19), this report suggests many teens do not receive formal sex education that covers both abstinence and contraception, and many teens do not talk with their parents about ways to prevent pregnancy.
The findings in this report are subject to at least five limitations. First, natality data are based on births, not pregnancies, and therefore exclude pregnancies that do not result in live birth. Second, estimates of sexual risk and protective behaviors (i.e., contraceptive use) are self-reported; the extent of underreporting or overreporting cannot be determined and can vary by sex (e.g., males might be unaware of the contraceptive methods their partners are using). Nonetheless, survey questions demonstrate good test-retest reliability (21). Third, the findings obtained through YRBS are applicable only to youths who attend school and are not representative of out-of-school teens who might have a higher prevalence of health risk behaviors (22). Fourth, although surveys indicate the majority of teen births are unintended (23), distinguishing unintended from intended births is not possible using data from the National Vital Statistics System. Finally, this report does not address births to females aged <15 years. In 2009, approximately 5,000 females aged 10--14 years gave birth; although this is the lowest number reported in more than 60 years (1), births in this age group are of particular concern.
Programs for preventing teen pregnancy should be broad-based and multifaceted. The programs should provide evidence-based sex education, support parental efforts to talk with their children about pregnancy prevention and other aspects of sexual and reproductive health, and ensure that sexually active teens have ready access to contraception that is effective and affordable.
Reported by
K Pazol, PhD, L Warner, PhD, L Gavin, PhD, WM Callaghan, MD, AM Spitz, MS, MPH, JE Anderson, PhD, WD Barfield, MD, Div of Reproductive Health; L Kann, PhD, Div of Adolescent and School Health, National Center for Chronic Disease Prevention and Health Promotion, CDC.
Acknowledgments
This report is based, in part, on contributions by C Lesesne, PhD, L House, PhD, Div of Reproductive Health, National Center for Chronic Disease Prevention and Health Promotion; and GM Martinez, PhD, and SJ Ventura, MA, Div of Vital Statistics, National Center for Health Statistics, CDC.
References
- Ventura SJ, Hamilton BE. U. S. teenage birth rate resumes decline. NCHS data brief no. 58. Hyattsville, MD: US Department of Health and Human Services, CDC; 2011.
- United Nations. 2008 Demographic Yearbook. New York, NY: United Nations; 2010.
- Mathews TJ, Sutton PD, Hamilton BE, Ventura SJ. State disparities in teenage birth rates in the United States. NCHS data brief, no. 46. Hyattsville, MD: US Department of Health and Human Services, CDC; 2010.
- CDC. CDC health disparities and inequalities report--- United States, 2011: adolescent pregnancy and childbirth---United States, 1991--2008. MMWR 2011;60 (Suppl):105--8.
- Martin JA, Hamilton BE, Sutton PD, et al. Births: final data for 2008. Natl Vital Stat Rep 2010;59(1).
- Mathews TJ, MacDorman MF. Infant mortality statistics from the 2006 period linked birth/infant death data set. Natl Vital Stat Rep 2010;58(17).
- Manlove J, Terry-Humen E, Mincieli L, Moore K. Outcomes for children of teen mothers from kindergarten through adolescence In: Hoffman S, Maynard R, eds. Kids having kids: economic costs and social consequences of teen pregnancy. Washington, DC: The Urban Institute Press; 2008.
- Perper K, Peterson K, Manlove J. Child trends fact sheet: diploma attainment among teen mothers. Washington, D.C.: Child Trends; 2010. Available at http://www.childtrends.org/files//child_trends-2010_01_22_fs_diplomaattainment.pdf. Accessed March 15, 2011.
- Hoffman S. By the numbers: the public costs of teen childrearing. Washington, DC: The National Campaign to Prevent Teen Pregnancy; 2006. Available at http://www.thenationalcampaign.org/resources/pdf/pubs/btn_full.pdf; 2006. Accessed March 15, 2011.
- Oringanje C, Meremikwu MM, Eko H, Esu E, Meremikwu A, Ehiri JE. Interventions for preventing unintended pregnancies among adolescents. Cochrane Database Syst Rev 2009:CD005215.
- Brody GH, Murry VM, Gerrard M, et al. The strong African American families program: prevention of youths' high-risk behavior and a test of a model of change. J Fam Psychol 2006;20:1--11.
- Haggerty KP, Skinner ML, MacKenzie EP, Catalano RF. A randomized trial of Parents Who Care: effects on key outcomes at 24-month follow-up. Prev Sci 2007;8:249--60.
- Prado G, Pantin H, Briones E, et al. A randomized controlled trial of a parent-centered intervention in preventing substance use and HIV risk behaviors in Hispanic adolescents. J Consult Clin Psychol 2007;75:914--26.
- Epsey E, Ogburn T. Long-acting reversible contraceptives: intrauterine devices and the contraceptive implant. Obstet & Gynecol 2011;117:705--18.
- Hamilton BE, Martin JA, Ventura SJ. Births: preliminary data for 2009. Natl Vital Stat Rep 2010;59(3).
- Abma J, Martinez G, Copen C. Teenagers in the United States: sexual activity, contraceptive use, and childbearing. National Survey of Family Growth 2006--2008. Vital Health Stat 2010;23(30).
- World Health Organization Department of Reproductive Health and Research, Johns Hopkins Bloomberg School of Public Health. Family planning: a global handbook for providers. Baltimore MD: Johns Hopkins; 1997. Geneva, Switzerland: World Health Organization; 2007.
- CDC. Methodology of the Youth Risk Behavior Surveillance System. MMWR 2004;53(No. RR-12).
- Martinez G, Abma J, Copen C. Educating teenagers about sex in the United States. NCHS data brief no. 44. Hyattsville, MD: US Department of Health and Human Services, CDC; 2010.
- CDC. Contraceptive methods available to patients of office-based physicians and Title X clinics---United States, 2009--2010. MMWR 2011;60:1--4.
- Brener ND, Kann L, McManus T, Kinchen SA, Sundberg EC, Ross JG. Reliability of the 1999 youth risk behavior survey questionnaire. J Adolesc Health 2002;31:336--42.
- CDC. Health risk behaviors among adolescents who do and do not attend school---United States, 1992. MMWR 1994;43:129--32.
- Finer LB, Henshaw SK. Disparities in rates of unintended pregnancy in the United States, 1994 and 2001. Perspect Sex Reprod Health 2006;38:90--6.
* By comparison, the U.S. teen birth rate is nearly one and a half times higher than the teen birth rate in the United Kingdom, which has the highest teen birth rate in western Europe. The U.S. rate is nearly three times higher than the teen birth rate in Canada and six to nine times higher than the teen birth rates in Denmark, the Netherlands, Sweden, and Switzerland (2).
† Students were considered currently sexually active if they had sexual intercourse with at least one person during the 3 months before the survey.
§ Use of the following selected contraceptive methods among sexually active students was assessed: 1) condoms but not birth control pills or Depo-Provera; 2) birth control pills or Depo-Provera but not condoms; and 3) dual methods (condoms and birth control pills or Depo-Provera). The percentage of students who used methods other than condoms, birth control pills, or Depo-Provera is not assessed in this report.
¶ NSFG measures use of the following methods that have been classified in this report as hormonal contraceptives: birth control pills, the injectable contraceptives Depo-Provera and Lunelle, and contraceptive patches and rings. The contraceptive implants Norplant and Implanon and the intrauterine device Mirena also contain hormones but are classified in this report as LARCs.
** Information available at http://www.cdc.gov/mmwr/preview/mmwrhtml/mm6006a6.htm?s_cid=mm6006a6_w.
†† Includes communicating with parents about contraception, methods of birth control, where to get birth control, or how to use a condom.
|
Key Points |
|
Sources: Hamilton BE, Martin JA, Ventura SJ. Births: preliminary data for 2009. Natl Vital Stat Rep 2010;59(3). Martin JA, Hamilton BE, Sutton PD, et al. Births: final data for 2008. Natl Vital Stat Rep 2010;59(1).
* Persons categorized as black or white were non-Hispanic. Persons categorized as Hispanic might be of any race.
Alternate Text: The figure above shows the birth rate for teens aged 15-19 years, by race/ethnicity in the United States from 1991-2009, according to the National Vital Statistics System. Although birth rates were higher among black teens than Hispanic teens during 1991-1994, Hispanic teens had higher birth rates during 1995-2009.
|
TABLE 1. (Continued) Percentage of high school students who reported pregnancy risk behaviors and contraceptive use, by sex and race/ethnicity* --- Youth Risk Behavior Survey, United States, 1991--2009 |
||||||||||
|---|---|---|---|---|---|---|---|---|---|---|
|
Behavior/Year |
Males |
Combined total for males and females |
||||||||
|
Race/Ethnicity |
||||||||||
|
White |
Black |
Hispanic |
Total |
|||||||
|
% |
(95% CI) |
% |
(95% CI) |
% |
(95% CI) |
% |
(95% CI) |
% |
(95% CI) |
|
|
Ever had sexual intercourse |
||||||||||
|
1991 |
52.7 |
(48.9--56.6) |
88.1 |
(83.7--91.4) |
64.1 |
(57.8--70.0) |
57.4 |
(53.1--61.5) |
54.1 |
(50.5--57.8) |
|
1993 |
49.3 |
(45.3--53.4) |
89.2 |
(86.5--91.4) |
63.5 |
(59.2--67.7) |
55.6 |
(52.0--59.2) |
53.0 |
(50.2--55.8) |
|
1995 |
48.9 |
(43.1--54.7) |
81.0 |
(75.0--85.8) |
62.0 |
(52.2--71.0) |
54.0 |
(49.0--58.8) |
53.1 |
(48.4--57.7) |
|
1997 |
43.3 |
(39.4--47.3) |
80.3 |
(77.3--83.0) |
57.7 |
(51.2--63.9) |
48.9 |
(45.4--52.3) |
48.4 |
(45.2--51.6) |
|
1999 |
45.5 |
(41.2--49.8) |
75.7 |
(68.6--81.7) |
62.9 |
(57.5--68.0) |
52.2 |
(48.0--56.2) |
49.9 |
(46.1--53.7) |
|
2001 |
45.1 |
(42.4--47.9) |
68.8 |
(59.6--76.8) |
53.0 |
(48.0--58.0) |
48.5 |
(45.8--51.3) |
45.6 |
(43.2--48.1) |
|
2003 |
40.5 |
(36.9--44.2) |
73.8 |
(70.0--77.3) |
56.8 |
(52.4--61.2) |
48.0 |
(44.6--51.4) |
46.7 |
(44.0--49.4) |
|
2005 |
42.2 |
(37.8--46.8) |
74.6 |
(70.6--78.2) |
57.6 |
(53.1--62.1) |
47.9 |
(44.4--51.5) |
46.8 |
(43.4--50.2) |
|
2007 |
43.6 |
(39.7--47.6) |
72.6 |
(68.5--76.3) |
58.2 |
(54.0--62.4) |
49.8 |
(46.7--52.9) |
47.8 |
(45.1--50.6) |
|
2009 |
39.6 |
(33.9--45.6)† |
72.1 |
(67.8--76.1)†,§ |
52.8 |
(49.2--56.4) |
46.1 |
(41.5--50.9)† |
46.0 |
(42.9--49.2)† |
|
Did not use any method of contraceptive¶,** |
||||||||||
|
1991 |
11.6 |
(8.7--15.3) |
21.0 |
(15.3--28.1) |
22.7 |
(15.9--31.3) |
15.0 |
(12.2--18.3) |
16.5 |
(14.6--18.6) |
|
1993 |
13.2 |
(10.8--16.2) |
13.0 |
(10.0--16.7) |
22.6 |
(16.8--29.8) |
14.3 |
(12.4--16.3) |
15.3 |
(13.7--17.0) |
|
1995 |
13.6 |
(9.4--19.2) |
10.8 |
(6.9--16.4) |
23.9 |
(17.9--31.2) |
14.2 |
(11.6--17.1) |
15.8 |
(13.6--18.2) |
|
1997 |
14.2 |
(10.9--18.2) |
15.6 |
(11.8--20.3) |
24.1 |
(18.2--31.3) |
15.3 |
(12.9--18.0) |
15.2 |
(13.5--17.1) |
|
1999 |
12.0 |
(8.8--16.2) |
14.5 |
(10.1--20.3) |
17.7 |
(13.6--22.8) |
13.2 |
(11.0--15.8) |
14.9 |
(13.2--16.8) |
|
2001 |
9.7 |
(7.9--11.7) |
13.8 |
(10.6--17.7) |
16.7 |
(11.5--23.8) |
11.9 |
(10.1--13.9) |
13.3 |
(11.7--15.0) |
|
2003 |
6.4 |
(4.5--8.9) |
9.6 |
(7.4--12.4) |
19.2 |
(14.2--25.4) |
10.5 |
(8.9--12.3) |
11.3 |
(9.9--13.0) |
|
2005 |
8.9 |
(7.0--11.2) |
10.1 |
(7.5--13.5) |
16.4 |
(11.8--22.4) |
10.9 |
(9.1--12.9) |
12.7 |
(11.4--14.3) |
|
2007 |
7.7 |
(5.6--10.5) |
10.0 |
(7.3--13.6) |
15.7 |
(12.0--20.3) |
10.3 |
(8.8--12.0) |
12.2 |
(10.8--13.7) |
|
2009 |
6.4 |
(4.7--8.7)† |
12.3 |
(9.0--16.8)† |
16.2 |
(13.5--19.3)† |
9.7 |
(8.3--11.4)† |
11.9 |
(10.7--13.2)† |
|
Used condoms†† |
||||||||||
|
1999 |
58.7 |
(53.8--63.4) |
72.4 |
(66.6--77.5) |
62.3 |
(51.8--71.7) |
61.3 |
(56.6--65.8) |
52.5 |
(48.0--57.0) |
|
2001 |
54.3 |
(50.7--57.8) |
69.0 |
(63.5--73.9) |
55.8 |
(49.9--61.5) |
57.6 |
(55.1--60.1) |
50.2 |
(47.9--52.4) |
|
2003 |
62.7 |
(58.6--66.6) |
78.2 |
(72.8--82.7) |
58.2 |
(53.0--63.3) |
63.4 |
(60.9--65.9) |
56.0 |
(53.5--58.4) |
|
2005 |
61.3 |
(56.3--66.1) |
72.6 |
(66.6--77.9) |
62.4 |
(53.8--70.2) |
63.1 |
(59.3--66.9) |
54.8 |
(52.2--57.4) |
|
2007 |
61.0 |
(56.2--65.5) |
70.3 |
(65.8--74.5) |
66.5 |
(62.3--70.4) |
63.8 |
(60.6--66.9) |
55.4 |
(53.3--57.5) |
|
2009 |
59.7 |
(56.3--63.0) |
68.4 |
(62.1--74.2) |
57.9 |
(53.8--61.8) |
60.3 |
(57.4--63.0) |
51.7 |
(49.3--54.1)§ |
|
Used birth control pills or Depo-Provera§§ |
||||||||||
|
1999 |
13.2 |
(8.5--19.8) |
2.8 |
(1.4--5.5) |
4.5 |
(2.5--7.9) |
10.0 |
(6.2--15.5) |
14.8 |
(11.8--18.3) |
|
2001 |
13.8 |
(11.7--16.3) |
5.4 |
(3.5--8.3) |
7.5 |
(4.1--13.2) |
10.8 |
(9.2--12.6) |
15.3 |
(13.9--16.8) |
|
2003 |
13.7 |
(11.5--16.3) |
2.4 |
(1.4--4.3) |
9.5 |
(6.0--14.6) |
10.2 |
(8.6--12.1) |
14.0 |
(12.1--16.1) |
|
2005 |
10.8 |
(8.4--13.8) |
7.7 |
(4.5--12.6) |
8.3 |
(5.2--13.1) |
9.8 |
(8.0--11.9) |
13.1 |
(11.0--15.4) |
|
2007 |
12.7 |
(10.2--15.6) |
4.4 |
(2.7--7.0) |
5.6 |
(3.9--8.0) |
9.4 |
(7.5--11.6) |
12.7 |
(11.0--14.6) |
|
2009 |
12.8 |
(10.6--15.4) |
4.2 |
(2.4--7.4) |
9.4 |
(7.0--12.5) |
10.5 |
(8.7--12.6) |
14.1 |
(12.3--16.2) |
|
Used dual methods¶¶ |
||||||||||
|
1999 |
4.0 |
(2.9--5.4) |
2.3 |
(1.0--5.0) |
3.5 |
(1.5--7.6) |
3.4 |
(2.6--4.5) |
4.8 |
(3.8--6.0) |
|
2001 |
9.0 |
(6.9--11.6) |
3.4 |
(2.0--5.8) |
3.4 |
(1.5--7.1) |
7.0 |
(5.7--8.6) |
7.2 |
(6.5--8.1) |
|
2003 |
6.5 |
(5.0--8.5) |
3.2 |
(2.2--4.8) |
4.2 |
(1.8--9.6) |
5.5 |
(4.1--7.2) |
6.8 |
(5.6--8.4) |
|
2005 |
8.5 |
(6.2--11.4) |
3.5 |
(1.9--6.6) |
2.3 |
(1.1--4.5) |
6.6 |
(5.1--8.4) |
7.5 |
(6.4--8.8) |
|
2007 |
5.4 |
(3.9--7.3) |
3.4 |
(1.6--6.9) |
3.6 |
(2.3--5.5) |
4.6 |
(3.6--5.9) |
6.9 |
(5.1--7.1) |
|
2009 |
10.7 |
(8.3--13.6)† |
3.6 |
(1.9--6.6) |
3.9 |
(2.4--6.0) |
7.8 |
(6.4--9.5)† |
8.9 |
(7.6--10.3)† |
|
Abbreviation: CI = confidence interval. * Students categorized as black or white were non-Hispanic. Students categorized as Hispanic might be of any race. Other racial/ethnic populations were too small for meaningful analysis. † Significant linear effect. § Significant quadratic effect. ¶ At last intercourse among students who had sexual intercourse with at least one person during the 3 months before the survey. ** The percentages of sexually active students who did not use any method of contraception and the percentages who used selected contraceptive methods do not add to 100% because the percentage of students who used methods other than condoms, birth control pills, or Depo-Provera is not assessed in this report. †† Without birth control pills or the injectable contraceptive, Depo-Provera, at last sexual intercourse among students who had sexual intercourse with at least one person during the 3 months before the survey. §§ Without condoms, at last sexual intercourse among students who had sexual intercourse with at least one person during the 3 months before the survey. ¶¶ Condoms with birth control pills or the injectable contraceptive, Depo-Provera, at last sexual intercourse among students who had sexual intercourse with at least one person during the 3 months before the survey. |
||||||||||
Use of trade names and commercial sources is for identification only and does not imply endorsement by the U.S. Department of
Health and Human Services.
References to non-CDC sites on the Internet are
provided as a service to MMWR readers and do not constitute or imply
endorsement of these organizations or their programs by CDC or the U.S.
Department of Health and Human Services. CDC is not responsible for the content
of pages found at these sites. URL addresses listed in MMWR were current as of
the date of publication.
All MMWR HTML versions of articles are electronic conversions from typeset documents.
This conversion might result in character translation or format errors in the HTML version.
Users are referred to the electronic PDF version (http://www.cdc.gov/mmwr)
and/or the original MMWR paper copy for printable versions of official text, figures, and tables.
An original paper copy of this issue can be obtained from the Superintendent of Documents, U.S.
Government Printing Office (GPO), Washington, DC 20402-9371;
telephone: (202) 512-1800. Contact GPO for current prices.
**Questions or messages regarding errors in formatting should be addressed to
mmwrq@cdc.gov.
