Review: Cataract
‹View Table of Contents
The VEHSS team conducted a review of published literature on examination-based population studies reporting the prevalence of cataract.
Cataract is the most frequent cause of age-related loss of vision in the world.(Klein, 1992) As defined by the National Eye Institute, a cataract is a clouding of the lens in the eye that affects vision.(Li, 2009) The cloudiness, typically a result of changes in the proteins and fibers that make up the lens, causes images to be blurred when light is scattered on the opaque lens.(AOA, 2016) Symptoms of cataract include blurred or hazy vision, reduced intensity of colors, increased sensitivity to glare, increased difficulty seeing at night, and changes in the eye’s refractive error. Common causes include aging, diabetes mellitus, use of certain drugs, smoking, alcohol consumption, unprotected exposure to ultraviolet radiation, and nutritional deficiency.
Download the full report:
Published Examination-Based Prevalence of Major Eye Disorders [PDF – 703 KB]
Common treatment for cataract is the prescription of eye glasses or surgery to remove and replace the lens with an artificial one. In the U.S., more than one million cataract surgeries are performed each year and more than half of Americans over the age of 80 are living with cataracts.(Desai, 2013) With the aging United States population, cataract is expected to become an increasing health burden, especially for populations of lower socioeconomic status.(Desai, 2013)
Cataract Literature Review Results
There were 8 studies published between 1992 and 2013 that examined the prevalence of cataract.
Table 1. Cataract Prevalence Sources.
| Author | Date of Publication | Title | Date of Data Collection | Data Source | Sample Size | Prevalence Data Stratified by: |
|---|---|---|---|---|---|---|
| Maa AY, Evans C, et al. | 2013 | Veteran Eye Disease After Eligibility Reform: Prevalence and Characteristics | January 2008–February 2008 | Atlanta VA Medical Center Chart Review | 658 | Not stratified by demographic variables |
| Richter GM, Chung J, et al. | 2009 | Prevalence of Visually Significant Cataract and Factors Associated with Unmet Need for Cataract Surgery: Los Angeles Latino Eye Study | 2009 | LALES | 6,142 | Age, Sex, Race/Ethnicity |
| Broman AT, Hafiz G, Munoz B, et al. | 2005 | Cataract and Barriers to Cataract Surgery in a US Hispanic Population | 1997–1999 | Proyecto VER | 4,774 | Age, Sex, Race/Ethnicity |
| Mansberger SL, Romero FC, et al. | 2005 | Causes of Visual Impairment and Common Eye Problems in Northwest American Indians and Alaska Natives | Unknown | Northwest AIAN | 288 | Race |
| Congdon, N, Vingerling, J.R., Eye Diseases Prevalence Research Group | 2004 | Prevalence of Cataract and Pseudophakia/Aphakia Among Adults in the United States | 1988–2000 | EDPRG | Various | Age, Sex, Race |
| Varma R, Torres M, Los Angeles Eye Study Group | 2004 | Prevalence of Lens Opacities in Latinos | 2000 | LALES | 6,142 | Age, Sex |
| Haronian E, Wheeler NC | 1993 | Prevalence of Eye Disorders Among the Elderly in Los Angeles | 1982–1990 | UCLA MEC | 431 | Age, Sex |
| Klein B, Klein R, Linton KLP | 1992 | Prevalence of Age-Related Lens Opacities in a Population. The Beaver Dam Eye Study | 1988–1990 | BDES | 4,926 | Age, Sex |
Overall Cataract Prevalence Rates
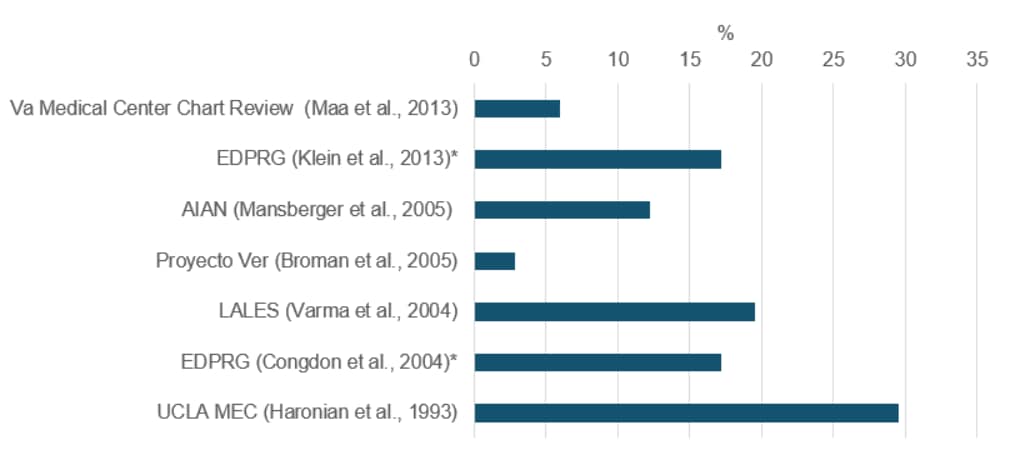
Figure 1 below shows the estimated prevalence rate for cataract from the seven studies reviewed in this section. Prevalence rates ranged from 2.8% in Proyecto VER to 29.5% in UCLA MEC. The high degree of variation among the results in this figure is likely due to in part to methodological, disease definition and population differences among the studies. The figure is intended to illustrate the range of published prevalence values; direct comparison of the studies is impossible without considering the underlying differences in the studies. Detailed results from each individual study are available in the full report Published Examination-based Prevalence of Major Eye Disorders.
Figure 1. Overall Prevalence Rates of Cataract in Selected Studies.

*Age-or population- adjusted prevalence rate.