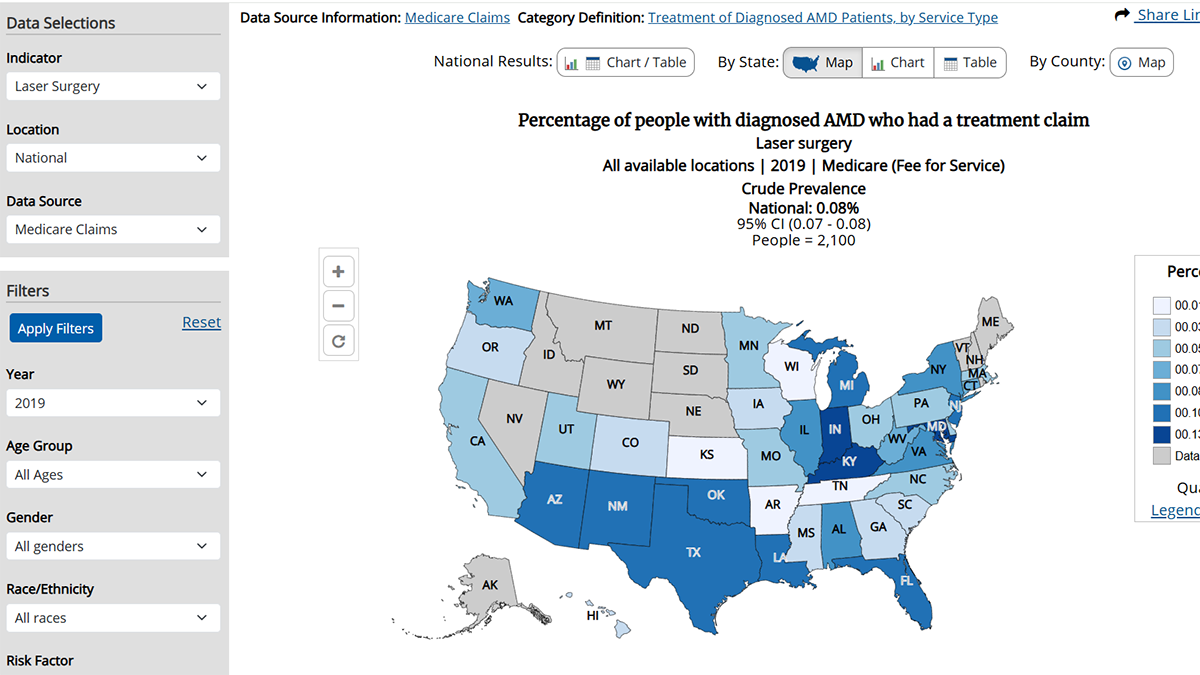
VEHSS is an interactive web tool that provides vision data at national, state, and county levels.
Find Data on VEHSS
Find and analyze vision and eye health data on VEHSS
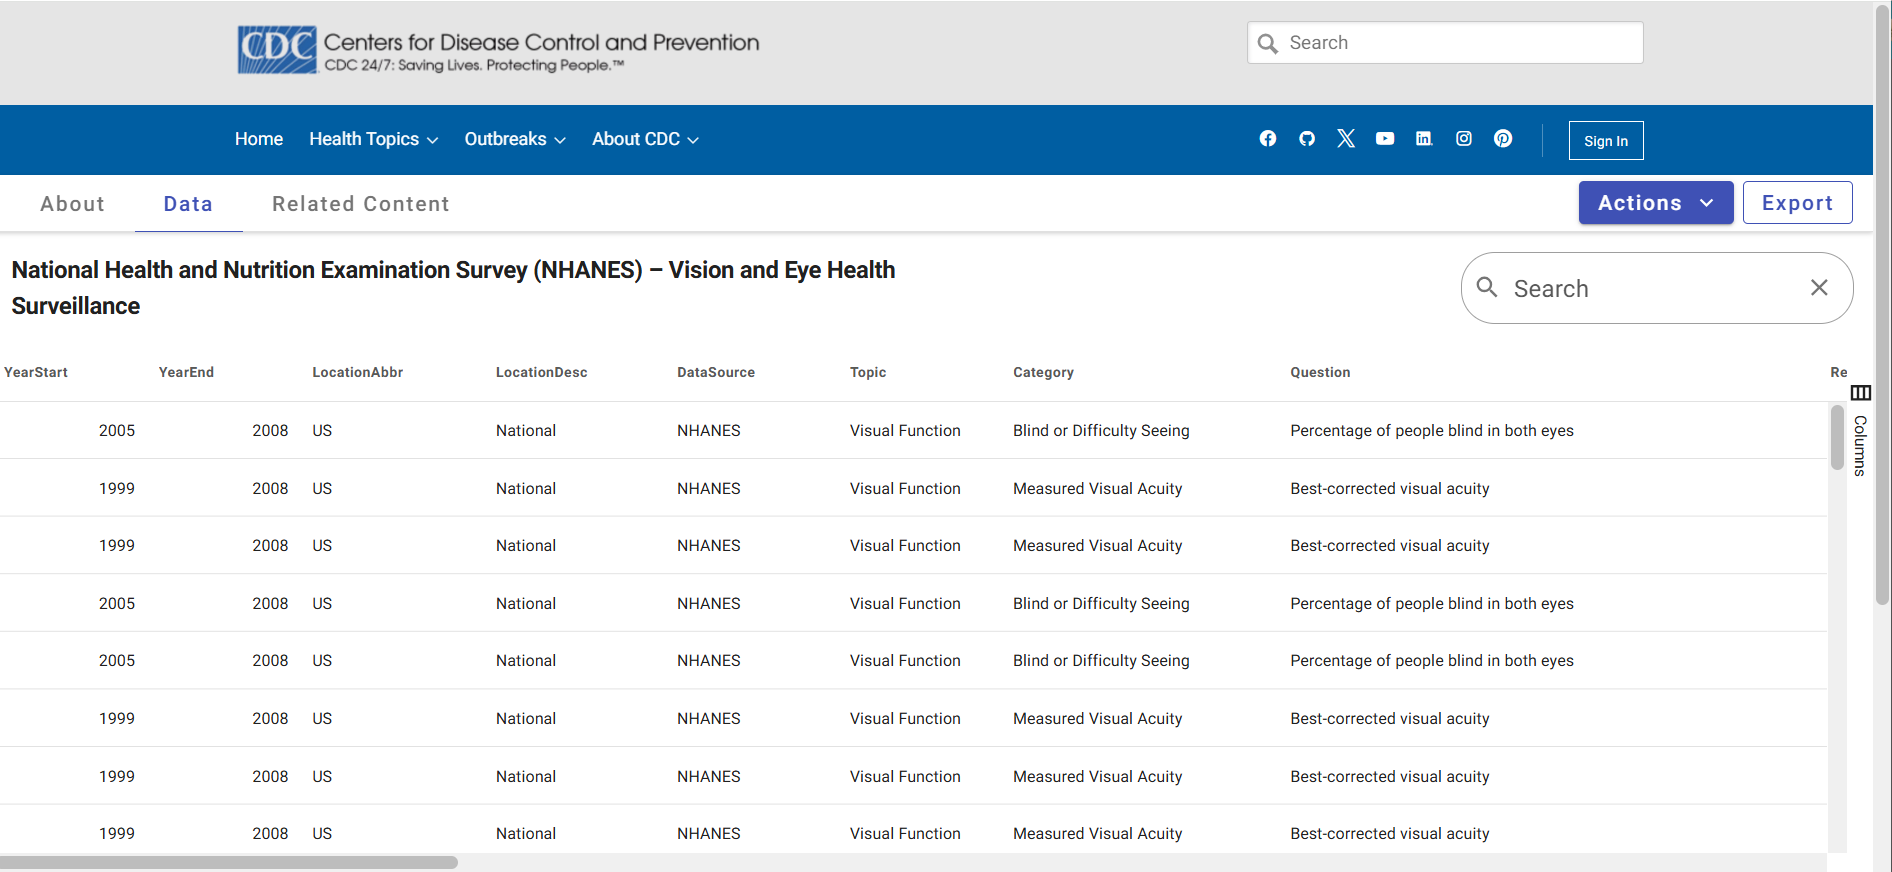
Access public use files (PUFs) containing prevalence estimates from most VEHSS data sources
Read about VEHSS Modeled Estimates, created by combining multiple data sources.
Search for vision and eye health indicators and view maps, charts, tables, and trend lines.
Read short reports including surveillance summaries, data spotlights, and research highlights
Documentation and Help

VEHSS documentation reports and publications.
Collection of VEHSS case definition and data indicator pages.
Learn how VEHSS brings many different sources of data together in one place.

Coming soon: a tutorial video series for VEHSS users.