Managed Vision Care
VSP Claims at a Glance
| VSP Vision Care | |
|---|---|
| Description | Managed Vision Care |
| Sample | Convenience sample of VSP Vision Care insurance members, representing more than 25% of the US population. |
| VEHSS Topics Included |
|
| Approximate Size | Not released |
VSP Vision Care is the nation’s largest managed vision care provider, operating as a nonprofit corporation for over 60 years. Managed vision care is a specialized supplemental insurance provided through employers, commercial health plans, Medicare/Medicaid supplemental plans, the federal employees health benefits program, tribes, or purchased individually to provide routine vision care coverage. Generally, VSP data includes optometric exams and procedures, diagnoses (refractive errors, eye disease, systemic disease, acute issues), vision correction utilization, prescriptions and materials dispensed, costs, provider information, and patient demographics.
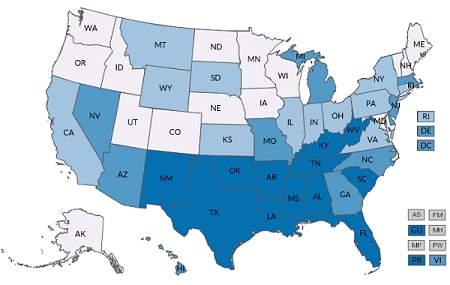
VSP does not report their patient volume, but reports that more than one in four Americans have VSP coverage. VSP processes claims in every state, but market penetration varies by state. VSP’s national network contains about 33,000 eye care professionals. Approximately 85% are Doctors of Optometry (OD, optometrist), and 15% are Doctors of Medicine (MD, ophthalmologist).
VSP claims contain the age and sex of patients, but do not include race/ethnicity. While covered eye exams are always reported by VSP, medical diagnoses in vision claims will underrepresent the actual prevalence of medical conditions. Medical diagnoses are generally not required for payment, thus their inclusion in claims by the billing practice is optional. VSP claims cannot alone be considered as estimates of diagnosed prevalence. However, diagnosis rates in VSP claims may be a proxy measure for the rate that these conditions may be identified within optometry practices.
For the VEHSS project, VSP calculated prevalence of diagnosed eye and vision disorders and prevalence of receipt of covered eye care services in managed vision care claims based on the presence of ICD9 and ICD10 diagnosis codes and CPT procedure codes on any patient claim during the year of observation.
| Included VEHSS Topics – Categories |
|---|
| Vision Problems and Blindness – Diagnosed Vision Disorders |
| Vision Care Services – Eye Exams |
| Vision Care Services – Imaging or Diagnostic Tests |
| Vision Care Services – Screening Services |
| Vision Care Services – Glasses or Contacts |
| Age-related Macular Degeneration (AMD) – AMD Prevalence |
| Age-related Macular Degeneration (AMD) – AMD Treatment |
| Cataract – Cataract Prevalence |
| Cataract – Cataract Treatment |
| Diabetic Retinopathy (DR) – DR Prevalence |
| Diabetic Retinopathy (DR) – DR Treatment |
| Glaucoma – Glaucoma Prevalence |
| Glaucoma – Glaucoma Treatment |
| Other Eye Disorders – Prevalence |
Available Geographic Levels
| National | State* |
|---|---|
| Included Stratification Factors (State and National Estimates) | |
|---|---|
| Age Group |
|
| Gender |
|
| Race/Ethnicity |
|
| Risk Factors |
|
| Data Type |
|
A detailed description of the analytical steps is described in the report “VEHSS Claims & Registry Data Analysis Plan [PDF – 579 KB] .”
Full analysis documentation is included in the “VEHSS VSP Data Report [PDF – 1.2 MB] .”
This analysis is subject to several potential limitations:
- VSP data is a convenience sample and is not nationally representative, although based on our review, about 1 in 4 Americans have VSP coverage and VSP claims represent the majority of the overall US vision insurance market.
- VEHSS does not publicly report patient counts for VSP claims.
- VSP claims are intended for billing purposes only. Diagnosis information included on claims is intended to justify payment. VSP provides payment primarily for routine eye exams and refraction correction, and therefore medical diagnoses are not generally required for payment. Therefore, diagnosis data on claims may suffer from bias or limited detail. For example, even if a patient has an eye disease, this diagnosis may not be present on a claim filed for routine eye exams or glasses. Medical diagnoses in VSP claims are likely to underrepresent the true burden of disease and cannot alone be considered prevalence estimates, even for the prevalence of diagnosed condition among VSP patients.
- VSP primarily covers routine vision and optometry care and will not include eye care services that are billed to medical insurers, nor any out-of-pocket or unbilled services.
- VSP denominator data is limited and is based primarily on employer-provided enrollment rolls. This data is not updated continuously and may differ from actual numbers of patients.
- Approximately 8% of patients in enrollment data do not have a state of residence listed and are therefore listed as missing. For the purposes of this analysis, we allocated the denominator count with missing state information to states using the distribution of known state locations. However, this may cause biased results. In addition, the use of provider location in the numerator and, in some cases, patient location from enrollment data in the denominator could also skew results. On the basis of internal analysis, VSP states that the potential impact of this bias is minimal.

