At a glance
- Compared to adults reporting no chronic disease, adults with at least one chronic disease were less active.
- Many older adults in the United States do not meet the recommendations for physical activity.
- Regular physical activity is vital for healthy aging and to prevent chronic health conditions.
- Communities can help adults become more physically active.
Problem
Many older adults in the United States do not meet the recommended amount of physical activity.
According to a study published in 2016 with data from 2014, among U.S. adults 50 years old and older:
- 28% were physically inactive.
- Inactivity was 30% higher among those with a chronic disease.
- Hispanic persons, non-Hispanic Black persons, and adults with lower education levels were more likely to be inactive.
Chronic diseases
This 2016 study also showed that physical inactivity is higher among adults 50 and older with 1 or more chronic diseases.
The study used data from the Behavioral Risk Factor Surveillance System (BRFSS). The graph below shows the percentage of self-reported inactivity for U.S. adults 50 and older.
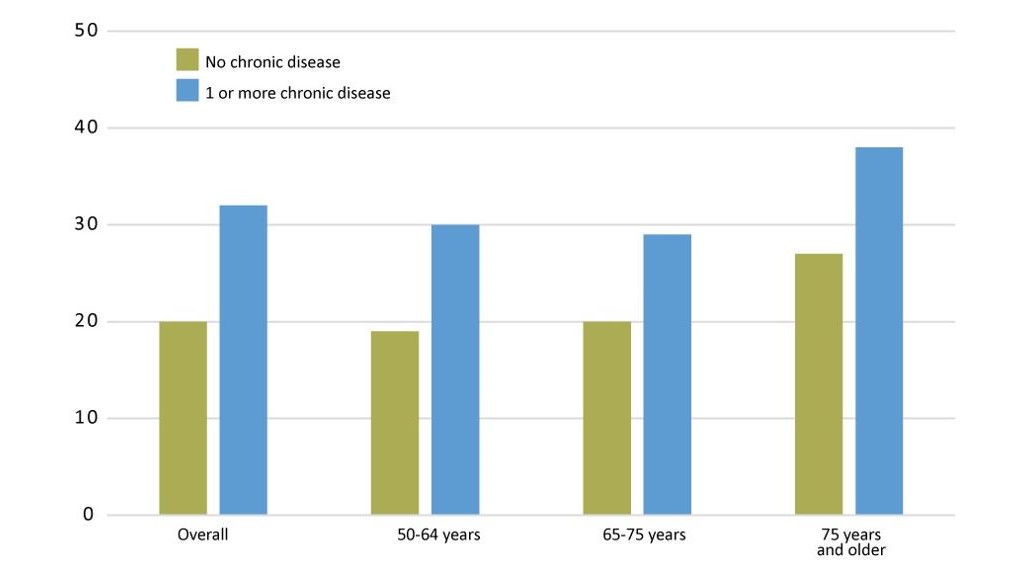
By age group, the prevalence of inactivity for adults with at least one chronic disease compared to those with no disease was 30.9% versus 18.1% for 50–64 years, 29.6% versus 19.2% for 65–74 years, and 37.3% versus 26.8% for people 75 and older.
Physical activity is essential for healthy aging
Physical activity can improve health and quality of life. Physical activity:
- Helps prevent or manage many chronic health conditions.
- Can reduce the risk of moderate or severe functional limitations.
- Reduces the risk of premature death.
- Supports positive mental health.
Physical inactivity increases health care costs
- Non-institutionalized adults 50 or older spend $860 billion annually on health care.
- 4 in 5 of the most costly chronic conditions among adults 50 or older can be prevented or managed with physical activity.
What can be done
Individuals, groups, and communities can help older adults be physically active.
The federal government is:
- Providing training and technical assistance to implement Step It Up! The Surgeon General's Call to Action to Promote Walking and Walkable Communities.
- Partnering with transportation organizations to develop and adopt environmental and policy supports for active transportation.
- Working with partners to develop a best-practices community planning model.
- Gathering and disseminating data on physical activity, walking, and walkability to inform decisions about active community design.
State and local officials can:
- Design communities that make it safe and easy for people of all ages and abilities to be active.
- Open and promote places in communities for adults 50 or older to be active, such as schools, parks, or malls.
- Provide evidence-based community programs that help adults, including those with chronic conditions, start and continue to be active.
- Work with health professionals to link adult patients to community programs and resources for physical activity.

Transportation engineers and community planning professionals can:
- Locate schools, worksites, businesses, parks, recreational facilities, and other destinations within walking distance of one another.
- Adopt community planning, land use, development, and zoning policies and plans that support physical activity for people of all ages and abilities.
- Support safe, efficient, and pedestrian-friendly public transit systems and transit-oriented development.
- Create and improve walking trails and parks.
Community organizations can:
- Provide safe and convenient access to community locations supporting all users' physical activity, such as parks, malls, and senior centers.
- Offer physical activity programs that help people to be as active as their abilities or conditions allow.
- Set up walking groups, buddy systems, and other forms of social support for physical activity.
- Promote the availability of safe, convenient, and well-designed community locations and programs that promote physical activity.
Everyone can:
- Be physically active with friends, family, and work colleagues regularly.
- Make walking to the store, the office, or the bus part of your daily routine.
- Try a recreational program designed for your age group or mobility level.
- Participate in local planning efforts that support safe and convenient places to be active.
Download this page as a fact sheet.