Transportation, Warehousing and Utilities Program
The National Institute for Occupational Safety and Health (NIOSH) Transportation, Warehousing and Utilities (TWU) Program works with partners in industry, labor, government agencies, trade associations, professional organizations, and academia. The program focuses on reducing injuries, illnesses, and fatalities among TWU workers, prioritizing areas related to:
- Transportation and fatigue
- Human-machine interaction
- Work-related obesity and chronic disease
- Use surveillance data and stakeholder input to guide research and prevention efforts in the TWU sector.
- Research and promote work organization factors and healthy behaviors to reduce fatigue, obesity, and chronic disease.
- Conduct research and provide recommendations to manufacturers, employers, workers, and others to reduce transportation and machine-related injuries.
- Work with partners and the National Occupational Research Agenda (NORA) TWU Sector Council to disseminate research findings and prevention recommendations.
Published peer-reviewed journal articles about:
- Adverse health behaviors and conditions among maritime workers between 2014 and 2018. Compared to other workers, maritime workers had higher weighted prevalence estimates for six of ten health behaviors and conditions.
- Fatigue research needs in the transportation and utilities industries. Further research into the incidence and characterization of fatigue, and how to adapt, implement, and evaluate strategies for fatigue mitigation are critical for the health, safety, well-being, and productivity of workers in the TWU sector.
- Working conditions influencing drivers’ safety and well-being in the transportation industry. Three primary themes were identified: lack of trust between drivers and supervisors, the scheduling of shifts and routes, and difficulty performing positive health behaviors.
- The incidence of workers’ compensation claims in opioid-using truck drivers. Drivers who reported opioid use at their initial medical exam visit filed subsequent workers’ compensation claims 1.81 times sooner.
- Reported unrealistically tight delivery schedules for truck drivers. Drivers reported often receiving an unrealistically tight delivery schedule were significantly more likely to drive over the speed limit and violate hours of service.
- Publish a research article on COVID-19 exposure reduction in aircraft cabins.
- Publish a research article describing directions for improving truck driver health, safety, and well-being.
- Analyze new data to examine the relationship between working conditions and chronic diseases like diabetes, obesity, and heart disease.
- Complete discussion groups with TWU industry partners on research needs and accomplishments related to the TWU subsectors.

Mention of any company or product does not constitute endorsement by the National Institute for Occupational Safety and Health, Centers for Disease Control and Prevention
The TWU Program provides leadership to eliminate occupational injuries, illnesses, and fatalities among the 8.4 million workers in this sector. This snapshot shows recent accomplishments and upcoming work.

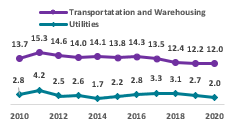
Source: U.S. Bureau of Labor Statistics.

Source: Adapted from the National Highway Traffic Safety Administration graphic “Five Eras of Safety”

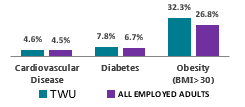
Source: 2013-2015 Behavioral Risk Factor Surveillance System Note: BMI= body mass index
To learn more, visit
www.cdc.gov/niosh/programs/twu
August 2022
