High Influenza Incidence and Disease Severity Among Children and Adolescents Aged <18 Years ― United States, 2022–23 Season
Weekly / October 13, 2023 / 72(41);1108–1114
Elizabeth B. White, PhD1,2; Alissa O’Halloran, MSPH1; Devi Sundaresan, MPH1; Matthew Gilmer, MS1,3; Ryan Threlkel, MPH1; Arielle Colón, MPH1; Katie Tastad, PhD1; Shua J. Chai, MD4,5; Nisha B. Alden, MPH6; Kimberly Yousey-Hindes, MPH7; Kyle P. Openo, DrPH8,9,10; Patricia A. Ryan, MS11; Sue Kim, MPH12; Ruth Lynfield, MD13; Nancy Spina, MPH14; Brenda L. Tesini, MD15; Marc Martinez, BA16; Zachary Schmidt, MPH17; Melissa Sutton, MD18; H. Keipp Talbot, MD19; Mary Hill, MPH20; Matthew Biggerstaff, ScD1; Alicia Budd, MPH1; Shikha Garg, MD1; Carrie Reed, DSc1; A. Danielle Iuliano, PhD1; Catherine H. Bozio, PhD1 (View author affiliations)
View suggested citationSummary
What is already known about this topic?
The 2022–23 influenza season began early, coinciding with circulation of other respiratory viruses. High hospitalization rates among children and adolescents were observed.
What is added by this report?
Among children and adolescents aged <18 years, 2022–23 was a high severity influenza season compared with thresholds based on previous seasons’ data; influenza-associated medical visits and hospitalizations met or exceeded incidence in previous seasons.
What are the implications for public health practice?
CDC recommends that all persons aged ≥6 months without contraindications should receive the annual seasonal influenza vaccine, ideally by the end of October.
Altmetric:

Abstract
During the 2022–23 influenza season, early increases in influenza activity, co-circulation of influenza with other respiratory viruses, and high influenza-associated hospitalization rates, particularly among children and adolescents, were observed. This report describes the 2022–23 influenza season among children and adolescents aged <18 years, including the seasonal severity assessment; estimates of U.S. influenza-associated medical visits, hospitalizations, and deaths; and characteristics of influenza-associated hospitalizations. The 2022–23 influenza season had high severity among children and adolescents compared with thresholds based on previous seasons’ influenza-associated outpatient visits, hospitalization rates, and deaths. Nationally, the incidences of influenza-associated outpatient visits and hospitalization for the 2022–23 season were similar for children aged <5 years and higher for children and adolescents aged 5–17 years compared with previous seasons. Peak influenza-associated outpatient and hospitalization activity occurred in late November and early December. Among children and adolescents hospitalized with influenza during the 2022–23 season in hospitals participating in the Influenza Hospitalization Surveillance Network, a lower proportion were vaccinated (18.3%) compared with previous seasons (35.8%–41.8%). Early influenza circulation, before many children and adolescents had been vaccinated, might have contributed to the high hospitalization rates during the 2022–23 season. Among symptomatic hospitalized patients, receipt of influenza antiviral treatment (64.9%) was lower than during pre–COVID-19 pandemic seasons (80.8%–87.1%). CDC recommends that all persons aged ≥6 months without contraindications should receive the annual influenza vaccine, ideally by the end of October.
Introduction
During the 2022–23 season, influenza activity in the United States began in early October, earlier than in most previous seasons, and returned to pre–COVID-19 levels (1). In addition, high pediatric influenza hospitalization rates in the southeast (2), co-circulation of influenza virus with SARS-CoV-2 and respiratory syncytial virus (RSV), and a limited reduction in the availability of the influenza antiviral medication oseltamivir* were observed. Each year, CDC assesses seasonal severity by comparing current season’s influenza activity with thresholds based on peak influenza activity in previous seasons (3) and estimates the numbers and rates of influenza-associated medical visits, hospitalizations, and deaths in the United States (4). This report describes the 2022–23 influenza season among children and adolescents, including seasonal severity, estimated incidence, and characteristics of hospitalized patients. This analysis focuses on the 2022–23 influenza season compared with 2016–17 through 2021–22, excluding 2020–21 (during the peak of the COVID-19 pandemic) when influenza activity was minimal.
Methods
CDC classifies each influenza season’s severity using three indicators. First, the percentage of all outpatient visits for influenza-like illness (ILI), defined as fever plus cough or sore throat, is obtained from the U.S. Outpatient Influenza-like Illness Surveillance Network (ILINet) (5). Second, rates of laboratory-confirmed influenza hospitalization† are estimated through the Influenza Hospitalization Surveillance Network (FluSurv-NET)§,¶ (6). Finally, the percentage of all deaths due to influenza is calculated from National Vital Statistics System death registry data** (5). For each severity indicator, 50th, 90th, and 98th percentile intensity thresholds (ITs) are calculated from a distribution based on the geometric mean of peak weekly values in previous seasons†† (3,7). Seasonal severity is classified as low if at least two of the three indicators peak below IT50, and as moderate, high, or very high if at least two of the three indicators peak above IT50, IT90, or IT98, respectively.
The incidence of influenza-associated outpatient visits, hospitalizations, and deaths is estimated each season and is presented in this report as events per 100,000 population. Influenza-associated hospitalizations are estimated by applying the FluSurv-NET hospitalization rates, after adjustment for possible underdetection based on the probability of being tested and diagnostic test sensitivity,¶ to the U.S. population. To estimate influenza-associated outpatient visits, the ratio of outpatient illnesses to hospitalizations and the proportion of those with ILI who seek care are applied to the hospitalization estimates. To estimate influenza-associated deaths, the ratio of hospitalizations to deaths is applied to the hospitalization estimates (4,8). Pediatric rates are estimated for children aged <5 years and for children and adolescents aged 5–17 years.
Characteristics of influenza-associated hospitalizations, including influenza vaccination status,§§ were abstracted from medical charts by trained FluSurv-NET surveillance staff members using a standard case report form. Data were collected for all hospitalized children and adolescents across the 2016–17 through 2021–22 seasons and for an age-stratified sample during the 2022–23 season. Weighted proportions are reported overall and by age group (<5 and 5–17 years).
This analysis presents preliminary 2022–23 season data,¶¶ reported as of September 21, 2023, among children and adolescents, compared with data from 2016–17 through 2021–22 (excluding 2020–21). Analyses were conducted using R (version 4.1.2; R Foundation) and SAS (version 9.4; SAS Institute). This activity was reviewed by CDC, deemed not research, and was conducted consistent with applicable federal law and CDC policy.*** FluSurv-NET sites obtained human subjects and ethics approval from their respective state health department, academic partner, and participating hospital institutional review boards.
Results
For children and adolescents, the 2022–23 influenza season was classified as high severity, with the weekly percentage of outpatient visits for ILI, influenza-associated hospitalization rate, and percentage of deaths due to influenza all peaking between IT90 and IT98 (Figure 1). The percentage of outpatient visits that were for ILI and the rate of influenza-associated hospitalizations peaked in late November 2022, 3 weeks before the percentage of influenza deaths peaked; deaths remained high for 4 weeks in December 2022.
Nationally, point estimates of the rates of influenza-associated medical visits, hospitalization, and death estimated during the 2022–23 season were higher among children aged <5 years than among children and adolescents aged 5–17 years (Figure 2). However, among children and adolescents aged 5–17 years, rates of influenza-associated medical visits and hospitalizations were higher during 2022–23 than any season since 2016–17. Children aged <5 years had the second highest rates of influenza-associated medical visits (11,443 per 100,000) and hospitalization (119 per 100,000) in 2022–23 since the 2016–17 season. Rates of influenza-associated deaths in 2022–23 were low and consistent with previous seasons: 1.2 per 100,000 among children <5 and 0.5 per 100,000 among children and adolescents aged 5–17 years (Supplementary Figure, https://stacks.cdc.gov/view/cdc/133678).
During October 1, 2022–April 30, 2023, FluSurv-NET identified 2,762 influenza-associated hospitalizations in children and adolescents aged <18 years, 2,108 of which were sampled and had clinical data available. The median age was 5 years (IQR = 2–9 years), 57.4% were male, and 50.5% had an underlying condition, similar to recent seasons (Table). The most common underlying medical conditions were asthma, neurologic disorders, and obesity. Most (95.4%) infections were with influenza A virus; 80.2% of those subtyped were A(H3N2) and 19.6% were A(H1N1)pdm09. More than one half (57.1%) of the 2022–23 season’s total pediatric hospitalizations occurred during October and November 2022, higher than the percentages occurring in October and November in the 2016–17 through 2021–22 seasons (1.6%–6.8%). Among hospitalized children and adolescents in 2022–23, 18.3% had received an influenza vaccine, compared with 35.8%–41.8% in 2016–17 through 2021–22. The proportion of pediatric patients with respiratory symptoms who received influenza antiviral treatment during their hospitalization in 2022–23 (64.9%) was similar to the proportion in 2021–22 (61.5%), but lower than that during pre–COVID-19 pandemic seasons (80.8%–87.1%). Among all pediatric hospitalizations, the proportions who were admitted to an intensive care unit (18.4%), who required invasive mechanical ventilation (4.7%), or who died in hospital (0.4%) were similar to the proportions during previous influenza seasons.
Discussion
The 2022–23 influenza season was classified as high severity among children and adolescents, the fourth season with that classification since the 2009 influenza A(H1N1) pandemic. Further, all three severity indicators not only surpassed intensity levels for high severity, but the peaks also occurred early in the season (late November and early December) (1). National estimates of the rates of influenza-associated medical visits and hospitalizations were higher than those during most previous seasons for children aged <5 years and children and adolescents aged 5–17 years. This high incidence strained health care systems, particularly with the co-circulation of SARS-CoV-2 and RSV.†††
Among children and adolescents hospitalized with influenza during 2022–23, a substantially lower proportion were vaccinated compared with previous seasons, which could be related to low vaccination coverage in the population, high vaccine effectiveness, or both. The National Immunization Survey§§§ estimates that when pediatric influenza-associated hospitalization rates peaked during the week ending November 26, 2022, only 41.9% of children and adolescents aged 6 months–17 years nationwide had received their annual influenza vaccination (compared with 55.1% by the end of the season). Influenza vaccination coverage by the end of November was similar in 2022 and in 2021 (45.0%), but lower than in 2019 (51.9%) and 2020 (49.7%). Preliminary assessments have shown that the 2022–23 influenza vaccine provided moderately strong (68%) protection against pediatric hospitalization.¶¶¶ The combination of low influenza vaccine coverage early in the season and unusually early influenza activity (57.1% of the season’s pediatric hospitalizations occurred by the end of November) likely contributed to the high observed rate of influenza-associated hospitalization, despite the moderately strong protection from the 2022–23 influenza vaccine. In addition, a lower proportion of symptomatic hospitalized patients in 2022–23 received influenza antiviral medication compared with that during pre–COVID-19 pandemic seasons. Taken together, these findings underscore the importance of children and adolescents receiving a seasonal influenza vaccination, ideally by the end of October (9), and prompt influenza antiviral treatment for those who are hospitalized.****
Limitations
The findings in this report are subject to at least five limitations. First, within FluSurv-NET, influenza testing was performed at the clinician’s discretion or based on facility-level practices, which might affect the observed clinical epidemiology of influenza-associated hospitalizations. Second, severity assessment and incidence estimation adjustments for the frequency of influenza testing and other ratios were based on previous seasons’ data and might not reflect current testing practices or health care–seeking behaviors. Third, FluSurv-NET catchment areas cover approximately 9.0% of the U.S. population; characteristics of children and adolescents hospitalized with influenza might not be generalizable to all pediatric hospitalizations in the United States. Fourth, historical data used for the severity assessment might be a suboptimal comparison if recent influenza activity differs from that before the COVID-19 pandemic; classifications of being above or between threshold levels are qualitative and do not reflect statistical differences. Finally, comparisons of rates of influenza-associated outpatients visits, hospitalizations, and deaths across seasons based on point estimates are descriptive and intended to highlight trends, not statistical differences.
Implications for Public Health Practice
The 2022–23 influenza season was classified as high severity for children and adolescents based on influenza-associated outpatient visits, hospitalization rates, and deaths. Among hospitalized children and adolescents with influenza, receipt of influenza vaccine was lower than that during previous seasons, which might have been in part related to most influenza hospitalizations occurring earlier. The proportion of pediatric hospitalizations treated with influenza antiviral medication was lower than in pre–COVID-19 pandemic seasons; prompt antiviral treatment is important for symptomatic patients hospitalized with influenza. All persons aged ≥6 months are recommended by CDC to receive the annual seasonal influenza vaccine, ideally by the end of October.
Acknowledgments
Ashley Coates, Brenna Hall, Joelle Nadle, Monica Napoles, Jeremy Roland, Gretchen Rothrock, California Emerging Infections Program; Diane Ankovic, Isaac Armistead, Elizabeth Austin, Violet Bain, Henley Huang, Colorado Department of Public Health & Environment; Maria Correa, Julia Desiato, Sarah Katsandres, Daewi Kim, Noelle Labozzo, James Meek, Julie Plano, Emily Zmek, Connecticut Emerging Infections Program, Yale School of Public Health; Emily Bacon, Marina Bruck, Meghann Cantey, Rayna Ceaser, Gracie Chambers, Alyssa Clausen, Taylor Eisenstein, Emily Fawcett, Sydney Hagley-Alexander, Sabrina Hendrick, Johanna Hernandez, Asmith Joseph, Grayson Kallas, Jana Manning, Annabel Patterson, Allison Roebling, MaCayla Servais, Chandler Surell, Emma Grace Turner, Katelyn Ward, Hope Wilson, Emory University School of Medicine, Georgia Emerging Infections Program, Georgia Department of Public Health, Atlanta Veterans Affairs Medical Center; Alicia Brooks, Maya Monroe, Maryland Department of Health; Chloe Brown, Jim Collins, Anna Falkowski, Justin Henderson, Shannon Johnson, Lauren Leegwater, Lindsay Leigh, Elizabeth McCormick, Sanchitha Meda, Alyanna Melicor, Val Tellez Nunez, Libby Reeg, Michigan Department of Health & Human Services; Alli Johnson, Cynthia Kenyon, Melissa McMahon, Minnesota Department of Health; Yomei Shaw, Chad Smelser, Daniel M. Sosin, New Mexico Department of Health; Kathy M. Angeles, Molly Bleecker, Nancy Eisenberg, Emily Hancock, Sarah A. Khanlian, Sarah Lathrop, Francesca Pacheco, Mayvilynne Poblete, Yadira Salazar-Sanchez, New Mexico Emerging Infections Program; Caroline McCahon, CDC Foundation, New Mexico Department of Health; Bridget Anderson, Kerianne Engesser, Suzanne McGuire, Adam Rowe, Jemma Rowlands, New York State Department of Health; Nancy Bennett, Sophrena Bushey, Christina Felsen, Maria Gaitan, Erin Licherdell, Kevin Popham, Katherine St. George, University of Rochester School of Medicine and Dentistry; Laurie Billing, Denise Ingabire-Smith, Nancy Moran, Eli Shiltz, Rebekah Sutter, Ohio Department of Health; M. Andraya Hendrick, Public Health Division, Oregon Health Authority; Kathy Billings, Katie Dyer, Gail Hughett, Karen Leib, Tiffanie Markus, Terri McMinn, Danielle Ndi, William Schaffner, Sweta Tiwari, Vanderbilt University Medical Center; Ryan Chatelain, Melanie Crossland, Andrea George, Emma Mendez, Kristen Olsen, Andrea Price, Ashley Swain, Salt Lake County Health Department; Charisse Cummings, Nick Dempster, Daneisha Hawkins, Stacy Huang, David Ujamaa, Influenza Division, National Center for Immunization and Respiratory Diseases, CDC; Farida Ahmad, Jodi Cisewski, National Center for Health Statistics, CDC.
Corresponding author: Elizabeth B. White, trj4@cdc.gov.
1Influenza Division, National Center for Immunization and Respiratory Diseases, CDC; 2Epidemic Intelligence Service, CDC; 3Goldbelt Professional Services, Chesapeake, Virginia; 4California Emerging Infections Program, Oakland, California; 5Office of Readiness and Response, CDC; 6Colorado Department of Public Health & Environment; 7Connecticut Emerging Infections Program, Yale School of Public Health, New Haven, Connecticut; 8Georgia Emerging Infections Program, Georgia Department of Public Health, Atlanta, Georgia; 9Emory University School of Medicine, Atlanta, Georgia; 10Atlanta Veterans Affairs Medical Center, Decatur, Georgia; 11Maryland Department of Health; 12Michigan Department of Health & Human Services; 13Minnesota Department of Health; 14New York State Department of Health; 15University of Rochester School of Medicine and Dentistry, Rochester, New York; 16New Mexico Department of Health; 17Ohio Department of Health; 18Public Health Division, Oregon Health Authority, Portland, Oregon; 19Vanderbilt University Medical Center, Nashville, Tennessee; 20Salt Lake County Health Department, Salt Lake City, Utah.
All authors have completed and submitted the International Committee of Medical Journal Editors form for disclosure of potential conflicts of interest. Sue Kim reports institutional support from the Michigan Department of Health & Human Services and the Council of State and Territorial Epidemiologists (CSTE). Ruth Lynfield is a member of CSTE and serves on the program committee for ID Week and is an associate editor for the American Academy of Pediatrics’ (AAP) Red Book (for which she donated the received fee to the Minnesota Department of Health) and is an executive officer of CSTE and the National Foundation for Infectious Diseases (NFID). She receives support for attending meetings of CSTE, NFID, the Infectious Diseases Society of America, and AAP. Kimberly Yousey-Hindes reports receipt of an honorarium for delivering an invited lecture at Western Connecticut State University in October 2020, and receipt of support for travel to the International Influenza Assessor Training by CSTE in January 2023. No other potential conflicts of interest were disclosed.
* https://emergency.cdc.gov/han/2022/han00482.asp
† A FluSurv-NET patient was defined as a person who 1) was a resident of the surveillance catchment area, 2) had a hospital admission during October 1–April 30 of a given season, and 3) received a positive influenza test result ≤14 days before or anytime during hospitalization.
§ FluSurv-NET is a population-based surveillance network for influenza-associated hospitalizations. The 2022–23 season included data from selected counties in 13 U.S. states, covering approximately 9% of the U.S. population: California, Colorado, Connecticut, Georgia, Maryland, Michigan, Minnesota, New Mexico, New York, Ohio, Oregon, Tennessee, and Utah.
¶ Within hospitals participating in FluSurv-NET, influenza testing is performed at the clinician’s discretion or based on facility-level practices. For the severity assessment and incidence estimates, influenza-associated hospitalization rates were adjusted for influenza testing practices and diagnostic test sensitivity to account for possible underdetection of influenza test–positive hospitalizations.
** The National Center for Health Statistics (NCHS) collects death certificate data from state vital statistics offices for all deaths occurring in the United States. Deaths included in the U.S. Influenza Surveillance System are those classified based on International Classification of Diseases, Tenth Revision (ICD-10) cause of death codes as associated with influenza, COVID-19, or pneumonia. Data are aggregated by the week of death occurrence. To avoid bias arising from COVID-19, counts of NCHS ICD-10–coded influenza deaths were used instead of pneumonia and influenza deaths to calculate mortality thresholds and assess severity.
†† ITs for the percentage of outpatient visits for ILI were calculated using ILINet data from 2016–17 through 2021–22, excluding 2020–21. ITs for influenza-associated hospitalizations were calculated using FluSurv-NET data from 2006–07 through 2021–22, excluding 2011–12 and 2020–21. ITs for the percentage of deaths due to influenza were calculated using NCHS data from 2010–11 through 2021–22, excluding 2011–12 and 2020–21.
§§ A patient was considered to have received the current seasonal influenza vaccine if ≥1 dose was administered ≥14 days before receipt of a positive influenza test result. Ascertainment of vaccination status was performed using hospital records, state immunization registries, primary care provider surveys, and patient or proxy interview.
¶¶ FluSurv-NET data, as well as incidence and severity estimates, are current as of September 21, 2023. Incidence and severity analyses are finalized once data on testing practices are available, usually 2 years after the end of the season. Incidence estimates and severity assessment interpretations might change.
*** 45 C.F.R. part 46.102(l)(2), 21 C.F.R. part 56; 42 U.S.C. Sect. 241(d); 5 U.S.C. Sect. 552a; 44 U.S.C. Sect. 3501 et seq.
††† https://emergency.cdc.gov/han/2022/pdf/CDC_HAN_479.pdf
§§§ https://www.cdc.gov/flu/fluvaxview/dashboard/vaccination-dashboard.html (Accessed September 21, 2023).
¶¶¶ https://www.cdc.gov/flu/vaccines-work/2022-2023.html
**** https://www.cdc.gov/flu/professionals/antivirals/summary-clinicians.htm#summary
References
- Daly P, Colón A, Merced-Morales A, et al. Influenza (flu): influenza activity in the United States during the 2022–23 season and composition of the 2023–24 influenza vaccine. Atlanta, GA: US Department of Health and Human Services, CDC; 2023. https://www.cdc.gov/flu/spotlights/2023-2024/22-23-summary-technical-report.htm
- Thomas CM, White EB, Kojima N, et al. Early and increased influenza activity among children—Tennessee, 2022–23 influenza season. MMWR Morb Mortal Wkly Rep 2023;72:49–54. https://doi.org/10.15585/mmwr.mm7203a1 PMID:36656786
- CDC. Influenza (flu). How CDC classifies flu severity. Atlanta, GA: US Department of Health and Human Services, CDC; 2023. https://www.cdc.gov/flu/about/classifies-flu-severity.htm
- CDC. Influenza (flu). How CDC estimates the burden of seasonal influenza in the U.S. Atlanta, GA: US Department of Health and Human Services, CDC; 2023. https://www.cdc.gov/flu/about/burden/how-cdc-estimates.htm
- CDC. Influenza (flu). U.S. influenza surveillance: purpose and methods. Atlanta, GA: US Department of Health and Human Services, CDC; 2023. Accessed September 18, 2022. https://www.cdc.gov/flu/weekly/overview.htm
- Chaves SS, Lynfield R, Lindegren ML, Bresee J, Finelli L. The US Influenza Hospitalization Surveillance Network. Emerg Infect Dis 2015;21:1543–50. https://doi.org/10.3201/eid2109.141912 PMID:26291121
- Biggerstaff M, Kniss K, Jernigan DB, et al. Systematic assessment of multiple routine and near real-time indicators to classify the severity of influenza seasons and pandemics in the United States, 2003–2004 through 2015–2016. Am J Epidemiol 2018;187:1040–50. https://doi.org/10.1093/aje/kwx334 PMID:29053783
- Reed C, Chaves SS, Daily Kirley P, et al. Estimating influenza disease burden from population-based surveillance data in the United States. PLoS One 2015;10:e0118369. https://doi.org/10.1371/journal.pone.0118369 PMID:25738736
- Grohskopf LA, Blanton LH, Ferdinands JM, Chung JR, Broder KR, Talbot HK. Prevention and control of seasonal influenza with vaccines: recommendations of the Advisory Committee on Immunization Practices—United States, 2023–24 influenza season. MMWR Recomm Rep 2023;72(No. RR-2):1–25. https://doi.org/10.15585/mmwr.rr7202a1
 FIGURE 1. Percentage of outpatient visits for influenza-like illness (A), influenza-associated hospitalization rates (B), and percentage of all-cause deaths due to influenza (C) among children and adolescents aged <18 years — United States, 2022–23 influenza season*
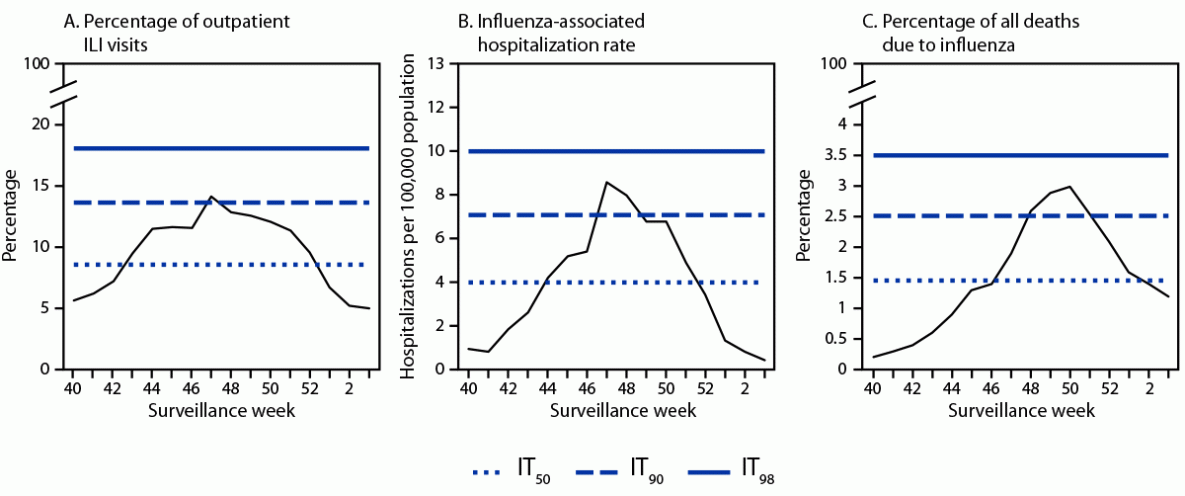
Abbreviations: FluSurv-NET = Influenza Hospitalization Surveillance Network; ILI = influenza-like illness; ILINet = Outpatient Influenza-like Illness Surveillance Network; IT = intensity threshold; NCHS = National Center for Health Statistics.
* In 2022–23, ITs for the percentage of outpatient visits for ILI were calculated using ILINet data from 2016–17 through 2021–22, excluding 2020–21. ITs for influenza-associated hospitalizations were calculated using FluSurv-NET data from 2006–07 through 2021–22, excluding 2011–12 and 2020–21. ITs for the percentage of deaths due to influenza were calculated using NCHS data from 2010–11 through 2021–22, excluding 2011–12 and 2020–21.
FIGURE 2. Influenza-associated medical visits* (A and C) and influenza-associated hospitalizations* (B and D) among children aged <5 years and children and adolescents aged 5–17 years — United States, 2016–17 through 2022–23 influenza seasons†
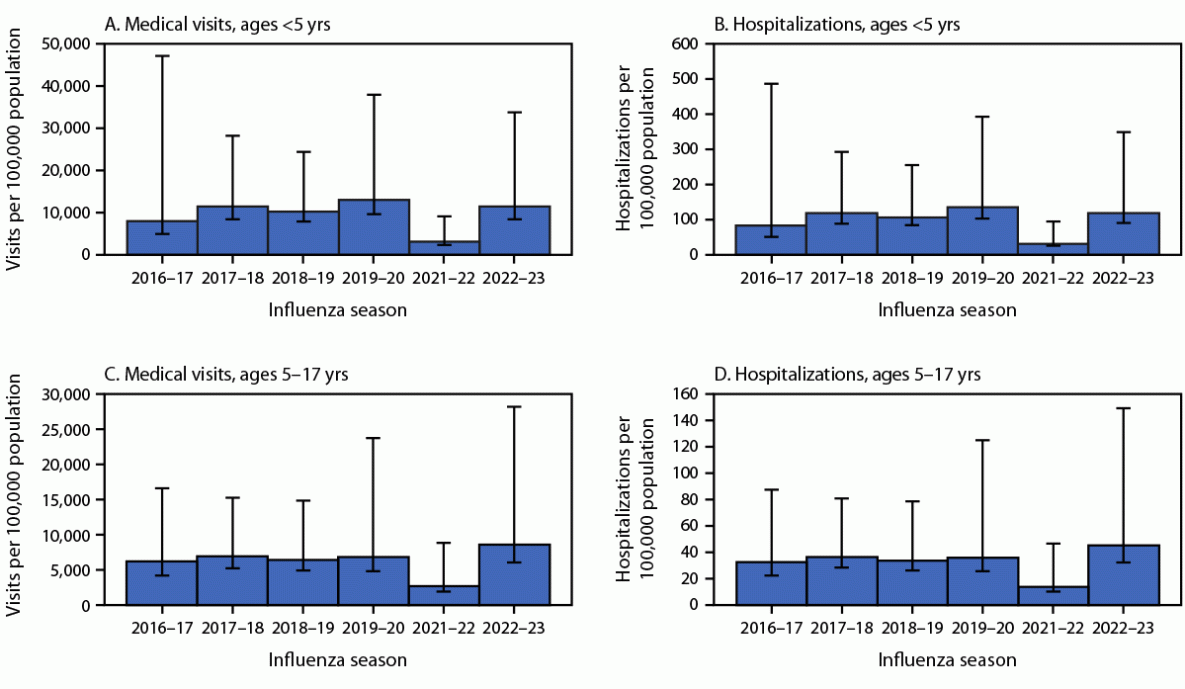
* With 95% credible intervals indicated by error bars.
† Excluding 2020–21.
* Excluding 2020–21.
† Among 49% of Influenza A specimens that were subtyped.
§ Excluding children aged <6 months, who are not eligible to receive influenza vaccine.
¶ At least one of the following conditions: asthma, chronic lung disease, chronic metabolic disease (e.g., diabetes), blood disorder, cardiovascular disease, neurologic disorder, immunocompromising condition, obesity, renal disease, or liver disease.
** Restricted to patients with respiratory symptoms.
Suggested citation for this article: White EB, O’Halloran A, Sundaresan D, et al. High Influenza Incidence and Disease Severity Among Children and Adolescents Aged <18 Years ― United States, 2022–23 Season. MMWR Morb Mortal Wkly Rep 2023;72:1108–1114. DOI: http://dx.doi.org/10.15585/mmwr.mm7241a2.
MMWR and Morbidity and Mortality Weekly Report are service marks of the U.S. Department of Health and Human Services.
Use of trade names and commercial sources is for identification only and does not imply endorsement by the U.S. Department of
Health and Human Services.
References to non-CDC sites on the Internet are
provided as a service to MMWR readers and do not constitute or imply
endorsement of these organizations or their programs by CDC or the U.S.
Department of Health and Human Services. CDC is not responsible for the content
of pages found at these sites. URL addresses listed in MMWR were current as of
the date of publication.
All HTML versions of MMWR articles are generated from final proofs through an automated process. This conversion might result in character translation or format errors in the HTML version. Users are referred to the electronic PDF version (https://www.cdc.gov/mmwr) and/or the original MMWR paper copy for printable versions of official text, figures, and tables.
Questions or messages regarding errors in formatting should be addressed to mmwrq@cdc.gov.