Diagnoses of HIV Infection Among Adults Aged 50 Years and Older—United States and 6 Dependent Areas 2014–2018

Diagnoses of HIV Infection Among Adults Aged 50 Years and Older—United States and 6 Dependent Areas 2014–2018
This issue of HIV Surveillance Data Tables is published by the Division of HIV/AIDS Prevention, National Center for HIV/AIDS, Viral Hepatitis, STD, and TB Prevention, Centers for Disease Control and Prevention (CDC), U.S. Department of Health and Human Services, Atlanta, Georgia.
Data are presented for diagnoses of HIV infection reported to CDC through December 2019.
The HIV Surveillance Data Tables is not copyrighted and may be used and copied without permission. Citation of the source is, however, appreciated.
Suggested Citation
Centers for Disease Control and Prevention. Diagnoses of HIV infection among adults aged 50 years and older—United States and 6 dependent areas, 2014–2018. HIV Surveillance Data Tables 2020;1(No. 5) http://www.cdc.gov/hiv/library/reports/surveillance-data-tables/vol-1-no-5/index.html. Published August 2020. Accessed [date].
Surveillance of HIV Infection
Persons aged 50 years and older account for a substantial number of HIV infections. Persons aged 50 years and older accounted for 17% of all diagnoses in 2018 and 51% of persons living with diagnosed HIV infection in the United States in 2018 [1]. Understanding the burden of HIV among different subgroups of older persons can help HIV programs to focus on populations and areas at greatest need for HIV prevention, treatment, and care services. Data presented for persons aged 50 years and older were reported (after the removal of personally identifiable information) to the Centers for Disease Control and Prevention (CDC) through December 2019. Please use caution when interpreting the following:
- Data on diagnoses of HIV infection. HIV surveillance reports may not be representative of all persons with HIV because not all infected persons have been (1) tested or (2) tested at a time when the infection could be detected and diagnosed. Also, some states offer anonymous HIV testing; the results of anonymous tests are not reported to the confidential, name-based HIV registries of state and local health departments. Therefore, reports of confidential test results may not represent all persons who tested positive for HIV infection.
- Deaths and prevalence-based data. Data for the year 2018 are considered preliminary and are based on deaths reported to CDC through December 2019.
- Numbers less than 12, and rates and trends based on these numbers.
Data re-release agreements between CDC and state/local HIV surveillance programs require specific levels of cell suppression at the state and county level in order to ensure confidentiality of personally identifiable information.
Tabulation and Presentation of Data
The data are presented for adults aged 50 years and older with HIV infection diagnosed during 2014–2018. The tables also present data for persons living with diagnosed HIV infection (prevalence) as of December 31 of the specified year. Tables are presented in 2 formats. Tables in the first format—labeled “a”—exclude data from the dependent areas (American Samoa, Guam, the Northern Mariana Islands, Puerto Rico, the Republic of Palau, and the U.S. Virgin Islands). Tables in the second format— labeled “b”—include data from the dependent areas.
Diagnosis of HIV Infection
Diagnoses of HIV infection are the numbers and rates of persons aged 50 years and older with HIV diagnosed during the specified years (Tables 1a/b–6). The term diagnosis of HIV infection is defined as a diagnosis of HIV infection regardless of the stage of disease (stage 0, 1, 2, 3 [AIDS], or unknown) and refers to all persons with a diagnosis of HIV infection. Data from all areas (where indicated) are included in tables displaying numbers and rates of diagnoses of HIV infection and of diagnoses of infection classified as stage 3 (AIDS) at time of HIV diagnosis (Tables 18a/b–20a/b), by selected characteristics, area of residence, and region of residence. For tables presenting diagnosis data, region or area of residence reflects the address at the time of HIV diagnosis.
More information on counting diagnoses of HIV infection can be found in the Technical Notes of the 2018 HIV Surveillance Report at https://www.cdc.gov/hiv/library/reports/hiv-surveillance/vol-31/index.html.
Prevalence: Persons Living with Diagnosed HIV Infection
Prevalence trends and data reflect persons living with diagnosed HIV infection, regardless of the stage of disease, at the end of a given year during 2014–2018 (Tables 7a/b–13). For tables presenting prevalence data, region or area of residence is based on most recent known address as of the end of the specified year. Data for the year 2018 are considered preliminary and are based on death data reported to CDC through December 2019. Due to incomplete reporting of deaths for the year 2018, prevalence data for Alabama, Oklahoma, South Carolina, and the U.S. Virgin Islands should be interpreted with caution.
Deaths
Persons reported to the National HIV Surveillance System are assumed alive unless their deaths have been reported to CDC. Death data include deaths of persons with diagnosed HIV infection, regardless of the cause of death (Tables 14a/b–17a/b). Data for the year 2018 are preliminary and are based on death data reported to CDC through December 2019. For tables presenting death data, region of residence is based on residence at death. If information on residence at death was not available, the state where a person’s death occurred was used. Trends through 2018 should be interpreted with caution. Due to incomplete reporting of deaths for the year 2018, death data for Alabama, Oklahoma, South Carolina, and the U.S. Virgin Islands should be interpreted with caution.
Rates
Rates per 100,000 population were calculated for (1) the numbers of diagnoses of HIV infection, (2) the numbers of persons living with diagnosed HIV infection (prevalence), and (3) the numbers of deaths of persons with diagnosed HIV infection.
The population denominators used to compute the rates for areas in the United States and Puerto Rico were based on the Vintage 2018 postcensal estimates file from the U.S. Census Bureau (for years 2014–2018) [2]. The population denominators for American Samoa, Guam, the Northern Mariana Islands, the Republic of Palau, and the U.S. Virgin Islands were based on estimates and projections from the U.S. Census Bureau’s International Database [3]. Each rate was calculated by dividing the total number of diagnoses (or deaths or prevalence) for the calendar year by the population for that calendar year and then multiplying the result by 100,000. The denominators used for calculating the rates specific to age, sex, and race/ethnicity were computed by applying the appropriate vintage estimates for age, sex, and race/ethnicity for the 50 states and the District of Columbia [2]. The same method was used to calculate the denominators for Puerto Rico, with the exception of race/ethnicity estimates; these data are not available for Puerto Rico. For the other 5 U.S. dependent areas, estimates from the U.S. Census Bureau’s International Data Base were used for age- and sex-specific population denominators [3].
CDC currently does not provide subpopulation rates by race/ethnicity for the 6 dependent areas because the U.S. Census Bureau does not collect information from all U.S. dependent areas. Rates for gender and transmission categories are not provided because of the absence of denominator data from the U.S. Census Bureau, the source of data used for calculating all rates in the tables.
Age
The designation “older adults” refers to persons aged 50 years and older. For tables presenting diagnosis data, the age-group assignment (e.g., 50–64 years) or age designation (i.e., older adults) is based on the person’s age at the time of diagnosis (HIV infection or infection classified as stage 3 [AIDS] at time of HIV diagnosis). For presentations of data on older adults living with diagnosed HIV infection (Tables 7a/b–13), specific age-group assignment or age designation is based on the person’s age as of December 31 of the specified year. For tables presenting death data of persons with diagnosed HIV infection (Tables 14a/b–17a/b), specific age-group assignment or age designation is based on the person’s age at the time of death.
Geographic Designations: U.S. Regions
Geographic designations reflect the region or area of residence at the time of diagnosis of HIV infection for tables presenting diagnosis data (Tables 1a/b–6, 18a/b–20a/b). Prevalence data reflect the region or area of residence based on the most recent known address as of the end of the specified year (Tables 7a/b–13). Death data reflect the region or area of residence based on residence at death (Tables 14a/b–17a/b).
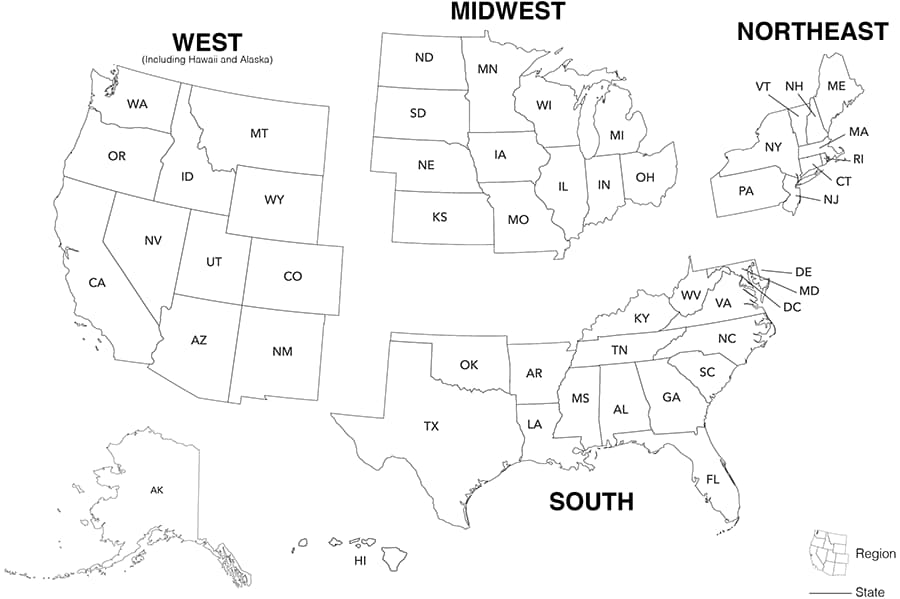
The 4 regions of residence and 6 dependent areas used in this report are defined by the U.S. Census Bureau as follows:
Northeast: Connecticut, Maine, Massachusetts, New Hampshire, New Jersey, New York, Pennsylvania, Rhode Island, and Vermont
Midwest: Illinois, Indiana, Iowa, Kansas, Michigan, Minnesota, Missouri, Nebraska, North Dakota, Ohio, South Dakota, and Wisconsin
South: Alabama, Arkansas, Delaware, District of Columbia, Florida, Georgia, Kentucky, Louisiana, Maryland, Mississippi, North Carolina, Oklahoma, South Carolina, Tennessee, Texas, Virginia, and West Virginia
West: Alaska, Arizona, California, Colorado, Hawaii, Idaho, Montana, Nevada, New Mexico, Oregon, Utah, Washington, and Wyoming
U.S. dependent areas: American Samoa, Guam, the Northern Mariana Islands, Puerto Rico, the Republic of Palau, and the U.S. Virgin Islands
Metropolitan Statistical Areas
In the Federal Register for June 28, 2010, the Office of Management and Budget (OMB) published revised standards for defining metropolitan statistical areas (MSAs) in federal statistical activities [4]. These standards, which provided for the identification of MSAs in the United States and Puerto Rico, replaced the 2000 standards. The adoption of the new standards was effective as of June 28, 2010. On February 28, 2013, OMB announced new MSA delineations based on the new standards and Census 2010 data [5]. Table 13 (Adults aged 50 years and older living with diagnosed HIV infection, by population of area of residence, age group, and selected characteristics, year-end 2018—United States) presents the number and rate of prevalence by MSA. The MSAs listed in these tables were defined according to OMB’s most recent update (February 2013) of statistical areas [5].
References
- HIV Surveillance Report, 2018 (Updated); vol. 31. http://www.cdc.gov/hiv/library/reports/hiv-surveillance.html. Published May 2020. Accessed June 15, 2020.
- S. Census Bureau. Population and Housing Unit Estimates Datasets. https://go.usa.gov/xn4ccexternal icon. Accessed June 15, 2020.
- S. Census Bureau. International Data Base. http://www.census.gov/data-tools/demo/idb/external iconinformation-Gateway.php. Updated December 2019. Accessed June 15, 2020.
- Office of Management and Budget. 2010 Standards for delineating metropolitan and micropolitan statistical areas. Federal Register 2010;75(123):37246–39052. http://www.gpo.gov/fdsys/pkg/FR-2010-06-28/html/2010-15605.htmexternal icon. Accessed June 15, 2020.
- Office of Management and Budget. Revised delineations of metropolitan statistical areas, micropolitan statistical areas, and combined statistical areas, and guidance on uses of the delineations of these areas. OMB Bulletin 13-01. https://www.whitehouse.gov/wp-content/uploads/legacy_drupal_files/omb/bulletins/2013/b13-01.pdfpdf iconexternal icon. Published February 28, 2013. Accessed June 15, 2020.
Suggested Citation
Centers for Disease Control and Prevention. Diagnoses of HIV infection among adults aged 50 years and older—United States and 6 dependent areas, 2014–2018. HIV Surveillance Data Tables 2020;1(No. 5) http://www.cdc.gov/hiv/library/reports/surveillance-data-tables/vol-1-no-5/index.html. Published August 2020. Accessed [date].
Acknowledgments
Publication of HIV Surveillance Data Tables was made possible by the contributions of the state and territorial health departments and the HIV surveillance programs that provided surveillance data to CDC.
HIV Surveillance Data Tables was prepared by the following staff and contractors of the Division of HIV/AIDS Prevention, National Center for HIV/AIDS, Viral Hepatitis, STD, and TB Prevention, CDC: Shacara Johnson Lyons, Laurie Linley, Jianmin Li, Chenchen Yu, André Dailey, Anna Satcher Johnson, and Michael Friend and the Web and Consumer Services Team of the Prevention Communications Branch (editing and desktop publishing).
| 2014 | 2015 | 2016 | 2017 | 2018 | ||||||
|---|---|---|---|---|---|---|---|---|---|---|
| No. | Ratea | No. | Ratea | No. | Ratea | No. | Ratea | No. | Ratea | |
| Gender | ||||||||||
| Male | 4,843 | – | 4,899 | – | 4,806 | – | 4,633 | – | 4,444 | – |
| Female | 1,749 | – | 1,805 | – | 1,877 | – | 1,831 | – | 1,784 | – |
| Transgender male-to-femaleb | 15 | – | 25 | – | 20 | – | 18 | – | 13 | – |
| Transgender female-to-maleb | 1 | – | 1 | – | 0 | – | 1 | – | 1 | – |
| Additional gender identityc | 0 | – | 0 | – | 1 | – | 0 | – | 0 | – |
| Age at diagnosis (yr) | ||||||||||
| 50–54 | 2,885 | 12.8 | 2,998 | 13.5 | 2,875 | 13.2 | 2,652 | 12.4 | 2,476 | 11.9 |
| 55–59 | 1,923 | 9.0 | 1,883 | 8.7 | 1,894 | 8.6 | 1,877 | 8.5 | 1,849 | 8.4 |
| 60–64 | 969 | 5.2 | 999 | 5.3 | 1,081 | 5.6 | 1,083 | 5.4 | 1,039 | 5.1 |
| 65–69 | 523 | 3.4 | 537 | 3.3 | 562 | 3.3 | 517 | 3.1 | 489 | 2.9 |
| 70–74 | 186 | 1.7 | 197 | 1.7 | 188 | 1.6 | 225 | 1.8 | 249 | 1.9 |
| 75–79 | 86 | 1.1 | 82 | 1.0 | 68 | 0.8 | 88 | 1.0 | 93 | 1.0 |
| 80–84 | 28 | 0.5 | 28 | 0.5 | 26 | 0.4 | 33 | 0.6 | 33 | 0.5 |
| ≥85 | 8 | 0.1 | 6 | 0.1 | 10 | 0.2 | 8 | 0.1 | 14 | 0.2 |
| Race/Ethnicity | ||||||||||
| American Indian/Alaska Native | 26 | 3.9 | 24 | 3.5 | 30 | 4.3 | 33 | 4.6 | 30 | 4.1 |
| Asian | 104 | 2.2 | 106 | 2.1 | 125 | 2.4 | 119 | 2.2 | 115 | 2.0 |
| Black/African American | 2,801 | 25.0 | 2,776 | 24.1 | 2,760 | 23.4 | 2,708 | 22.5 | 2,567 | 20.9 |
| Hispanic/Latinod | 1,099 | 10.5 | 1,193 | 10.9 | 1,193 | 10.4 | 1,173 | 9.8 | 1,271 | 10.1 |
| Native Hawaiian/other Pacific Islander | 7 | 5.5 | 11 | 8.2 | 8 | 5.7 | 4 | 2.7 | 9 | 5.9 |
| White | 2,370 | 2.9 | 2,415 | 3.0 | 2,404 | 2.9 | 2,294 | 2.8 | 2,127 | 2.6 |
| Multiple races | 201 | 21.4 | 205 | 21.1 | 184 | 18.3 | 152 | 14.6 | 123 | 11.5 |
| Transmission Categorye | ||||||||||
| Male adultf | ||||||||||
| Male-to-male sexual contact | 3,171 | – | 3,224 | – | 3,195 | – | 3,113 | – | 2,978 | – |
| Injection drug use | 430 | – | 411 | – | 396 | – | 375 | – | 378 | – |
| Male-to-male sexual contact and injection drug use | 172 | – | 176 | – | 172 | – | 168 | – | 149 | – |
| Heterosexual contactg | 1,074 | – | 1,101 | – | 1,052 | – | 983 | – | 939 | – |
| Otherh | 11 | – | 12 | – | 12 | – | 12 | – | 13 | – |
| Subtotal | 4,858 | 9.6 | 4,924 | 9.5 | 4,826 | 9.2 | 4,651 | 8.7 | 4,457 | 8.3 |
| Female adultf | ||||||||||
| Injection drug use | 257 | – | 249 | – | 276 | – | 244 | – | 246 | – |
| Heterosexual contactg | 1,489 | – | 1,553 | – | 1,597 | – | 1,585 | – | 1,534 | – |
| Otherh | 4 | – | 4 | – | 4 | – | 4 | – | 5 | – |
| Subtotal | 1,750 | 3.0 | 1,806 | 3.1 | 1,878 | 3.1 | 1,832 | 3.0 | 1,785 | 2.9 |
| Region of residencei | ||||||||||
| Northeast | 1,389 | 6.8 | 1,344 | 6.5 | 1,242 | 6.0 | 1,170 | 5.6 | 1,153 | 5.4 |
| Midwest | 714 | 3.0 | 775 | 3.2 | 813 | 3.3 | 774 | 3.1 | 735 | 3.0 |
| South | 3,304 | 8.2 | 3,371 | 8.2 | 3,345 | 7.9 | 3,295 | 7.7 | 3,195 | 7.3 |
| West | 1,201 | 5.0 | 1,240 | 5.0 | 1,304 | 5.2 | 1,244 | 4.9 | 1,159 | 4.4 |
| Total | 6,608 | 6.1 | 6,730 | 6.1 | 6,704 | 6.0 | 6,483 | 5.7 | 6,242 | 5.4 |
Note. Numbers less than 12, and rates and trends based on these numbers, should be interpreted with caution.
aRates are per 100,000 population. Rates are not calculated by gender or transmission category because of the lack of denominator data.
b“Transgender male-to-female” includes individuals who were assigned “male” sex at birth but have ever identified as “female” gender. “Transgender female-to-male” includes individuals who were assigned “female” sex at birth but have ever identified as “male” gender.
cAdditional gender identity examples include “bigender,” “gender queer,” and “two-spirit.”
dHispanics/Latinos can be of any race.
eData have been statistically adjusted to account for missing transmission category; therefore, values may not sum to the column subtotals and total.
fData presented based on sex at birth and include transgender persons.
gHeterosexual contact with a person known to have, or to be at high risk for, HIV infection.
hIncludes hemophilia, blood transfusion, and risk factor not reported or not identified.
iData are based on residence at time of diagnosis of HIV infection.
| 2014 | 2015 | 2016 | 2017 | 2018 | ||||||
|---|---|---|---|---|---|---|---|---|---|---|
| No. | Ratea | No. | Ratea | No. | Ratea | No. | Ratea | No. | Ratea | |
| Gender | ||||||||||
| Male | 4,949 | – | 4,997 | – | 4,918 | – | 4,727 | – | 4,535 | – |
| Female | 1,788 | – | 1,843 | – | 1,909 | – | 1,863 | – | 1,814 | – |
| Transgender male-to-femaleb | 15 | – | 25 | – | 20 | – | 18 | – | 13 | – |
| Transgender female-to-maleb | 1 | – | 1 | – | 0 | – | 1 | – | 1 | – |
| Additional gender identityc | 0 | – | 0 | – | 1 | – | 0 | – | 0 | – |
| Age at diagnosis (yr) | ||||||||||
| 50–54 | 2,931 | 12.9 | 3,056 | 13.6 | 2,920 | 13.2 | 2,703 | 12.5 | 2,528 | 12.0 |
| 55–59 | 1,968 | 9.1 | 1,915 | 8.7 | 1,944 | 8.8 | 1,911 | 8.6 | 1,877 | 8.5 |
| 60–64 | 996 | 5.3 | 1,014 | 5.3 | 1,106 | 5.6 | 1,103 | 5.5 | 1,058 | 5.1 |
| 65–69 | 537 | 3.5 | 559 | 3.4 | 579 | 3.4 | 525 | 3.1 | 502 | 2.9 |
| 70–74 | 195 | 1.7 | 204 | 1.8 | 191 | 1.6 | 231 | 1.8 | 255 | 1.9 |
| 75–79 | 88 | 1.1 | 84 | 1.0 | 70 | 0.8 | 92 | 1.0 | 95 | 1.0 |
| 80–84 | 28 | 0.5 | 28 | 0.5 | 27 | 0.5 | 35 | 0.6 | 33 | 0.5 |
| ≥85 | 10 | 0.2 | 6 | 0.1 | 11 | 0.2 | 9 | 0.1 | 15 | 0.2 |
| Race/Ethnicity | ||||||||||
| American Indian/Alaska Native | 26 | – | 24 | – | 30 | – | 33 | – | 30 | – |
| Asian | 105 | – | 106 | – | 125 | – | 119 | – | 115 | – |
| Black/African American | 2,811 | – | 2,778 | – | 2,762 | – | 2,708 | – | 2,569 | – |
| Hispanic/Latinod | 1,231 | – | 1,324 | – | 1,334 | – | 1,296 | – | 1,387 | – |
| Native Hawaiian/other Pacific Islander | 7 | – | 12 | – | 9 | – | 6 | – | 10 | – |
| White | 2,372 | – | 2,417 | – | 2,404 | – | 2,295 | – | 2,129 | – |
| Multiple races | 201 | – | 205 | – | 184 | – | 152 | – | 123 | – |
| Transmission Categorye | ||||||||||
| Male adultf | ||||||||||
| Male-to-male sexual contact | 3,199 | – | 3,264 | – | 3,241 | – | 3,151 | – | 3,019 | – |
| Injection drug use | 455 | – | 432 | – | 414 | – | 397 | – | 389 | – |
| Male-to-male sexual contact and injection drug use | 174 | – | 181 | – | 172 | – | 168 | – | 152 | – |
| Heterosexual contactg | 1,125 | – | 1,133 | – | 1,100 | – | 1,016 | – | 975 | – |
| Otherh | 11 | – | 12 | – | 12 | – | 12 | – | 13 | – |
| Subtotal | 4,964 | 9.7 | 5,022 | 9.6 | 4,938 | 9.3 | 4,745 | 8.8 | 4,548 | 8.3 |
| Female adultf | ||||||||||
| Injection drug use | 260 | – | 250 | – | 279 | – | 247 | – | 246 | – |
| Heterosexual contactg | 1,525 | – | 1,590 | – | 1,627 | – | 1,613 | – | 1,564 | – |
| Otherh | 4 | – | 4 | – | 4 | – | 4 | – | 5 | – |
| Subtotal | 1,789 | 3.0 | 1,844 | 3.1 | 1,910 | 3.1 | 1,864 | 3.0 | 1,815 | 2.9 |
| Region of residencei | ||||||||||
| Northeast | 1,389 | 6.8 | 1,344 | 6.5 | 1,242 | 6.0 | 1,170 | 5.6 | 1,153 | 5.4 |
| Midwest | 714 | 3.0 | 775 | 3.2 | 813 | 3.3 | 774 | 3.1 | 735 | 3.0 |
| South | 3,304 | 8.2 | 3,371 | 8.2 | 3,345 | 7.9 | 3,295 | 7.7 | 3,195 | 7.3 |
| West | 1,201 | 5.0 | 1,240 | 5.0 | 1,304 | 5.2 | 1,244 | 4.9 | 1,159 | 4.4 |
| U.S. dependent areas | 145 | 10.4 | 136 | 9.7 | 144 | 10.2 | 126 | 8.9 | 121 | 8.5 |
| Total | 6,753 | 6.1 | 6,866 | 6.1 | 6,848 | 6.0 | 6,609 | 5.7 | 6,363 | 5.4 |
Note. Numbers less than 12, and rates and trends based on these numbers, should be interpreted with caution.
aRates are per 100,000 population. Rates by race/ethnicity are not provided because U.S. census information for U.S. dependent areas is limited. Rates are not calculated by gender or transmission category because of the lack of denominator data.
b“Transgender male-to-female” includes individuals who were assigned “male” sex at birth but have ever identified as “female” gender. “Transgender female-to-male” includes individuals who were assigned “female” sex at birth but have ever identified as “male” gender.
cAdditional gender identity examples include “bigender,” “gender queer,” and “two-spirit.”
dHispanics/Latinos can be of any race.
eData have been statistically adjusted to account for missing transmission category; therefore, values may not sum to the column subtotals and total.
fData presented based on sex at birth and include transgender persons.
gHeterosexual contact with a person known to have, or to be at high risk for, HIV infection.
hIncludes hemophilia, blood transfusion, and risk factor not reported or not identified.
iData are based on residence at time of diagnosis of HIV infection.
| 2014 | 2015 | 2016 | 2017 | 2018 | ||||||
|---|---|---|---|---|---|---|---|---|---|---|
| No. | Ratea | No. | Ratea | No. | Ratea | No. | Ratea | No. | Ratea | |
| Male adult | ||||||||||
| Age at diagnosis (yr) | ||||||||||
| 50–54 | 2,193 | 19.8 | 2,252 | 20.6 | 2,144 | 20.0 | 1,990 | 19.0 | 1,813 | 17.6 |
| 55–59 | 1,335 | 12.8 | 1,347 | 12.8 | 1,323 | 12.4 | 1,312 | 12.3 | 1,299 | 12.2 |
| 60–64 | 700 | 7.9 | 700 | 7.7 | 736 | 7.9 | 749 | 7.9 | 717 | 7.4 |
| 65–69 | 388 | 5.4 | 385 | 5.1 | 408 | 5.1 | 365 | 4.6 | 352 | 4.4 |
| 70–74 | 143 | 2.8 | 154 | 2.9 | 142 | 2.6 | 152 | 2.6 | 177 | 2.8 |
| 75–79 | 71 | 2.0 | 64 | 1.8 | 52 | 1.4 | 53 | 1.4 | 65 | 1.6 |
| 80–84 | 25 | 1.1 | 16 | 0.7 | 17 | 0.7 | 25 | 1.0 | 24 | 0.9 |
| ≥85 | 3 | 0.1 | 6 | 0.3 | 4 | 0.2 | 5 | 0.2 | 10 | 0.4 |
| Race/Ethnicity | ||||||||||
| American Indian/Alaska Native | 17 | 5.5 | 14 | 4.4 | 20 | 6.1 | 21 | 6.3 | 23 | 6.8 |
| Asian | 79 | 3.7 | 81 | 3.6 | 98 | 4.2 | 84 | 3.5 | 85 | 3.4 |
| Black/African American | 1,695 | 34.4 | 1,671 | 33.0 | 1,618 | 31.2 | 1,576 | 29.8 | 1,498 | 27.8 |
| Hispanic/Latinob | 829 | 16.9 | 924 | 17.9 | 903 | 16.6 | 912 | 16.1 | 959 | 16.1 |
| Native Hawaiian/other Pacific Islander | 4 | 6.5 | 9 | 13.9 | 4 | 5.9 | 3 | 4.3 | 7 | 9.5 |
| White | 2,084 | 5.5 | 2,078 | 5.4 | 2,050 | 5.3 | 1,940 | 5.0 | 1,802 | 4.6 |
| Multiple races | 150 | 34.4 | 147 | 32.5 | 133 | 28.5 | 115 | 23.9 | 83 | 16.7 |
| Region of residencec | ||||||||||
| Northeast | 993 | 10.6 | 926 | 9.8 | 832 | 8.7 | 765 | 7.9 | 774 | 7.9 |
| Midwest | 553 | 5.0 | 594 | 5.3 | 625 | 5.5 | 585 | 5.1 | 574 | 4.9 |
| South | 2,344 | 12.5 | 2,381 | 12.4 | 2,311 | 11.8 | 2,286 | 11.5 | 2,204 | 10.9 |
| West | 968 | 8.5 | 1,023 | 8.8 | 1,058 | 8.9 | 1,015 | 8.4 | 905 | 7.3 |
| Subtotal, male adult | 4,858 | 9.6 | 4,924 | 9.5 | 4,826 | 9.2 | 4,651 | 8.7 | 4,457 | 8.3 |
| Female adult | ||||||||||
| Age at diagnosis (yr) | ||||||||||
| 50–54 | 692 | 6.0 | 746 | 6.6 | 731 | 6.6 | 662 | 6.1 | 663 | 6.3 |
| 55–59 | 588 | 5.3 | 536 | 4.8 | 571 | 5.1 | 565 | 5.0 | 550 | 4.9 |
| 60–64 | 269 | 2.8 | 299 | 3.0 | 345 | 3.4 | 334 | 3.2 | 322 | 3.0 |
| 65–69 | 135 | 1.7 | 152 | 1.8 | 154 | 1.7 | 152 | 1.7 | 137 | 1.5 |
| 70–74 | 43 | 0.7 | 43 | 0.7 | 46 | 0.7 | 73 | 1.1 | 72 | 1.0 |
| 75–79 | 15 | 0.3 | 18 | 0.4 | 16 | 0.3 | 35 | 0.7 | 28 | 0.5 |
| 80–84 | 3 | 0.1 | 12 | 0.4 | 9 | 0.3 | 8 | 0.2 | 9 | 0.3 |
| ≥85 | 5 | 0.1 | 0 | 0.0 | 6 | 0.1 | 3 | 0.1 | 4 | 0.1 |
| Race/Ethnicity | ||||||||||
| American Indian/Alaska Native | 9 | 2.5 | 10 | 2.7 | 10 | 2.7 | 12 | 3.1 | 7 | 1.8 |
| Asian | 25 | 0.9 | 25 | 0.9 | 27 | 0.9 | 35 | 1.2 | 30 | 1.0 |
| Black/African American | 1,106 | 17.6 | 1,105 | 17.1 | 1,142 | 17.3 | 1,132 | 16.8 | 1,069 | 15.5 |
| Hispanic/Latinob | 270 | 4.9 | 269 | 4.6 | 290 | 4.8 | 261 | 4.1 | 312 | 4.7 |
| Native Hawaiian/other Pacific Islander | 3 | 4.5 | 2 | 2.9 | 4 | 5.5 | 1 | 1.3 | 2 | 2.5 |
| White | 286 | 0.7 | 337 | 0.8 | 354 | 0.8 | 354 | 0.8 | 325 | 0.7 |
| Multiple races | 51 | 10.1 | 58 | 11.1 | 51 | 9.5 | 37 | 6.6 | 40 | 7.0 |
| Region of residencec | ||||||||||
| Northeast | 396 | 3.6 | 418 | 3.8 | 410 | 3.7 | 405 | 3.6 | 379 | 3.3 |
| Midwest | 161 | 1.3 | 181 | 1.4 | 188 | 1.5 | 189 | 1.4 | 161 | 1.2 |
| South | 960 | 4.4 | 990 | 4.5 | 1,034 | 4.6 | 1,009 | 4.4 | 991 | 4.2 |
| West | 233 | 1.8 | 217 | 1.7 | 246 | 1.9 | 229 | 1.7 | 254 | 1.9 |
| Subtotal, female adult | 1,750 | 3.0 | 1,806 | 3.1 | 1,878 | 3.1 | 1,832 | 3.0 | 1,785 | 2.9 |
| Total | 6,608 | 6.1 | 6,730 | 6.1 | 6,704 | 6.0 | 6,483 | 5.7 | 6,242 | 5.4 |
Note. Numbers less than 12, and rates and trends based on these numbers, should be interpreted with caution.
aRates are per 100,000 population.
bHispanics/Latinos can be of any race.
cData are based on residence at time of diagnosis of HIV infection.
| 2014 | 2015 | 2016 | 2017 | 2018 | ||||||
|---|---|---|---|---|---|---|---|---|---|---|
| No. | Ratea | No. | Ratea | No. | Ratea | No. | Ratea | No. | Ratea | |
| Male adult | ||||||||||
| Age at diagnosis (yr) | ||||||||||
| 50–54 | 2,226 | 19.9 | 2,295 | 20.8 | 2,181 | 20.1 | 2,029 | 19.1 | 1,853 | 17.8 |
| 55–59 | 1,366 | 13.0 | 1,368 | 12.8 | 1,359 | 12.6 | 1,335 | 12.4 | 1,319 | 12.2 |
| 60–64 | 723 | 8.1 | 714 | 7.8 | 754 | 8.0 | 764 | 7.9 | 732 | 7.4 |
| 65–69 | 398 | 5.4 | 397 | 5.2 | 423 | 5.3 | 372 | 4.6 | 362 | 4.5 |
| 70–74 | 148 | 2.9 | 160 | 3.0 | 145 | 2.6 | 155 | 2.6 | 181 | 2.9 |
| 75–79 | 73 | 2.1 | 66 | 1.8 | 54 | 1.4 | 57 | 1.4 | 66 | 1.6 |
| 80–84 | 25 | 1.0 | 16 | 0.7 | 18 | 0.7 | 27 | 1.1 | 24 | 0.9 |
| ≥85 | 5 | 0.2 | 6 | 0.3 | 4 | 0.2 | 6 | 0.3 | 11 | 0.5 |
| Race/Ethnicity | ||||||||||
| American Indian/Alaska Native | 17 | – | 14 | – | 20 | – | 21 | – | 23 | – |
| Asian | 80 | – | 81 | – | 98 | – | 84 | – | 85 | – |
| Black/African American | 1,702 | – | 1,671 | – | 1,620 | – | 1,576 | – | 1,500 | – |
| Hispanic/Latinob | 926 | – | 1,019 | – | 1,012 | – | 1,004 | – | 1,045 | – |
| Native Hawaiian/other Pacific Islander | 4 | – | 10 | – | 5 | – | 5 | – | 8 | – |
| White | 2,085 | – | 2,080 | – | 2,050 | – | 1,940 | – | 1,804 | – |
| Multiple races | 150 | – | 147 | – | 133 | – | 115 | – | 83 | – |
| Region of residencec | ||||||||||
| Northeast | 993 | 10.6 | 926 | 9.8 | 832 | 8.7 | 765 | 7.9 | 774 | 7.9 |
| Midwest | 553 | 5.0 | 594 | 5.3 | 625 | 5.5 | 585 | 5.1 | 574 | 4.9 |
| South | 2,344 | 12.5 | 2,381 | 12.4 | 2,311 | 11.8 | 2,286 | 11.5 | 2,204 | 10.9 |
| West | 968 | 8.5 | 1,023 | 8.8 | 1,058 | 8.9 | 1,015 | 8.4 | 905 | 7.3 |
| U.S. dependent areas | 106 | 17.0 | 98 | 15.5 | 112 | 17.6 | 94 | 14.7 | 91 | 14.2 |
| Subtotal, male adult | 4,964 | 9.7 | 5,022 | 9.6 | 4,938 | 9.3 | 4,745 | 8.8 | 4,548 | 8.3 |
| Female adult | ||||||||||
| Age at diagnosis (yr) | ||||||||||
| 50–54 | 705 | 6.1 | 761 | 6.6 | 739 | 6.6 | 674 | 6.1 | 675 | 6.3 |
| 55–59 | 602 | 5.4 | 547 | 4.8 | 585 | 5.1 | 576 | 5.0 | 558 | 4.9 |
| 60–64 | 273 | 2.8 | 300 | 3.0 | 352 | 3.4 | 339 | 3.2 | 326 | 3.0 |
| 65–69 | 139 | 1.7 | 162 | 1.9 | 156 | 1.7 | 153 | 1.7 | 140 | 1.5 |
| 70–74 | 47 | 0.8 | 44 | 0.7 | 46 | 0.7 | 76 | 1.1 | 74 | 1.0 |
| 75–79 | 15 | 0.3 | 18 | 0.4 | 16 | 0.3 | 35 | 0.7 | 29 | 0.6 |
| 80–84 | 3 | 0.1 | 12 | 0.3 | 9 | 0.3 | 8 | 0.2 | 9 | 0.3 |
| ≥85 | 5 | 0.1 | 0 | 0.0 | 7 | 0.2 | 3 | 0.1 | 4 | 0.1 |
| Race/Ethnicity | ||||||||||
| American Indian/Alaska Native | 9 | – | 10 | – | 10 | – | 12 | – | 7 | – |
| Asian | 25 | – | 25 | – | 27 | – | 35 | – | 30 | – |
| Black/African American | 1,109 | – | 1,107 | – | 1,142 | – | 1,132 | – | 1,069 | – |
| Hispanic/Latinob | 305 | – | 305 | – | 322 | – | 292 | – | 342 | – |
| Native Hawaiian/other Pacific Islander | 3 | – | 2 | – | 4 | – | 1 | – | 2 | – |
| White | 287 | – | 337 | – | 354 | – | 355 | – | 325 | – |
| Multiple races | 51 | – | 58 | – | 51 | – | 37 | – | 40 | – |
| Region of residencec | ||||||||||
| Northeast | 396 | 3.6 | 418 | 3.8 | 410 | 3.7 | 405 | 3.6 | 379 | 3.3 |
| Midwest | 161 | 1.3 | 181 | 1.4 | 188 | 1.5 | 189 | 1.4 | 161 | 1.2 |
| South | 960 | 4.4 | 990 | 4.5 | 1,034 | 4.6 | 1,009 | 4.4 | 991 | 4.2 |
| West | 233 | 1.8 | 217 | 1.7 | 246 | 1.9 | 229 | 1.7 | 254 | 1.9 |
| U.S. dependent areas | 39 | 5.1 | 38 | 4.9 | 32 | 4.1 | 32 | 4.1 | 30 | 3.9 |
| Subtotal, female adult | 1,789 | 3.0 | 1,844 | 3.1 | 1,910 | 3.1 | 1,864 | 3.0 | 1,815 | 2.9 |
| Total | 6,753 | 6.1 | 6,866 | 6.1 | 6,848 | 6.0 | 6,609 | 5.7 | 6,363 | 5.4 |
Note. Numbers less than 12, and rates and trends based on these numbers, should be interpreted with caution.
aRates are per 100,000 population. Rates by race/ethnicity are not provided because U.S. census information for U.S. dependent areas is limited.
bHispanics/Latinos can be of any race.
cData are based on residence at time of diagnosis of HIV infection.
| 2014 | 2015 | 2016 | 2017 | 2018 | ||||||
|---|---|---|---|---|---|---|---|---|---|---|
| No. | Ratea | No. | Ratea | No. | Ratea | No. | Ratea | No. | Ratea | |
| Aged 50–64 years of age at diagnosis | ||||||||||
| Male adult | ||||||||||
| Race/Ethnicity | ||||||||||
| American Indian/Alaska Native | 16 | 7.8 | 14 | 6.7 | 17 | 8.1 | 18 | 8.6 | 20 | 9.5 |
| Asian | 64 | 4.8 | 71 | 5.2 | 79 | 5.6 | 73 | 5.0 | 68 | 4.6 |
| Black/African American | 1,451 | 43.7 | 1,449 | 43.0 | 1,394 | 40.9 | 1,362 | 39.7 | 1,271 | 36.8 |
| Hispanic/Latinob | 740 | 21.8 | 812 | 22.8 | 809 | 21.8 | 796 | 20.6 | 849 | 21.1 |
| Native Hawaiian/Other Pacific | 3 | 7.2 | 9 | 20.8 | 2 | 4.5 | 2 | 4.4 | 6 | 12.8 |
| White | 1,822 | 8.4 | 1,821 | 8.4 | 1,780 | 8.2 | 1,695 | 7.9 | 1,545 | 7.3 |
| Multiple races | 132 | 45.1 | 123 | 41.1 | 122 | 40.0 | 105 | 33.9 | 70 | 22.2 |
| Transmission Categoryc | ||||||||||
| Male-to-male sexual contact | 2,811 | – | 2,875 | – | 2,855 | – | 2,774 | – | 2,596 | – |
| Injection drug use | 369 | – | 354 | – | 333 | – | 316 | – | 328 | – |
| Male-to-male sexual contact and injection drug use | 164 | – | 165 | – | 154 | – | 153 | – | 137 | – |
| Heterosexual contactd | 879 | – | 900 | – | 856 | – | 802 | – | 760 | – |
| Othere | 5 | – | 6 | – | 5 | – | 6 | – | 8 | – |
| Region of residencef | ||||||||||
| Northeast | 836 | 14.9 | 792 | 14.0 | 706 | 12.5 | 654 | 11.6 | 662 | 11.8 |
| Midwest | 496 | 7.3 | 531 | 7.9 | 568 | 8.4 | 514 | 7.7 | 499 | 7.5 |
| South | 2,038 | 18.4 | 2,068 | 18.4 | 1,996 | 17.6 | 1,981 | 17.4 | 1,893 | 16.6 |
| West | 858 | 12.5 | 908 | 13.1 | 933 | 13.4 | 902 | 12.9 | 775 | 11.1 |
| Subtotal, male aged 50–64 years | 4,228 | 13.9 | 4,299 | 14.1 | 4,203 | 13.7 | 4,051 | 13.2 | 3,829 | 12.5 |
| Female adult | ||||||||||
| Race/Ethnicity | ||||||||||
| American Indian/Alaska Native | 9 | 4.0 | 9 | 3.9 | 9 | 3.9 | 11 | 4.7 | 7 | 3.0 |
| Asian | 24 | 1.5 | 20 | 1.2 | 22 | 1.3 | 30 | 1.7 | 23 | 1.3 |
| Black/African American | 963 | 24.8 | 955 | 24.2 | 1,003 | 25.2 | 943 | 23.5 | 921 | 22.8 |
| Hispanic/Latinob | 240 | 6.8 | 236 | 6.4 | 245 | 6.4 | 220 | 5.5 | 261 | 6.3 |
| Native Hawaiian/other Pacific Islander | 3 | 6.9 | 2 | 4.4 | 4 | 8.6 | 1 | 2.1 | 2 | 4.1 |
| White | 264 | 1.2 | 306 | 1.4 | 322 | 1.4 | 324 | 1.5 | 292 | 1.3 |
| Multiple races | 46 | 14.3 | 53 | 16.0 | 42 | 12.4 | 32 | 9.3 | 29 | 8.3 |
| Transmission Categoryc | ||||||||||
| Injection drug use | 224 | – | 222 | – | 246 | – | 215 | – | 218 | – |
| Heterosexual contactd | 1,322 | – | 1,357 | – | 1,398 | – | 1,344 | – | 1,315 | – |
| Othere | 2 | – | 2 | – | 3 | – | 3 | – | 3 | – |
| Region of residencef | ||||||||||
| Northeast | 332 | 5.5 | 363 | 6.0 | 352 | 5.8 | 344 | 5.7 | 323 | 5.4 |
| Midwest | 142 | 2.0 | 160 | 2.3 | 173 | 2.5 | 169 | 2.4 | 140 | 2.0 |
| South | 863 | 7.2 | 871 | 7.2 | 901 | 7.4 | 841 | 6.9 | 860 | 7.0 |
| West | 212 | 2.9 | 187 | 2.6 | 221 | 3.0 | 207 | 2.8 | 212 | 2.9 |
| Subtotal, female aged 50–64 years | 1,549 | 4.8 | 1,581 | 4.9 | 1,647 | 5.1 | 1,561 | 4.8 | 1,535 | 4.7 |
| Both sexes | ||||||||||
| Race/Ethnicity | ||||||||||
| American Indian/Alaska Native | 25 | 5.8 | 23 | 5.2 | 26 | 5.9 | 29 | 6.5 | 27 | 6.1 |
| Asian | 88 | 3.0 | 91 | 3.0 | 101 | 3.3 | 103 | 3.2 | 91 | 2.8 |
| Black/African American | 2,414 | 33.5 | 2,404 | 32.9 | 2,397 | 32.4 | 2,305 | 30.9 | 2,192 | 29.3 |
| Hispanic/Latinob | 980 | 14.1 | 1,048 | 14.5 | 1,054 | 13.9 | 1,016 | 12.9 | 1,110 | 13.6 |
| Native Hawaiian/other Pacific Islander | 6 | 7.0 | 11 | 12.4 | 6 | 6.6 | 3 | 3.2 | 8 | 8.3 |
| White | 2,086 | 4.7 | 2,127 | 4.8 | 2,102 | 4.8 | 2,019 | 4.6 | 1,837 | 4.3 |
| Multiple races | 178 | 29.0 | 176 | 27.9 | 164 | 25.5 | 137 | 20.9 | 99 | 14.9 |
| Region of residencef | ||||||||||
| Northeast | 1,168 | 10.0 | 1,155 | 9.9 | 1,058 | 9.0 | 998 | 8.6 | 985 | 8.5 |
| Midwest | 638 | 4.6 | 691 | 5.0 | 741 | 5.4 | 683 | 5.0 | 639 | 4.7 |
| South | 2,901 | 12.6 | 2,939 | 12.6 | 2,897 | 12.3 | 2,822 | 11.9 | 2,753 | 11.6 |
| West | 1,070 | 7.6 | 1,095 | 7.7 | 1,154 | 8.1 | 1,109 | 7.8 | 987 | 6.9 |
| Subtotal, aged 50–64 years | 5,777 | 9.2 | 5,880 | 9.3 | 5,850 | 9.3 | 5,612 | 8.9 | 5,364 | 8.5 |
| Aged ≥65 years of age at diagnosis | ||||||||||
| Male adult | ||||||||||
| Race/Ethnicity | ||||||||||
| American Indian/Alaska Native | 1 | 1.0 | 0 | 0.0 | 3 | 2.6 | 3 | 2.4 | 3 | 2.3 |
| Asian | 15 | 1.9 | 10 | 1.2 | 19 | 2.1 | 11 | 1.1 | 17 | 1.7 |
| Black/African American | 244 | 15.2 | 222 | 13.2 | 224 | 12.7 | 214 | 11.6 | 227 | 11.8 |
| Hispanic/Latinob | 89 | 5.9 | 112 | 6.9 | 94 | 5.5 | 116 | 6.4 | 110 | 5.7 |
| Native Hawaiian/other Pacific Islander | 1 | 5.1 | 0 | 0.0 | 2 | 8.7 | 1 | 4.0 | 1 | 3.8 |
| White | 262 | 1.6 | 257 | 1.5 | 270 | 1.6 | 245 | 1.4 | 257 | 1.4 |
| Multiple races | 18 | 12.6 | 24 | 15.7 | 11 | 6.8 | 10 | 5.8 | 13 | 7.2 |
| Transmission Categoryc | ||||||||||
| Male-to-male sexual contact | 360 | – | 350 | – | 340 | – | 339 | – | 382 | – |
| Injection drug use | 61 | – | 57 | – | 63 | – | 59 | – | 50 | – |
| Male-to-male sexual contact and injection drug use | 9 | – | 12 | – | 18 | – | 15 | – | 12 | – |
| Heterosexual contactd | 195 | – | 201 | – | 196 | – | 181 | – | 179 | – |
| Othere | 6 | – | 6 | – | 7 | – | 6 | – | 5 | – |
| Region of residencef | ||||||||||
| Northeast | 157 | 4.2 | 134 | 3.5 | 126 | 3.2 | 111 | 2.7 | 112 | 2.7 |
| Midwest | 57 | 1.3 | 63 | 1.4 | 57 | 1.2 | 71 | 1.5 | 75 | 1.5 |
| South | 306 | 4.0 | 313 | 3.9 | 315 | 3.8 | 305 | 3.6 | 311 | 3.5 |
| West | 110 | 2.4 | 115 | 2.4 | 125 | 2.5 | 113 | 2.2 | 130 | 2.4 |
| Subtotal, male aged ≥65 years | 630 | 3.1 | 625 | 3.0 | 623 | 2.9 | 600 | 2.7 | 628 | 2.7 |
| Female adult | ||||||||||
| Race/Ethnicity | ||||||||||
| American Indian/Alaska Native | 0 | 0.0 | 1 | 0.7 | 1 | 0.7 | 1 | 0.7 | 0 | 0.0 |
| Asian | 1 | 0.1 | 5 | 0.4 | 5 | 0.4 | 5 | 0.4 | 7 | 0.5 |
| Black/African American | 143 | 5.9 | 150 | 6.0 | 139 | 5.3 | 189 | 6.9 | 148 | 5.2 |
| Hispanic/Latinob | 30 | 1.5 | 33 | 1.6 | 45 | 2.0 | 41 | 1.7 | 51 | 2.0 |
| Native Hawaiian/other Pacific Islander | 0 | 0.0 | 0 | 0.0 | 0 | 0.0 | 0 | 0.0 | 0 | 0.0 |
| White | 22 | 0.1 | 31 | 0.2 | 32 | 0.2 | 30 | 0.1 | 33 | 0.1 |
| Multiple races | 5 | 2.8 | 5 | 2.6 | 9 | 4.5 | 5 | 2.4 | 11 | 4.9 |
| Transmission Categoryc | ||||||||||
| Injection drug use | 33 | – | 27 | – | 30 | – | 29 | – | 29 | – |
| Heterosexual contactd | 167 | – | 196 | – | 200 | – | 241 | – | 219 | – |
| Othere | 2 | – | 2 | – | 1 | – | 1 | – | 2 | – |
| Region of residencef | ||||||||||
| Northeast | 64 | 1.3 | 55 | 1.1 | 58 | 1.1 | 61 | 1.2 | 56 | 1.0 |
| Midwest | 19 | 0.3 | 21 | 0.4 | 15 | 0.3 | 20 | 0.3 | 21 | 0.3 |
| South | 97 | 1.0 | 119 | 1.2 | 133 | 1.3 | 168 | 1.6 | 131 | 1.2 |
| West | 21 | 0.4 | 30 | 0.5 | 25 | 0.4 | 22 | 0.4 | 42 | 0.7 |
| Subtotal, female aged ≥65 years | 201 | 0.8 | 225 | 0.8 | 231 | 0.8 | 271 | 1.0 | 250 | 0.9 |
| Both sexes | ||||||||||
| Race/Ethnicity | ||||||||||
| American Indian/Alaska Native | 1 | 0.4 | 1 | 0.4 | 4 | 1.5 | 4 | 1.5 | 3 | 1.0 |
| Asian | 16 | 0.9 | 15 | 0.8 | 24 | 1.1 | 16 | 0.7 | 24 | 1.0 |
| Black/African American | 387 | 9.6 | 372 | 8.9 | 363 | 8.3 | 403 | 8.8 | 375 | 7.9 |
| Hispanic/Latinob | 119 | 3.4 | 145 | 3.9 | 139 | 3.5 | 157 | 3.8 | 161 | 3.6 |
| Native Hawaiian/other Pacific Islander | 1 | 2.4 | 0 | 0.0 | 2 | 4.1 | 1 | 1.9 | 1 | 1.8 |
| White | 284 | 0.8 | 288 | 0.8 | 302 | 0.8 | 275 | 0.7 | 290 | 0.7 |
| Multiple races | 23 | 7.1 | 29 | 8.4 | 20 | 5.5 | 15 | 3.9 | 24 | 5.9 |
| Region of residencef | ||||||||||
| Northeast | 221 | 2.5 | 189 | 2.1 | 184 | 2.0 | 172 | 1.8 | 168 | 1.8 |
| Midwest | 76 | 0.8 | 84 | 0.8 | 72 | 0.7 | 91 | 0.8 | 96 | 0.9 |
| South | 403 | 2.3 | 432 | 2.4 | 448 | 2.4 | 473 | 2.5 | 442 | 2.2 |
| West | 131 | 1.3 | 145 | 1.4 | 150 | 1.4 | 135 | 1.2 | 172 | 1.5 |
| Subtotal, aged ≥65 years | 831 | 1.8 | 850 | 1.8 | 854 | 1.7 | 871 | 1.7 | 878 | 1.7 |
| Total | 6,608 | 6.1 | 6,730 | 6.1 | 6,704 | 6.0 | 6,483 | 5.7 | 6,242 | 5.4 |
Note. Numbers less than 12, and rates and trends based on these numbers, should be interpreted with caution.
aRates are per 100,000 population. Rates are not calculated by transmission category because of the lack of denominator data.
bHispanics/Latinos can be of any race.
cData have been statistically adjusted to account for missing transmission category; therefore, values may not sum to the column subtotals and total.
dHeterosexual contact with a person known to have, or to be at high risk for, HIV infection.
eIncludes hemophilia, blood transfusion, and risk factor not reported or not identified.
fData are based on residence at time of diagnosis of HIV infection.
| 2014 | 2015 | 2016 | 2017 | 2018 | ||||||
|---|---|---|---|---|---|---|---|---|---|---|
| No. | Ratea | No. | Ratea | No. | Ratea | No. | Ratea | No. | Ratea | |
| Aged 50–64 years of age at diagnosis | ||||||||||
| Male adult | ||||||||||
| Race/Ethnicity | ||||||||||
| American Indian/Alaska Native | 16 | – | 14 | – | 17 | – | 18 | – | 20 | – |
| Asian | 65 | – | 71 | – | 79 | – | 73 | – | 68 | – |
| Black/African American | 1,457 | – | 1,449 | – | 1,396 | – | 1,362 | – | 1,273 | – |
| Hispanic/Latinob | 819 | – | 887 | – | 897 | – | 871 | – | 919 | – |
| Native Hawaiian/other Pacific Islander | 3 | – | 10 | – | 3 | – | 4 | – | 7 | – |
| White | 1,823 | – | 1,823 | – | 1,780 | – | 1,695 | – | 1,547 | – |
| Multiple races | 132 | – | 123 | – | 122 | – | 105 | – | 70 | – |
| Transmission Categoryc | ||||||||||
| Male-to-male sexual contact | 2,835 | – | 2,909 | – | 2,899 | – | 2,809 | – | 2,634 | – |
| Injection drug use | 392 | – | 373 | – | 348 | – | 334 | – | 336 | – |
| Male-to-male sexual contact and injection drug use | 164 | – | 167 | – | 155 | – | 153 | – | 139 | – |
| Heterosexual contactd | 920 | – | 923 | – | 888 | – | 826 | – | 787 | – |
| Othere | 5 | – | 6 | – | 5 | – | 6 | – | 8 | – |
| Region of residencef | ||||||||||
| Northeast | 836 | 14.9 | 792 | 14.0 | 706 | 12.5 | 654 | 11.6 | 662 | 11.8 |
| Midwest | 496 | 7.3 | 531 | 7.9 | 568 | 8.4 | 514 | 7.7 | 499 | 7.5 |
| South | 2,038 | 18.4 | 2,068 | 18.4 | 1,996 | 17.6 | 1,981 | 17.4 | 1,893 | 16.6 |
| West | 858 | 12.5 | 908 | 13.1 | 933 | 13.4 | 902 | 12.9 | 775 | 11.1 |
| U.S. dependent areas | 87 | 25.5 | 78 | 22.9 | 91 | 26.8 | 77 | 22.8 | 75 | 22.6 |
| Subtotal, male aged 50–64 years | 4,315 | 14.1 | 4,377 | 14.2 | 4,294 | 13.8 | 4,128 | 13.3 | 3,904 | 12.6 |
| Female adult | ||||||||||
| Race/Ethnicity | ||||||||||
| American Indian/Alaska Native | 9 | – | 9 | – | 9 | – | 11 | – | 7 | – |
| Asian | 24 | – | 20 | – | 22 | – | 30 | – | 23 | – |
| Black/African American | 966 | – | 955 | – | 1,003 | – | 943 | – | 921 | – |
| Hispanic/Latinob | 268 | – | 263 | – | 274 | – | 247 | – | 285 | – |
| Native Hawaiian/other Pacific Islander | 3 | – | 2 | – | 4 | – | 1 | – | 2 | – |
| White | 264 | – | 306 | – | 322 | – | 325 | – | 292 | – |
| Multiple races | 46 | – | 53 | – | 42 | – | 32 | – | 29 | – |
| Transmission Categoryc | ||||||||||
| Injection drug use | 226 | – | 223 | – | 249 | – | 218 | – | 218 | – |
| Heterosexual contactd | 1,351 | – | 1,383 | – | 1,424 | – | 1,368 | – | 1,339 | – |
| Othere | 2 | – | 2 | – | 3 | – | 3 | – | 3 | – |
| Region of residencef | ||||||||||
| Northeast | 332 | 5.5 | 363 | 6.0 | 352 | 5.8 | 344 | 5.7 | 323 | 5.4 |
| Midwest | 142 | 2.0 | 160 | 2.3 | 173 | 2.5 | 169 | 2.4 | 140 | 2.0 |
| South | 863 | 7.2 | 871 | 7.2 | 901 | 7.4 | 841 | 6.9 | 860 | 7.0 |
| West | 212 | 2.9 | 187 | 2.6 | 221 | 3.0 | 207 | 2.8 | 212 | 2.9 |
| U.S. dependent areas | 31 | 7.8 | 27 | 6.8 | 29 | 7.4 | 28 | 7.2 | 24 | 6.3 |
| Subtotal, female aged 50–64 years | 1,580 | 4.8 | 1,608 | 4.9 | 1,676 | 5.1 | 1,589 | 4.8 | 1,559 | 4.7 |
| Both sexes | ||||||||||
| Race/Ethnicity | ||||||||||
| American Indian/Alaska Native | 25 | – | 23 | – | 26 | – | 29 | – | 27 | – |
| Asian | 89 | – | 91 | – | 101 | – | 103 | – | 91 | – |
| Black/African American | 2,423 | – | 2,404 | – | 2,399 | – | 2,305 | – | 2,194 | – |
| Hispanic/Latinob | 1,087 | – | 1,150 | – | 1,171 | – | 1,118 | – | 1,204 | – |
| Native Hawaiian/other Pacific Islander | 6 | – | 12 | – | 7 | – | 5 | – | 9 | – |
| White | 2,087 | – | 2,129 | – | 2,102 | – | 2,020 | – | 1,839 | – |
| Multiple races | 178 | – | 176 | – | 164 | – | 137 | – | 99 | – |
| Region of residencef | ||||||||||
| Northeast | 1,168 | 10.0 | 1,155 | 9.9 | 1,058 | 9.0 | 998 | 8.6 | 985 | 8.5 |
| Midwest | 638 | 4.6 | 691 | 5.0 | 741 | 5.4 | 683 | 5.0 | 639 | 4.7 |
| South | 2,901 | 12.6 | 2,939 | 12.6 | 2,897 | 12.3 | 2,822 | 11.9 | 2,753 | 11.6 |
| West | 1,070 | 7.6 | 1,095 | 7.7 | 1,154 | 8.1 | 1,109 | 7.8 | 987 | 6.9 |
| U.S. dependent areas | 118 | 16.0 | 105 | 14.3 | 120 | 16.4 | 105 | 14.4 | 99 | 13.8 |
| Subtotal, aged 50–64 years | 5,895 | 9.3 | 5,985 | 9.4 | 5,970 | 9.3 | 5,717 | 8.9 | 5,463 | 8.6 |
| Aged ≥65 years of age at diagnosis | ||||||||||
| Male adult | ||||||||||
| Race/Ethnicity | ||||||||||
| American Indian/Alaska Native | 1 | – | 0 | – | 3 | – | 3 | – | 3 | – |
| Asian | 15 | – | 10 | – | 19 | – | 11 | – | 17 | – |
| Black/African American | 245 | – | 222 | – | 224 | – | 214 | – | 227 | – |
| Hispanic/Latinob | 107 | – | 132 | – | 115 | – | 133 | – | 126 | – |
| Native Hawaiian/other Pacific Islander | 1 | – | 0 | – | 2 | – | 1 | – | 1 | – |
| White | 262 | – | 257 | – | 270 | – | 245 | – | 257 | – |
| Multiple races | 18 | – | 24 | – | 11 | – | 10 | – | 13 | – |
| Transmission Categoryc | ||||||||||
| Male-to-male sexual contact | 365 | – | 356 | – | 342 | – | 342 | – | 385 | – |
| Injection drug use | 63 | – | 59 | – | 66 | – | 64 | – | 53 | – |
| Male-to-male sexual contact and injection drug use | 10 | – | 14 | – | 18 | – | 15 | – | 13 | – |
| Heterosexual contactd | 206 | – | 211 | – | 212 | – | 190 | – | 188 | – |
| Othere | 6 | – | 6 | – | 7 | – | 6 | – | 5 | – |
| Region of residencef | ||||||||||
| Northeast | 157 | 4.2 | 134 | 3.5 | 126 | 3.2 | 111 | 2.7 | 112 | 2.7 |
| Midwest | 57 | 1.3 | 63 | 1.4 | 57 | 1.2 | 71 | 1.5 | 75 | 1.5 |
| South | 306 | 4.0 | 313 | 3.9 | 315 | 3.8 | 305 | 3.6 | 311 | 3.5 |
| West | 110 | 2.4 | 115 | 2.4 | 125 | 2.5 | 113 | 2.2 | 130 | 2.4 |
| U.S. dependent areas | 19 | 6.7 | 20 | 6.9 | 21 | 7.1 | 17 | 5.6 | 16 | 5.2 |
| Subtotal, male aged ≥65 years | 649 | 3.2 | 645 | 3.0 | 644 | 2.9 | 617 | 2.7 | 644 | 2.7 |
| Female adult | ||||||||||
| Race/Ethnicity | ||||||||||
| American Indian/Alaska Native | 0 | – | 1 | – | 1 | – | 1 | – | 0 | – |
| Asian | 1 | – | 5 | – | 5 | – | 5 | – | 7 | – |
| Black/African American | 143 | – | 152 | – | 139 | – | 189 | – | 148 | – |
| Hispanic/Latinob | 37 | – | 42 | – | 48 | – | 45 | – | 57 | – |
| Native Hawaiian/other Pacific Islander | 0 | – | 0 | – | 0 | – | 0 | – | 0 | – |
| White | 23 | – | 31 | – | 32 | – | 30 | – | 33 | – |
| Multiple races | 5 | – | 5 | – | 9 | – | 5 | – | 11 | – |
| Transmission Categoryc | ||||||||||
| Injection drug use | 34 | – | 27 | – | 30 | – | 29 | – | 29 | – |
| Heterosexual contactd | 174 | – | 207 | – | 203 | – | 245 | – | 225 | – |
| Othere | 2 | – | 2 | – | 1 | – | 1 | – | 2 | – |
| Region of residencef | ||||||||||
| Northeast | 64 | 1.3 | 55 | 1.1 | 58 | 1.1 | 61 | 1.2 | 56 | 1.0 |
| Midwest | 19 | 0.3 | 21 | 0.4 | 15 | 0.3 | 20 | 0.3 | 21 | 0.3 |
| South | 97 | 1.0 | 119 | 1.2 | 133 | 1.3 | 168 | 1.6 | 131 | 1.2 |
| West | 21 | 0.4 | 30 | 0.5 | 25 | 0.4 | 22 | 0.4 | 42 | 0.7 |
| U.S. dependent areas | 8 | 2.2 | 11 | 2.9 | 3 | 0.8 | 4 | 1.0 | 6 | 1.5 |
| Subtotal, female aged ≥65 years | 209 | 0.8 | 236 | 0.9 | 234 | 0.8 | 275 | 1.0 | 256 | 0.9 |
| Both sexes | ||||||||||
| Race/Ethnicity | ||||||||||
| American Indian/Alaska Native | 1 | – | 1 | – | 4 | – | 4 | – | 3 | – |
| Asian | 16 | – | 15 | – | 24 | – | 16 | – | 24 | – |
| Black/African American | 388 | – | 374 | – | 363 | – | 403 | – | 375 | – |
| Hispanic/Latinob | 144 | – | 174 | – | 163 | – | 178 | – | 183 | – |
| Native Hawaiian/other Pacific Islander | 1 | – | 0 | – | 2 | – | 1 | – | 1 | – |
| White | 285 | – | 288 | – | 302 | – | 275 | – | 290 | – |
| Multiple races | 23 | – | 29 | – | 20 | – | 15 | – | 24 | – |
| Region of residencef | ||||||||||
| Northeast | 221 | 2.5 | 189 | 2.1 | 184 | 2.0 | 172 | 1.8 | 168 | 1.8 |
| Midwest | 76 | 0.8 | 84 | 0.8 | 72 | 0.7 | 91 | 0.8 | 96 | 0.9 |
| South | 403 | 2.3 | 432 | 2.4 | 448 | 2.4 | 473 | 2.5 | 442 | 2.2 |
| West | 131 | 1.3 | 145 | 1.4 | 150 | 1.4 | 135 | 1.2 | 172 | 1.5 |
| U.S. dependent areas | 27 | 4.1 | 31 | 4.6 | 24 | 3.5 | 21 | 3.0 | 22 | 3.1 |
| Subtotal, aged ≥65 years | 858 | 1.8 | 881 | 1.8 | 878 | 1.8 | 892 | 1.7 | 900 | 1.7 |
| Total | 6,753 | 6.1 | 6,866 | 6.1 | 6,848 | 6.0 | 6,609 | 5.7 | 6,363 | 5.4 |
Note. Numbers less than 12, and rates and trends based on these numbers, should be interpreted with caution.
aRates are per 100,000 population. Rates by race/ethnicity are not provided because U.S. census information for U.S. dependent areas is limited. Rates are not calculated by transmission category because of the lack of denominator data.
bHispanics/Latinos can be of any race.
cData have been statistically adjusted to account for missing transmission category; therefore, values may not sum to the column subtotals and total.
dHeterosexual contact with a person known to have, or to be at high risk for, HIV infection.
eIncludes hemophilia, blood transfusion, and risk factor not reported or not identified.
fData are based on residence at time of diagnosis of HIV infection.
50–54
| Aged 50–54 Years of Age at Diagnosis | ||||||||||
|---|---|---|---|---|---|---|---|---|---|---|
| 2014 | 2015 | 2016 | 2017 | 2018 | ||||||
| No. | Ratea | No. | Ratea | No. | Ratea | No. | Ratea | No. | Ratea | |
| Male adult | ||||||||||
| Race/Ethnicity | ||||||||||
| American Indian/Alaska Native | 13 | 16.5 | 8 | 10.3 | 7 | 9.2 | 11 | 14.8 | 13 | 18.1 |
| Asian | 42 | 8.2 | 45 | 8.6 | 40 | 7.5 | 39 | 7.2 | 30 | 5.5 |
| Black/African American | 670 | 52.5 | 703 | 55.4 | 668 | 53.2 | 611 | 49.5 | 590 | 48.6 |
| Hispanic/Latinob | 409 | 28.1 | 467 | 31.0 | 464 | 29.8 | 441 | 27.6 | 457 | 27.8 |
| Native Hawaiian/other Pacific Islander | 1 | 6.0 | 6 | 35.2 | 2 | 11.7 | 2 | 11.7 | 1 | 5.8 |
| White | 982 | 12.9 | 962 | 13.0 | 908 | 12.7 | 832 | 12.0 | 680 | 10.2 |
| Multiple races | 76 | 66.5 | 61 | 53.5 | 55 | 48.7 | 54 | 48.2 | 42 | 37.7 |
| Transmission Categoryc | ||||||||||
| Male-to-male sexual contact | 1,524 | – | 1,605 | – | 1,532 | – | 1,453 | – | 1,253 | – |
| Injection drug use | 159 | – | 162 | – | 159 | – | 130 | – | 147 | – |
| Male-to-male sexual contact and injection drug use | 92 | – | 89 | – | 78 | – | 81 | – | 80 | – |
| Heterosexual contactd | 416 | – | 394 | – | 374 | – | 324 | – | 331 | – |
| Othere | 1 | – | 1 | – | 1 | – | 1 | – | 2 | – |
| Region of residencef | ||||||||||
| Northeast | 424 | 20.7 | 391 | 19.3 | 351 | 17.8 | 322 | 16.7 | 299 | 15.9 |
| Midwest | 255 | 10.6 | 294 | 12.4 | 286 | 12.5 | 261 | 11.8 | 264 | 12.3 |
| South | 1,053 | 25.8 | 1,054 | 25.9 | 1,005 | 25.1 | 944 | 23.9 | 904 | 23.3 |
| West | 461 | 18.4 | 513 | 20.7 | 502 | 20.6 | 463 | 19.3 | 346 | 14.6 |
| Subtotal, male adult | 2,193 | 19.8 | 2,252 | 20.6 | 2,144 | 20.0 | 1,990 | 19.0 | 1,813 | 17.6 |
| Female adult | ||||||||||
| Race/Ethnicity | ||||||||||
| American Indian/Alaska Native | 5 | 5.9 | 4 | 4.8 | 5 | 6.1 | 7 | 8.8 | 3 | 3.9 |
| Asian | 8 | 1.4 | 8 | 1.3 | 10 | 1.6 | 15 | 2.4 | 9 | 1.4 |
| Black/African American | 414 | 28.6 | 432 | 30.0 | 439 | 30.8 | 385 | 27.5 | 374 | 27.1 |
| Hispanic/Latinob | 107 | 7.3 | 129 | 8.6 | 115 | 7.4 | 98 | 6.2 | 124 | 7.7 |
| Native Hawaiian/other Pacific Islander | 1 | 5.8 | 1 | 5.7 | 4 | 22.7 | 0 | 0.0 | 1 | 5.7 |
| White | 135 | 1.7 | 147 | 1.9 | 140 | 1.9 | 141 | 2.0 | 141 | 2.1 |
| Multiple races | 22 | 17.4 | 25 | 19.7 | 18 | 14.3 | 16 | 12.8 | 11 | 8.8 |
| Transmission Categoryc | ||||||||||
| Injection drug use | 100 | – | 102 | – | 118 | – | 98 | – | 95 | – |
| Heterosexual contactd | 591 | – | 643 | – | 612 | – | 564 | – | 567 | – |
| Othere | 1 | – | 0 | – | 1 | – | 0 | – | 1 | – |
| Region of residencef | ||||||||||
| Northeast | 149 | 6.9 | 173 | 8.1 | 161 | 7.7 | 150 | 7.4 | 136 | 6.9 |
| Midwest | 60 | 2.4 | 73 | 3.0 | 68 | 2.9 | 64 | 2.8 | 59 | 2.7 |
| South | 384 | 9.0 | 414 | 9.7 | 399 | 9.5 | 360 | 8.7 | 384 | 9.5 |
| West | 99 | 3.9 | 86 | 3.4 | 103 | 4.2 | 88 | 3.6 | 84 | 3.5 |
| Subtotal, female adult | 692 | 6.0 | 746 | 6.6 | 731 | 6.6 | 662 | 6.1 | 663 | 6.3 |
| Both sexes | ||||||||||
| Race/Ethnicity | ||||||||||
| American Indian/Alaska Native | 18 | 11.0 | 12 | 7.4 | 12 | 7.6 | 18 | 11.7 | 16 | 10.7 |
| Asian | 50 | 4.5 | 53 | 4.7 | 50 | 4.4 | 54 | 4.6 | 39 | 3.3 |
| Black/African American | 1,084 | 39.8 | 1,135 | 41.9 | 1,107 | 41.3 | 996 | 37.8 | 964 | 37.2 |
| Hispanic/Latinob | 516 | 17.7 | 596 | 19.8 | 579 | 18.6 | 539 | 16.9 | 581 | 17.8 |
| Native Hawaiian/other Pacific Islander | 2 | 5.9 | 7 | 20.3 | 6 | 17.3 | 2 | 5.8 | 2 | 5.8 |
| White | 1,117 | 7.3 | 1,109 | 7.4 | 1,048 | 7.3 | 973 | 7.0 | 821 | 6.1 |
| Multiple races | 98 | 40.7 | 86 | 35.7 | 73 | 30.5 | 70 | 29.5 | 53 | 22.4 |
| Region of residencef | ||||||||||
| Northeast | 573 | 13.6 | 564 | 13.6 | 512 | 12.6 | 472 | 11.9 | 435 | 11.3 |
| Midwest | 315 | 6.4 | 367 | 7.7 | 354 | 7.7 | 325 | 7.3 | 323 | 7.4 |
| South | 1,437 | 17.2 | 1,468 | 17.6 | 1,404 | 17.1 | 1,304 | 16.1 | 1,288 | 16.2 |
| West | 560 | 11.1 | 599 | 12.0 | 605 | 12.3 | 551 | 11.4 | 430 | 9.0 |
| Total | 2,885 | 12.8 | 2,998 | 13.5 | 2,875 | 13.2 | 2,652 | 12.4 | 2,476 | 11.9 |
55–59
| Aged 55–59 Years of Age at Diagnosis | ||||||||||
|---|---|---|---|---|---|---|---|---|---|---|
| 2014 | 2015 | 2016 | 2017 | 2018 | ||||||
| No. | Ratea | No. | Ratea | No. | Ratea | No. | Ratea | No. | Ratea | |
| Male adult | ||||||||||
| Race/Ethnicity | ||||||||||
| American Indian/Alaska Native | 3 | 4.3 | 6 | 8.3 | 6 | 8.2 | 3 | 4.1 | 5 | 6.7 |
| Asian | 13 | 2.9 | 20 | 4.3 | 25 | 5.3 | 22 | 4.5 | 21 | 4.2 |
| Black/African American | 516 | 44.8 | 492 | 41.7 | 456 | 38.1 | 470 | 39.1 | 432 | 35.8 |
| Hispanic/Latinob | 215 | 19.1 | 248 | 20.9 | 225 | 18.1 | 236 | 18.2 | 270 | 19.9 |
| Native Hawaiian/other Pacific Islander | 0 | 0.0 | 3 | 20.1 | 0 | 0 | 0 | 0.0 | 4 | 24.4 |
| White | 548 | 7.3 | 538 | 7.1 | 569 | 7.5 | 550 | 7.3 | 551 | 7.4 |
| Multiple races | 40 | 39.7 | 40 | 38.5 | 42 | 39.3 | 31 | 28.5 | 16 | 14.5 |
| Transmission Categoryc | ||||||||||
| Male-to-male sexual contact | 854 | – | 849 | – | 887 | – | 868 | – | 879 | – |
| Injection drug use | 131 | – | 127 | – | 105 | – | 119 | – | 114 | – |
| Male-to-male sexual contact and injection drug use | 49 | – | 55 | – | 49 | – | 46 | – | 40 | – |
| Heterosexual contactd | 299 | – | 313 | – | 280 | – | 278 | – | 262 | – |
| Othere | 2 | – | 2 | – | 2 | – | 2 | – | 4 | – |
| Region of residencef | ||||||||||
| Northeast | 277 | 14.2 | 282 | 14.3 | 226 | 11.4 | 202 | 10.3 | 234 | 12.0 |
| Midwest | 162 | 6.9 | 155 | 6.6 | 187 | 7.9 | 171 | 7.3 | 148 | 6.4 |
| South | 637 | 16.8 | 650 | 16.9 | 628 | 16.1 | 652 | 16.6 | 644 | 16.2 |
| West | 259 | 11.0 | 260 | 10.9 | 282 | 11.7 | 287 | 11.9 | 273 | 11.3 |
| Subtotal, male adult | 1,335 | 12.8 | 1,347 | 12.8 | 1,323 | 12.4 | 1,312 | 12.3 | 1,299 | 12.2 |
| Female adult | ||||||||||
| Race/Ethnicity | ||||||||||
| American Indian/Alaska Native | 3 | 3.8 | 4 | 5 | 2 | 2.4 | 2 | 2.4 | 3 | 3.6 |
| Asian | 10 | 1.9 | 4 | 0.7 | 8 | 1.4 | 8 | 1.4 | 9 | 1.5 |
| Black/African American | 375 | 28.0 | 321 | 23.4 | 347 | 25 | 334 | 24.0 | 343 | 24.5 |
| Hispanic/Latinob | 90 | 7.6 | 69 | 5.6 | 83 | 6.4 | 75 | 5.6 | 83 | 6.0 |
| Native Hawaiian/other Pacific Islander | 1 | 6.8 | 1 | 6.5 | 0 | 0.0 | 1 | 6.0 | 1 | 5.8 |
| White | 96 | 1.2 | 115 | 1.5 | 112 | 1.4 | 132 | 1.7 | 102 | 1.3 |
| Multiple races | 13 | 11.8 | 22 | 19.3 | 19 | 16.2 | 13 | 10.8 | 9 | 7.4 |
| Transmission Categoryc | ||||||||||
| Injection drug use | 87 | – | 77 | – | 80 | – | 74 | – | 76 | – |
| Heterosexual contactd | 500 | – | 458 | – | 491 | – | 490 | – | 473 | – |
| Othere | 1 | – | 1 | – | 1 | – | 1 | – | 1 | – |
| Region of residencef | ||||||||||
| Northeast | 137 | 6.6 | 111 | 5.3 | 119 | 5.7 | 117 | 5.6 | 113 | 5.4 |
| Midwest | 62 | 2.5 | 59 | 2.4 | 65 | 2.6 | 75 | 3.1 | 57 | 2.4 |
| South | 320 | 7.8 | 303 | 7.3 | 305 | 7.3 | 294 | 7.0 | 300 | 7.1 |
| West | 69 | 2.8 | 63 | 2.5 | 82 | 3.3 | 79 | 3.1 | 80 | 3.2 |
| Subtotal, female adult | 588 | 5.3 | 536 | 4.8 | 571 | 5.1 | 565 | 5.0 | 550 | 4.9 |
| Both sexes | ||||||||||
| Race/Ethnicity | ||||||||||
| American Indian/Alaska Native | 6 | 4.0 | 10 | 6.5 | 8 | 5.2 | 5 | 3.2 | 8 | 5.1 |
| Asian | 23 | 2.3 | 24 | 2.4 | 33 | 3.2 | 30 | 2.8 | 30 | 2.7 |
| Black/African American | 891 | 35.7 | 813 | 31.9 | 803 | 31.1 | 804 | 31.0 | 775 | 29.7 |
| Hispanic/Latinob | 305 | 13.2 | 317 | 13.1 | 308 | 12.2 | 311 | 11.8 | 353 | 12.8 |
| Native Hawaiian/other Pacific Islander | 1 | 3.5 | 4 | 13.2 | 0 | 0.0 | 1 | 3.1 | 5 | 14.9 |
| White | 644 | 4.2 | 653 | 4.3 | 681 | 4.4 | 682 | 4.5 | 653 | 4.3 |
| Multiple races | 53 | 25.1 | 62 | 28.4 | 61 | 27.2 | 44 | 19.3 | 25 | 10.8 |
| Region of residencef | ||||||||||
| Northeast | 414 | 10.3 | 393 | 9.7 | 345 | 8.5 | 319 | 7.9 | 347 | 8.6 |
| Midwest | 224 | 4.7 | 214 | 4.4 | 252 | 5.2 | 246 | 5.1 | 205 | 4.3 |
| South | 957 | 12.2 | 953 | 11.9 | 933 | 11.5 | 946 | 11.6 | 944 | 11.5 |
| West | 328 | 6.8 | 323 | 6.6 | 364 | 7.4 | 366 | 7.4 | 353 | 7.1 |
| Total | 1,923 | 9.0 | 1,883 | 8.7 | 1,894 | 8.6 | 1,877 | 8.5 | 1,849 | 8.4 |
60–64
| Aged 60–64 Years of Age at Diagnosis | ||||||||||
|---|---|---|---|---|---|---|---|---|---|---|
| 2014 | 2015 | 2016 | 2017 | 2018 | ||||||
| No. | Ratea | No. | Ratea | No. | Ratea | No. | Ratea | No. | Ratea | |
| Male adult | ||||||||||
| Race/Ethnicity | ||||||||||
| American Indian/Alaska Native | 0 | 0.0 | 0 | 0.0 | 4 | 6.7 | 4 | 6.4 | 2 | 3.1 |
| Asian | 9 | 2.4 | 6 | 1.5 | 14 | 3.4 | 12 | 2.8 | 17 | 3.8 |
| Black/African American | 265 | 29.8 | 254 | 27.5 | 270 | 28.2 | 281 | 28.2 | 249 | 24.1 |
| Hispanic/Latinob | 116 | 14.3 | 97 | 11.2 | 120 | 13.1 | 119 | 12.3 | 122 | 11.9 |
| Native Hawaiian/other Pacific Islander | 2 | 18.4 | 0 | 0.0 | 0 | 0.0 | 0 | 0.0 | 1 | 7.5 |
| White | 292 | 4.4 | 321 | 4.7 | 303 | 4.4 | 313 | 4.5 | 314 | 4.4 |
| Multiple races | 16 | 20.7 | 22 | 27.1 | 25 | 29.3 | 20 | 22.4 | 12 | 12.9 |
| Transmission Categoryc | ||||||||||
| Male-to-male sexual contact | 433 | – | 420 | – | 436 | – | 453 | – | 464 | – |
| Injection drug use | 79 | – | 64 | – | 69 | – | 68 | – | 68 | – |
| Male-to-male sexual contact and injection drug use | 22 | – | 21 | – | 27 | – | 26 | – | 18 | – |
| Heterosexual contactd | 164 | – | 192 | – | 202 | – | 200 | – | 167 | – |
| Othere | 2 | – | 3 | – | 2 | – | 3 | – | 2 | – |
| Region of residencef | ||||||||||
| Northeast | 135 | 8.3 | 119 | 7.1 | 129 | 7.6 | 130 | 7.5 | 129 | 7.3 |
| Midwest | 79 | 4.0 | 82 | 4.0 | 95 | 4.6 | 82 | 3.9 | 87 | 4.0 |
| South | 348 | 10.8 | 364 | 11.0 | 363 | 10.7 | 385 | 11.0 | 345 | 9.6 |
| West | 138 | 6.8 | 135 | 6.5 | 149 | 7.0 | 152 | 7.0 | 156 | 7.1 |
| Subtotal, male adult | 700 | 7.9 | 700 | 7.7 | 736 | 7.9 | 749 | 7.9 | 717 | 7.4 |
| Female adult | ||||||||||
| Race/Ethnicity | ||||||||||
| American Indian/Alaska Native | 1 | 1.6 | 1 | 1.5 | 2 | 2.9 | 2 | 2.8 | 1 | 1.4 |
| Asian | 6 | 1.3 | 8 | 1.6 | 4 | 0.8 | 7 | 1.3 | 5 | 0.9 |
| Black/African American | 174 | 15.9 | 202 | 17.8 | 217 | 18.5 | 224 | 18.4 | 204 | 16.3 |
| Hispanic/Latinob | 43 | 4.8 | 38 | 4.0 | 47 | 4.7 | 47 | 4.4 | 54 | 4.8 |
| Native Hawaiian/other Pacific Islander | 1 | 8.6 | 0 | 0.0 | 0 | 0.0 | 0 | 0.0 | 0 | 0.0 |
| White | 33 | 0.5 | 44 | 0.6 | 70 | 1.0 | 51 | 0.7 | 49 | 0.7 |
| Multiple races | 11 | 12.9 | 6 | 6.7 | 5 | 5.3 | 3 | 3.0 | 9 | 8.7 |
| Transmission Categoryc | ||||||||||
| Injection drug use | 37 | – | 43 | – | 49 | – | 43 | – | 46 | – |
| Heterosexual contactd | 232 | – | 256 | – | 295 | – | 290 | – | 275 | – |
| Othere | 1 | – | 1 | – | 1 | – | 1 | – | 1 | – |
| Region of residencef | ||||||||||
| Northeast | 46 | 2.6 | 79 | 4.3 | 72 | 3.9 | 77 | 4.1 | 74 | 3.8 |
| Midwest | 20 | 0.9 | 28 | 1.3 | 40 | 1.8 | 30 | 1.3 | 24 | 1.0 |
| South | 159 | 4.4 | 154 | 4.2 | 197 | 5.2 | 187 | 4.8 | 176 | 4.4 |
| West | 44 | 2.0 | 38 | 1.7 | 36 | 1.6 | 40 | 1.7 | 48 | 2.0 |
| Subtotal, female adult | 269 | 2.8 | 299 | 3.0 | 345 | 3.4 | 334 | 3.2 | 322 | 3.0 |
| Both sexes | ||||||||||
| Race/Ethnicity | ||||||||||
| American Indian/Alaska Native | 1 | 0.8 | 1 | 0.8 | 6 | 4.7 | 6 | 4.5 | 3 | 2.2 |
| Asian | 15 | 1.8 | 14 | 1.6 | 18 | 2.0 | 19 | 2.0 | 22 | 2.2 |
| Black/African American | 439 | 22.1 | 456 | 22.2 | 487 | 22.9 | 505 | 22.8 | 453 | 19.8 |
| Hispanic/Latinob | 159 | 9.3 | 135 | 7.4 | 167 | 8.7 | 166 | 8.2 | 176 | 8.2 |
| Native Hawaiian/other Pacific Islander | 3 | 13.3 | 0 | 0.0 | 0 | 0.0 | 0 | 0.0 | 1 | 3.6 |
| White | 325 | 2.4 | 365 | 2.6 | 373 | 2.6 | 364 | 2.5 | 363 | 2.5 |
| Multiple races | 27 | 16.6 | 28 | 16.4 | 30 | 16.7 | 23 | 12.1 | 21 | 10.6 |
| Region of residencef | ||||||||||
| Northeast | 181 | 5.3 | 198 | 5.7 | 201 | 5.6 | 207 | 5.7 | 203 | 5.5 |
| Midwest | 99 | 2.4 | 110 | 2.6 | 135 | 3.1 | 112 | 2.6 | 111 | 2.5 |
| South | 507 | 7.4 | 518 | 7.4 | 560 | 7.8 | 572 | 7.7 | 521 | 6.9 |
| West | 182 | 4.3 | 173 | 4.0 | 185 | 4.2 | 192 | 4.2 | 204 | 4.4 |
| Total | 969 | 5.2 | 999 | 5.3 | 1,081 | 5.6 | 1,083 | 5.4 | 1,039 | 5.1 |
65–69
| Aged 65–69 Years of Age at Diagnosis | ||||||||||
|---|---|---|---|---|---|---|---|---|---|---|
| 2014 | 2015 | 2016 | 2017 | 2018 | ||||||
| No. | Ratea | No. | Ratea | No. | Ratea | No. | Ratea | No. | Ratea | |
| Male adult | ||||||||||
| Race/Ethnicity | ||||||||||
| American Indian/Alaska Native | 0 | 0.0 | 0 | 0.0 | 1 | 2.1 | 2 | 4.1 | 2 | 4.0 |
| Asian | 11 | 3.8 | 7 | 2.2 | 9 | 2.7 | 6 | 1.7 | 8 | 2.2 |
| Black/African American | 153 | 24.2 | 138 | 20.4 | 145 | 20.1 | 128 | 17.3 | 123 | 16.1 |
| Hispanic/Latinob | 56 | 9.7 | 67 | 10.8 | 59 | 8.9 | 74 | 10.7 | 60 | 8.3 |
| Native Hawaiian/other Pacific Islander | 0 | 0.0 | 0 | 0.0 | 1 | 10.6 | 0 | 0.0 | 1 | 9.6 |
| White | 160 | 2.8 | 155 | 2.6 | 187 | 3.1 | 149 | 2.5 | 149 | 2.5 |
| Multiple races | 8 | 14.1 | 18 | 29.6 | 6 | 9.3 | 6 | 9.0 | 9 | 13.0 |
| Transmission Categoryc | ||||||||||
| Male-to-male sexual contact | 230 | – | 225 | – | 222 | – | 214 | – | 231 | – |
| Injection drug use | 38 | – | 37 | – | 43 | – | 36 | – | 25 | – |
| Male-to-male sexual contact and injection drug use | 8 | – | 9 | – | 12 | – | 11 | – | 9 | – |
| Heterosexual contactd | 110 | – | 112 | – | 128 | – | 101 | – | 86 | – |
| Othere | 2 | – | 2 | – | 3 | – | 2 | – | 1 | – |
| Region of residencef | ||||||||||
| Northeast | 96 | 7.4 | 85 | 6.3 | 79 | 5.6 | 69 | 4.9 | 64 | 4.5 |
| Midwest | 38 | 2.4 | 41 | 2.5 | 45 | 2.6 | 49 | 2.8 | 48 | 2.7 |
| South | 182 | 6.6 | 194 | 6.8 | 201 | 6.7 | 194 | 6.6 | 168 | 5.6 |
| West | 72 | 4.4 | 65 | 3.8 | 83 | 4.6 | 53 | 2.9 | 72 | 3.9 |
| Subtotal, male adult | 388 | 5.4 | 385 | 5.1 | 408 | 5.1 | 365 | 4.6 | 352 | 4.4 |
| Female adult | ||||||||||
| Race/Ethnicity | ||||||||||
| American Indian/Alaska Native | 0 | 0.0 | 1 | 2.0 | 1 | 1.9 | 1 | 1.8 | 0 | 0.0 |
| Asian | 1 | 0.3 | 5 | 1.3 | 4 | 0.9 | 3 | 0.7 | 5 | 1.1 |
| Black/African American | 103 | 12.6 | 104 | 11.9 | 99 | 10.6 | 115 | 12.0 | 83 | 8.4 |
| Hispanic/Latinob | 14 | 2.1 | 22 | 3.0 | 27 | 3.5 | 18 | 2.2 | 25 | 3.0 |
| Native Hawaiian/other Pacific Islander | 0 | 0.0 | 0 | 0.0 | 0 | 0.0 | 0 | 0.0 | 0 | 0.0 |
| White | 14 | 0.2 | 17 | 0.3 | 17 | 0.3 | 12 | 0.2 | 16 | 0.2 |
| Multiple races | 3 | 4.6 | 3 | 4.4 | 6 | 8.2 | 3 | 4.0 | 8 | 10.2 |
| Transmission Categoryc | ||||||||||
| Injection drug use | 21 | – | 18 | – | 20 | – | 16 | – | 16 | – |
| Heterosexual contactd | 113 | – | 133 | – | 134 | – | 136 | – | 120 | – |
| Othere | 1 | – | 1 | – | 0 | – | 0 | – | 1 | – |
| Region of residencef | ||||||||||
| Northeast | 40 | 2.7 | 30 | 1.9 | 36 | 2.2 | 28 | 1.8 | 28 | 1.7 |
| Midwest | 15 | 0.9 | 13 | 0.7 | 13 | 0.7 | 13 | 0.7 | 12 | 0.6 |
| South | 66 | 2.1 | 85 | 2.6 | 91 | 2.7 | 97 | 2.9 | 69 | 2.0 |
| West | 14 | 0.8 | 24 | 1.3 | 14 | 0.7 | 14 | 0.7 | 28 | 1.4 |
| Subtotal, female adult | 135 | 1.7 | 152 | 1.8 | 154 | 1.7 | 152 | 1.7 | 137 | 1.5 |
| Both sexes | ||||||||||
| Race/Ethnicity | ||||||||||
| American Indian/Alaska Native | 0 | 0.0 | 1 | 1.0 | 2 | 2.0 | 3 | 2.9 | 2 | 1.9 |
| Asian | 12 | 1.8 | 12 | 1.7 | 13 | 1.7 | 9 | 1.1 | 13 | 1.6 |
| Black/African American | 256 | 17.7 | 242 | 15.7 | 244 | 14.8 | 243 | 14.3 | 206 | 11.7 |
| Hispanic/Latinob | 70 | 5.6 | 89 | 6.6 | 86 | 6.0 | 92 | 6.2 | 85 | 5.4 |
| Native Hawaiian/other Pacific Islander | 0 | 0.0 | 0 | 0.0 | 1 | 5.1 | 0 | 0.0 | 1 | 4.6 |
| White | 174 | 1.5 | 172 | 1.4 | 204 | 1.6 | 161 | 1.3 | 165 | 1.3 |
| Multiple races | 11 | 9.1 | 21 | 16.2 | 12 | 8.7 | 9 | 6.4 | 17 | 11.5 |
| Region of residencef | ||||||||||
| Northeast | 136 | 4.9 | 115 | 4.0 | 115 | 3.8 | 97 | 3.2 | 92 | 3.0 |
| Midwest | 53 | 1.6 | 54 | 1.6 | 58 | 1.6 | 62 | 1.7 | 60 | 1.6 |
| South | 248 | 4.3 | 279 | 4.6 | 292 | 4.6 | 291 | 4.6 | 237 | 3.7 |
| West | 86 | 2.5 | 89 | 2.5 | 97 | 2.6 | 67 | 1.8 | 100 | 2.6 |
| Total | 523 | 3.4 | 537 | 3.3 | 562 | 3.3 | 517 | 3.1 | 489 | 2.9 |
70–74
| Aged 70–74 Years of Age at Diagnosis | ||||||||||
|---|---|---|---|---|---|---|---|---|---|---|
| 2014 | 2015 | 2016 | 2017 | 2018 | ||||||
| No. | Ratea | No. | Ratea | No. | Ratea | No. | Ratea | No. | Ratea | |
| Male adult | ||||||||||
| Race/Ethnicity | ||||||||||
| American Indian/Alaska Native | 1 | 3.6 | 0 | 0.0 | 1 | 3.3 | 1 | 3.0 | 1 | 2.8 |
| Asian | 3 | 1.5 | 1 | 0.5 | 7 | 3.1 | 5 | 2.0 | 3 | 1.1 |
| Black/African American | 50 | 12.2 | 52 | 12.2 | 52 | 11.7 | 56 | 11.7 | 61 | 12.0 |
| Hispanic/Latinob | 21 | 5.6 | 28 | 7.0 | 23 | 5.4 | 22 | 4.7 | 34 | 6.8 |
| Native Hawaiian/other Pacific Islander | 1 | 19.3 | 0 | 0.0 | 1 | 16.4 | 1 | 14.8 | 0 | 0.0 |
| White | 61 | 1.5 | 70 | 1.7 | 54 | 1.3 | 64 | 1.4 | 75 | 1.5 |
| Multiple races | 6 | 16.3 | 3 | 7.7 | 4 | 9.7 | 3 | 6.6 | 3 | 6.2 |
| Transmission Categoryc | ||||||||||
| Male-to-male sexual contact | 77 | – | 86 | – | 78 | – | 86 | – | 106 | – |
| Injection drug use | 13 | – | 11 | – | 12 | – | 14 | – | 15 | – |
| Male-to-male sexual contact and injection drug use | 1 | – | 2 | – | 5 | – | 2 | – | 1 | – |
| Heterosexual contactd | 51 | – | 53 | – | 45 | – | 48 | – | 54 | – |
| Othere | 2 | – | 2 | – | 2 | – | 2 | – | 2 | – |
| Region of residencef | ||||||||||
| Northeast | 31 | 3.4 | 29 | 3.1 | 29 | 3.0 | 22 | 2.1 | 27 | 2.5 |
| Midwest | 15 | 1.4 | 17 | 1.5 | 9 | 0.8 | 14 | 1.1 | 16 | 1.2 |
| South | 73 | 3.7 | 76 | 3.7 | 81 | 3.8 | 71 | 3.1 | 98 | 4.1 |
| West | 24 | 2.1 | 32 | 2.7 | 23 | 1.9 | 45 | 3.3 | 36 | 2.5 |
| Subtotal, male adult | 143 | 2.8 | 154 | 2.9 | 142 | 2.6 | 152 | 2.6 | 177 | 2.8 |
| Female adult | ||||||||||
| Race/Ethnicity | ||||||||||
| American Indian/Alaska Native | 0 | 0.0 | 0 | 0.0 | 0 | 0.0 | 0 | 0.0 | 0 | 0.0 |
| Asian | 0 | 0.0 | 0 | 0.0 | 1 | 0.4 | 2 | 0.7 | 2 | 0.6 |
| Black/African American | 27 | 4.7 | 27 | 4.5 | 26 | 4.2 | 43 | 6.5 | 43 | 6.2 |
| Hispanic/Latinob | 10 | 2.1 | 6 | 1.2 | 9 | 1.7 | 13 | 2.2 | 15 | 2.4 |
| Native Hawaiian/other Pacific Islander | 0 | 0.0 | 0 | 0.0 | 0 | 0.0 | 0 | 0.0 | 0 | 0.0 |
| White | 4 | 0.1 | 8 | 0.2 | 8 | 0.2 | 14 | 0.3 | 10 | 0.2 |
| Multiple races | 2 | 4.5 | 2 | 4.3 | 2 | 4.1 | 1 | 1.9 | 2 | 3.5 |
| Transmission Categoryc | ||||||||||
| Injection drug use | 8 | – | 5 | – | 7 | – | 8 | – | 8 | – |
| Heterosexual contactd | 35 | – | 38 | – | 39 | – | 65 | – | 64 | – |
| Othere | 1 | – | 0 | – | 0 | – | 1 | – | 0 | – |
| Region of residencef | ||||||||||
| Northeast | 18 | 1.6 | 13 | 1.2 | 13 | 1.1 | 18 | 1.4 | 20 | 1.6 |
| Midwest | 2 | 0.2 | 6 | 0.5 | 0 | 0.0 | 6 | 0.4 | 5 | 0.3 |
| South | 19 | 0.8 | 20 | 0.8 | 24 | 1.0 | 44 | 1.6 | 40 | 1.4 |
| West | 4 | 0.3 | 4 | 0.3 | 9 | 0.6 | 5 | 0.3 | 7 | 0.4 |
| Subtotal, female adult | 43 | 0.7 | 43 | 0.7 | 46 | 0.7 | 73 | 1.1 | 72 | 1.0 |
| Both sexes | ||||||||||
| Race/Ethnicity | ||||||||||
| American Indian/Alaska Native | 1 | 1.7 | 0 | 0.0 | 1 | 1.5 | 1 | 1.4 | 1 | 1.3 |
| Asian | 3 | 0.7 | 1 | 0.2 | 8 | 1.6 | 7 | 1.3 | 5 | 0.8 |
| Black/African American | 77 | 7.8 | 79 | 7.7 | 78 | 7.4 | 99 | 8.7 | 104 | 8.6 |
| Hispanic/Latinob | 31 | 3.6 | 34 | 3.7 | 32 | 3.3 | 35 | 3.4 | 49 | 4.4 |
| Native Hawaiian/other Pacific Islander | 1 | 9.3 | 0 | 0.0 | 1 | 7.9 | 1 | 7.2 | 0 | 0.0 |
| White | 65 | 0.8 | 78 | 0.9 | 62 | 0.7 | 78 | 0.8 | 85 | 0.8 |
| Multiple races | 8 | 9.9 | 5 | 5.9 | 6 | 6.7 | 4 | 4.0 | 5 | 4.7 |
| Region of residencef | ||||||||||
| Northeast | 49 | 2.4 | 42 | 2.0 | 42 | 2.0 | 40 | 1.7 | 47 | 2.0 |
| Midwest | 17 | 0.7 | 23 | 1.0 | 9 | 0.4 | 20 | 0.7 | 21 | 0.8 |
| South | 92 | 2.2 | 96 | 2.2 | 105 | 2.3 | 115 | 2.3 | 138 | 2.6 |
| West | 28 | 1.2 | 36 | 1.4 | 32 | 1.2 | 50 | 1.7 | 43 | 1.4 |
| Total | 186 | 1.7 | 197 | 1.7 | 188 | 1.6 | 225 | 1.8 | 249 | 1.9 |
75–79
| Aged 75–79 Years of Age at Diagnosis | ||||||||||
|---|---|---|---|---|---|---|---|---|---|---|
| 2014 | 2015 | 2016 | 2017 | 2018 | ||||||
| No. | Ratea | No. | Ratea | No. | Ratea | No. | Ratea | No. | Ratea | |
| Male adult | ||||||||||
| Race/Ethnicity | ||||||||||
| American Indian/Alaska Native | 0 | 0.0 | 0 | 0.0 | 1 | 5.2 | 0 | 0.0 | 0 | 0.0 |
| Asian | 0 | 0.0 | 1 | 0.7 | 3 | 1.9 | 0 | 0.0 | 4 | 2.2 |
| Black/African American | 24 | 8.9 | 26 | 9.3 | 16 | 5.5 | 17 | 5.6 | 28 | 8.8 |
| Hispanic/Latinob | 7 | 2.7 | 11 | 4.1 | 9 | 3.2 | 15 | 5.1 | 12 | 3.8 |
| Native Hawaiian/other Pacific Islander | 0 | 0.0 | 0 | 0.0 | 0 | 0.0 | 0 | 0.0 | 0 | 0.0 |
| White | 37 | 1.3 | 23 | 0.8 | 22 | 0.7 | 20 | 0.7 | 21 | 0.6 |
| Multiple races | 3 | 12.7 | 3 | 12.0 | 1 | 3.8 | 1 | 3.5 | 0 | 0.0 |
| Transmission Categoryc | ||||||||||
| Male-to-male sexual contact | 43 | – | 28 | – | 31 | – | 29 | – | 34 | – |
| Injection drug use | 7 | – | 7 | – | 5 | – | 5 | – | 6 | – |
| Male-to-male sexual contact and injection drug use | 0 | – | 1 | – | 1 | – | 1 | – | 1 | – |
| Heterosexual contactd | 20 | – | 28 | – | 14 | – | 16 | – | 24 | – |
| Othere | 1 | – | 1 | – | 1 | – | 2 | – | 1 | – |
| Region of residencef | ||||||||||
| Northeast | 22 | 3.5 | 14 | 2.2 | 11 | 1.7 | 11 | 1.6 | 12 | 1.7 |
| Midwest | 4 | 0.5 | 4 | 0.5 | 2 | 0.3 | 5 | 0.6 | 9 | 1.0 |
| South | 32 | 2.4 | 33 | 2.4 | 22 | 1.5 | 25 | 1.7 | 29 | 1.8 |
| West | 13 | 1.7 | 13 | 1.6 | 17 | 2.0 | 12 | 1.4 | 15 | 1.6 |
| Subtotal, male adult | 71 | 2.0 | 64 | 1.8 | 52 | 1.4 | 53 | 1.4 | 65 | 1.6 |
| Female adult | ||||||||||
| Race/Ethnicity | ||||||||||
| American Indian/Alaska Native | 0 | 0.0 | 0 | 0.0 | 0 | 0.0 | 0 | 0.0 | 0 | 0.0 |
| Asian | 0 | 0.0 | 0 | 0.0 | 0 | 0.0 | 0 | 0.0 | 0 | 0.0 |
| Black/African American | 7 | 1.7 | 12 | 2.8 | 6 | 1.4 | 22 | 4.8 | 14 | 2.9 |
| Hispanic/Latinob | 5 | 1.4 | 4 | 1.1 | 6 | 1.6 | 8 | 2.0 | 10 | 2.3 |
| Native Hawaiian/other Pacific Islander | 0 | 0.0 | 0 | 0.0 | 0 | 0.0 | 0 | 0.0 | 0 | 0.0 |
| White | 3 | 0.1 | 2 | 0.1 | 3 | 0.1 | 4 | 0.1 | 3 | 0.1 |
| Multiple races | 0 | 0.0 | 0 | 0.0 | 1 | 3.0 | 1 | 2.9 | 1 | 2.7 |
| Transmission Categoryc | ||||||||||
| Injection drug use | 2 | – | 2 | – | 1 | – | 4 | – | 2 | – |
| Heterosexual contactd | 13 | – | 16 | – | 15 | – | 31 | – | 25 | – |
| Othere | 0 | – | 0 | – | 0 | – | 1 | – | 0 | – |
| Region of residencef | ||||||||||
| Northeast | 3 | 0.4 | 9 | 1.1 | 4 | 0.5 | 11 | 1.2 | 6 | 0.6 |
| Midwest | 1 | 0.1 | 1 | 0.1 | 0 | 0.0 | 1 | 0.1 | 2 | 0.2 |
| South | 9 | 0.5 | 7 | 0.4 | 11 | 0.6 | 20 | 1.1 | 15 | 0.8 |
| West | 2 | 0.2 | 1 | 0.1 | 1 | 0.1 | 3 | 0.3 | 5 | 0.4 |
| Subtotal, female adult | 15 | 0.3 | 18 | 0.4 | 16 | 0.3 | 35 | 0.7 | 28 | 0.5 |
| Both sexes | ||||||||||
| Race/Ethnicity | ||||||||||
| American Indian/Alaska Native | 0 | 0.0 | 0 | 0.0 | 1 | 2.3 | 0 | 0.0 | 0 | 0.0 |
| Asian | 0 | 0.0 | 1 | 0.3 | 3 | 0.8 | 0 | 0.0 | 4 | 1.0 |
| Black/African American | 31 | 4.5 | 38 | 5.4 | 22 | 3.0 | 39 | 5.1 | 42 | 5.3 |
| Hispanic/Latinob | 12 | 2.0 | 15 | 2.3 | 15 | 2.2 | 23 | 3.3 | 22 | 3.0 |
| Native Hawaiian/other Pacific Islander | 0 | 0.0 | 0 | 0.0 | 0 | 0.0 | 0 | 0.0 | 0 | 0.0 |
| White | 40 | 0.6 | 25 | 0.4 | 25 | 0.4 | 24 | 0.4 | 24 | 0.3 |
| Multiple races | 3 | 5.6 | 3 | 5.3 | 2 | 3.4 | 2 | 3.2 | 1 | 1.5 |
| Region of residencef | ||||||||||
| Northeast | 25 | 1.7 | 23 | 1.6 | 15 | 1.0 | 22 | 1.4 | 18 | 1.1 |
| Midwest | 5 | 0.3 | 5 | 0.3 | 2 | 0.1 | 6 | 0.3 | 11 | 0.6 |
| South | 41 | 1.4 | 40 | 1.3 | 33 | 1.0 | 45 | 1.3 | 44 | 1.2 |
| West | 15 | 0.9 | 14 | 0.8 | 18 | 1.0 | 15 | 0.8 | 20 | 1.0 |
| Total | 86 | 1.1 | 82 | 1.0 | 68 | 0.8 | 88 | 1.0 | 93 | 1.0 |
80–84
| Aged 80–84 Years of Age at Diagnosis | ||||||||||
|---|---|---|---|---|---|---|---|---|---|---|
| 2014 | 2015 | 2016 | 2017 | 2018 | ||||||
| No. | Ratea | No. | Ratea | No. | Ratea | No. | Ratea | No. | Ratea | |
| Male adult | ||||||||||
| Race/Ethnicity | ||||||||||
| American Indian/Alaska Native | 0 | 0.0 | 0 | 0.0 | 0 | 0.0 | 0 | 0.0 | 0 | 0.0 |
| Asian | 1 | 1.1 | 1 | 1.1 | 0 | 0.0 | 0 | 0.0 | 2 | 1.7 |
| Black/African American | 15 | 9.2 | 4 | 2.4 | 8 | 4.5 | 9 | 4.9 | 11 | 5.8 |
| Hispanic/Latinob | 5 | 3.0 | 4 | 2.3 | 2 | 1.1 | 4 | 2.1 | 4 | 2.0 |
| Native Hawaiian/other Pacific Islander | 0 | 0.0 | 0 | 0.0 | 0 | 0.0 | 0 | 0.0 | 0 | 0.0 |
| White | 3 | 0.2 | 7 | 0.4 | 7 | 0.4 | 12 | 0.6 | 7 | 0.3 |
| Multiple races | 1 | 6.9 | 0 | 0.0 | 0 | 0.0 | 0 | 0.0 | 0 | 0.0 |
| Transmission Categoryc | ||||||||||
| Male-to-male sexual contact | 8 | – | 7 | – | 8 | – | 10 | – | 8 | – |
| Injection drug use | 3 | – | 1 | – | 1 | – | 3 | – | 3 | – |
| Male-to-male sexual contact and injection drug use | 0 | – | 0 | – | 0 | – | 0 | – | 1 | – |
| Heterosexual contactd | 14 | – | 8 | – | 7 | – | 12 | – | 12 | – |
| Othere | 0 | – | 0 | – | 1 | – | 1 | – | 0 | – |
| Region of residencef | ||||||||||
| Northeast | 7 | 1.5 | 5 | 1.1 | 5 | 1.1 | 7 | 1.5 | 5 | 1.1 |
| Midwest | 0 | 0.0 | 0 | 0.0 | 1 | 0.2 | 3 | 0.6 | 1 | 0.2 |
| South | 17 | 1.9 | 8 | 0.9 | 9 | 1.0 | 12 | 1.3 | 13 | 1.3 |
| West | 1 | 0.2 | 3 | 0.6 | 2 | 0.4 | 3 | 0.5 | 5 | 0.9 |
| Subtotal, male adult | 25 | 1.1 | 16 | 0.7 | 17 | 0.7 | 25 | 1.0 | 24 | 0.9 |
| Female adult | ||||||||||
| Race/Ethnicity | ||||||||||
| American Indian/Alaska Native | 0 | 0.0 | 0 | 0.0 | 0 | 0.0 | 0 | 0.0 | 0 | 0.0 |
| Asian | 0 | 0.0 | 0 | 0.0 | 0 | 0.0 | 0 | 0.0 | 0 | 0.0 |
| Black/African American | 2 | 0.7 | 7 | 2.3 | 5 | 1.6 | 6 | 1.9 | 6 | 1.8 |
| Hispanic/Latinob | 1 | 0.4 | 1 | 0.4 | 2 | 0.7 | 2 | 0.7 | 1 | 0.3 |
| Native Hawaiian/other Pacific Islander | 0 | 0.0 | 0 | 0.0 | 0 | 0.0 | 0 | 0.0 | 0 | 0.0 |
| White | 0 | 0.0 | 4 | 0.2 | 2 | 0.1 | 0 | 0.0 | 2 | 0.1 |
| Multiple races | 0 | 0.0 | 0 | 0.0 | 0 | 0.0 | 0 | 0.0 | 0 | 0.0 |
| Transmission Categoryc | ||||||||||
| Injection drug use | 1 | – | 2 | – | 0 | – | 1 | – | 1 | – |
| Heterosexual contactd | 2 | – | 9 | – | 9 | – | 7 | – | 7 | – |
| Othere | 0 | – | 1 | – | 0 | – | 0 | – | 1 | – |
| Region of residencef | ||||||||||
| Northeast | 2 | 0.3 | 3 | 0.4 | 2 | 0.3 | 2 | 0.3 | 2 | 0.3 |
| Midwest | 0 | 0.0 | 1 | 0.1 | 2 | 0.3 | 0 | 0.0 | 1 | 0.1 |
| South | 0 | 0.0 | 7 | 0.6 | 5 | 0.4 | 6 | 0.5 | 4 | 0.3 |
| West | 1 | 0.1 | 1 | 0.1 | 0 | 0.0 | 0 | 0.0 | 2 | 0.3 |
| Subtotal, female adult | 3 | 0.1 | 12 | 0.4 | 9 | 0.3 | 8 | 0.2 | 9 | 0.3 |
| Both sexes | ||||||||||
| Race/Ethnicity | ||||||||||
| American Indian/Alaska Native | 0 | 0.0 | 0 | 0.0 | 0 | 0.0 | 0 | 0.0 | 0 | 0.0 |
| Asian | 1 | 0.5 | 1 | 0.4 | 0 | 0.0 | 0 | 0.0 | 2 | 0.7 |
| Black/African American | 17 | 3.7 | 11 | 2.4 | 13 | 2.7 | 15 | 3.0 | 17 | 3.3 |
| Hispanic/Latinob | 6 | 1.4 | 5 | 1.2 | 4 | 0.9 | 6 | 1.3 | 5 | 1.0 |
| Native Hawaiian/other Pacific Islander | 0 | 0.0 | 0 | 0.0 | 0 | 0.0 | 0 | 0.0 | 0 | 0.0 |
| White | 3 | 0.1 | 11 | 0.2 | 9 | 0.2 | 12 | 0.3 | 9 | 0.2 |
| Multiple races | 1 | 2.8 | 0 | 0.0 | 0 | 0.0 | 0 | 0.0 | 0 | 0.0 |
| Region of residencef | ||||||||||
| Northeast | 9 | 0.8 | 8 | 0.7 | 7 | 0.6 | 9 | 0.8 | 7 | 0.6 |
| Midwest | 0 | 0.0 | 1 | 0.1 | 3 | 0.2 | 3 | 0.2 | 2 | 0.2 |
| South | 17 | 0.8 | 15 | 0.7 | 14 | 0.6 | 18 | 0.8 | 17 | 0.7 |
| West | 2 | 0.2 | 4 | 0.3 | 2 | 0.2 | 3 | 0.2 | 7 | 0.5 |
| Total | 28 | 0.5 | 28 | 0.5 | 26 | 0.4 | 33 | 0.6 | 33 | 0.5 |
85+
| Aged 85+ Years of Age at Diagnosis | ||||||||||
|---|---|---|---|---|---|---|---|---|---|---|
| 2014 | 2015 | 2016 | 2017 | 2018 | ||||||
| No. | Ratea | No. | Ratea | No. | Ratea | No. | Ratea | No. | Ratea | |
| Male adult | ||||||||||
| Race/Ethnicity | ||||||||||
| American Indian/Alaska Native | 0 | 0.0 | 0 | 0.0 | 0 | 0.0 | 0 | 0.0 | 0 | 0.0 |
| Asian | 0 | 0.0 | 0 | 0.0 | 0 | 0.0 | 0 | 0.0 | 0 | 0.0 |
| Black/African American | 2 | 1.5 | 2 | 1.5 | 3 | 2.1 | 4 | 2.8 | 4 | 2.6 |
| Hispanic/Latinob | 0 | 0.0 | 2 | 1.3 | 1 | 0.6 | 1 | 0.6 | 0 | 0.0 |
| Native Hawaiian/other Pacific Islander | 0 | 0.0 | 0 | 0.0 | 0 | 0.0 | 0 | 0.0 | 0 | 0.0 |
| White | 1 | 0.1 | 2 | 0.1 | 0 | 0.0 | 0 | 0.0 | 5 | 0.3 |
| Multiple races | 0 | 0.0 | 0 | 0.0 | 0 | 0.0 | 0 | 0.0 | 1 | 6.7 |
| Transmission Categoryc | ||||||||||
| Male-to-male sexual contact | 1 | – | 3 | – | 1 | – | 0 | – | 3 | – |
| Injection drug use | 0 | – | 2 | – | 1 | – | 1 | – | 2 | – |
| Male-to-male sexual contact and injection drug use | 0 | – | 0 | – | 0 | – | 0 | – | 0 | – |
| Heterosexual contactd | 1 | – | 1 | – | 2 | – | 4 | – | 4 | – |
| Othere | 0 | – | 1 | – | 0 | – | 0 | – | 1 | – |
| Region of residencef | ||||||||||
| Northeast | 1 | 0.2 | 1 | 0.2 | 2 | 0.4 | 2 | 0.4 | 4 | 0.9 |
| Midwest | 0 | 0.0 | 1 | 0.2 | 0 | 0.0 | 0 | 0.0 | 1 | 0.2 |
| South | 2 | 0.3 | 2 | 0.3 | 2 | 0.3 | 3 | 0.4 | 3 | 0.4 |
| West | 0 | 0.0 | 2 | 0.4 | 0 | 0.0 | 0 | 0.0 | 2 | 0.4 |
| Subtotal, male adult | 3 | 0.1 | 6 | 0.3 | 4 | 0.2 | 5 | 0.2 | 10 | 0.4 |
| Female adult | ||||||||||
| Race/Ethnicity | ||||||||||
| American Indian/Alaska Native | 0 | 0.0 | 0 | 0.0 | 0 | 0.0 | 0 | 0.0 | 0 | 0.0 |
| Asian | 0 | 0.0 | 0 | 0.0 | 0 | 0.0 | 0 | 0.0 | 0 | 0.0 |
| Black/African American | 4 | 1.3 | 0 | 0.0 | 3 | 0.9 | 3 | 0.9 | 2 | 0.6 |
| Hispanic/Latinob | 0 | 0.0 | 0 | 0.0 | 1 | 0.4 | 0 | 0.0 | 0 | 0.0 |
| Native Hawaiian/other Pacific Islander | 0 | 0.0 | 0 | 0.0 | 0 | 0.0 | 0 | 0.0 | 0 | 0.0 |
| White | 1 | 0.0 | 0 | 0.0 | 2 | 0.1 | 0 | 0.0 | 2 | 0.1 |
| Multiple races | 0 | 0.0 | 0 | 0.0 | 0 | 0.0 | 0 | 0.0 | 0 | 0.0 |
| Transmission Categoryc | ||||||||||
| Injection drug use | 1 | – | 0 | – | 2 | – | 0 | – | 1 | – |
| Heterosexual contactd | 4 | – | 0 | – | 4 | – | 3 | – | 3 | – |
| Othere | 0 | – | 0 | – | 0 | – | 0 | – | 0 | – |
| Region of residencef | ||||||||||
| Northeast | 1 | 0.1 | 0 | 0.0 | 3 | 0.3 | 2 | 0.2 | 0 | 0.0 |
| Midwest | 1 | 0.1 | 0 | 0.0 | 0 | 0.0 | 0 | 0.0 | 1 | 0.1 |
| South | 3 | 0.2 | 0 | 0.0 | 2 | 0.1 | 1 | 0.1 | 3 | 0.2 |
| West | 0 | 0.0 | 0 | 0.0 | 1 | 0.1 | 0 | 0.0 | 0 | 0.0 |
| Subtotal, female adult | 5 | 0.1 | 0 | 0.0 | 6 | 0.1 | 3 | 0.1 | 4 | 0.1 |
| Both sexes | ||||||||||
| Race/Ethnicity | ||||||||||
| American Indian/Alaska Native | 0 | 0.0 | 0 | 0.0 | 0 | 0.0 | 0 | 0.0 | 0 | 0.0 |
| Asian | 0 | 0.0 | 0 | 0.0 | 0 | 0.0 | 0 | 0.0 | 0 | 0.0 |
| Black/African American | 6 | 1.4 | 2 | 0.4 | 6 | 1.3 | 7 | 1.4 | 6 | 1.2 |
| Hispanic/Latinob | 0 | 0.0 | 2 | 0.5 | 2 | 0.4 | 1 | 0.2 | 0 | 0.0 |
| Native Hawaiian/other Pacific Islander | 0 | 0.0 | 0 | 0.0 | 0 | 0.0 | 0 | 0.0 | 0 | 0.0 |
| White | 2 | 0.0 | 2 | 0.0 | 2 | 0.0 | 0 | 0.0 | 7 | 0.1 |
| Multiple races | 0 | 0.0 | 0 | 0.0 | 0 | 0.0 | 0 | 0.0 | 1 | 2.5 |
| Region of residencef | ||||||||||
| Northeast | 2 | 0.2 | 1 | 0.1 | 5 | 0.4 | 4 | 0.3 | 4 | 0.3 |
| Midwest | 1 | 0.1 | 1 | 0.1 | 0 | 0.0 | 0 | 0.0 | 2 | 0.1 |
| South | 5 | 0.2 | 2 | 0.1 | 4 | 0.2 | 4 | 0.2 | 6 | 0.3 |
| West | 0 | 0.0 | 2 | 0.1 | 1 | 0.1 | 0 | 0.0 | 2 | 0.1 |
| Total | 8 | 0.1 | 6 | 0.1 | 10 | 0.2 | 8 | 0.1 | 14 | 0.2 |
Note. Numbers less than 12, and rates and trends based on these numbers, should be interpreted with caution.
aRates are per 100,000 population. Rates are not calculated by transmission category because of the lack of denominator data.
bHispanics/Latinos can be of any race.
cData have been statistically adjusted to account for missing transmission category; therefore, values may not sum to the column subtotals and total.
dHeterosexual contact with a person known to have, or to be at high risk for, HIV infection.
eIncludes hemophilia, blood transfusion, and risk factor not reported or not identified.
fData are based on residence at time of diagnosis of HIV infection.
50–54
| Aged 50–54 Years of Age at Diagnosis | ||||||||||
|---|---|---|---|---|---|---|---|---|---|---|
| 2014 | 2015 | 2016 | 2017 | 2018 | ||||||
| No. | Ratea | No. | Ratea | No. | Ratea | No. | Ratea | No. | Ratea | |
| Male adult | ||||||||||
| Race/Ethnicity | ||||||||||
| American Indian/Alaska Native | 13 | – | 8 | – | 7 | – | 11 | – | 13 | – |
| Asian | 43 | – | 45 | – | 40 | – | 39 | – | 30 | – |
| Black/African American | 673 | – | 703 | – | 668 | – | 611 | – | 590 | – |
| Hispanic/Latinob | 438 | – | 507 | – | 501 | – | 479 | – | 496 | – |
| Native Hawaiian/other Pacific Islander | 1 | – | 7 | – | 2 | – | 3 | – | 1 | – |
| White | 982 | – | 964 | – | 908 | – | 832 | – | 681 | – |
| Multiple races | 76 | – | 61 | – | 55 | – | 54 | – | 42 | – |
| Transmission Categoryc | ||||||||||
| Male-to-male sexual contact | 1,536 | – | 1,623 | – | 1,555 | – | 1,475 | – | 1,272 | – |
| Injection drug use | 165 | – | 172 | – | 162 | – | 139 | – | 153 | – |
| Male-to-male sexual contact and injection drug use | 92 | – | 92 | – | 78 | – | 81 | – | 80 | – |
| Heterosexual contactd | 431 | – | 408 | – | 384 | – | 332 | – | 346 | – |
| Othere | 1 | – | 1 | – | 1 | – | 1 | – | 2 | – |
| Region of residencef | ||||||||||
| Northeast | 424 | 20.7 | 391 | 19.3 | 351 | 17.8 | 322 | 16.7 | 299 | 15.9 |
| Midwest | 255 | 10.6 | 294 | 12.4 | 286 | 12.5 | 261 | 11.8 | 264 | 12.3 |
| South | 1,053 | 25.8 | 1,054 | 25.9 | 1,005 | 25.1 | 944 | 23.9 | 904 | 23.3 |
| West | 461 | 18.4 | 513 | 20.7 | 502 | 20.6 | 463 | 19.3 | 346 | 14.6 |
| U.S. dependent areas | 33 | 27.0 | 43 | 35.5 | 37 | 30.8 | 39 | 33.0 | 40 | 35.0 |
| Subtotal, male adult | 2,226 | 19.9 | 2,295 | 20.8 | 2,181 | 20.1 | 2,029 | 19.1 | 1,853 | 17.8 |
| Female adult | ||||||||||
| Race/Ethnicity | ||||||||||
| American Indian/Alaska Native | 5 | – | 4 | – | 5 | – | 7 | – | 3 | – |
| Asian | 8 | – | 8 | – | 10 | – | 15 | – | 9 | – |
| Black/African American | 415 | – | 432 | – | 439 | – | 385 | – | 374 | – |
| Hispanic/Latinob | 119 | – | 144 | – | 123 | – | 109 | – | 136 | – |
| Native Hawaiian/other Pacific Islander | 1 | – | 1 | – | 4 | – | 0 | – | 1 | – |
| White | 135 | – | 147 | – | 140 | – | 142 | – | 141 | – |
| Multiple races | 22 | – | 25 | – | 18 | – | 16 | – | 11 | – |
| Transmission Categoryc | ||||||||||
| Injection drug use | 101 | – | 103 | – | 119 | – | 99 | – | 95 | – |
| Heterosexual contactd | 603 | – | 657 | – | 619 | – | 575 | – | 579 | – |
| Othere | 1 | – | 0 | – | 1 | – | 0 | – | 1 | – |
| Region of residencef | ||||||||||
| Northeast | 149 | 6.9 | 173 | 8.1 | 161 | 7.7 | 150 | 7.4 | 136 | 6.9 |
| Midwest | 60 | 2.4 | 73 | 3.0 | 68 | 2.9 | 64 | 2.8 | 59 | 2.7 |
| South | 384 | 9.0 | 414 | 9.7 | 399 | 9.5 | 360 | 8.7 | 384 | 9.5 |
| West | 99 | 3.9 | 86 | 3.4 | 103 | 4.2 | 88 | 3.6 | 84 | 3.5 |
| U.S. dependent areas | 13 | 9.3 | 15 | 10.8 | 8 | 5.8 | 12 | 8.9 | 12 | 9.3 |
| Subtotal, female adult | 705 | 6.1 | 761 | 6.6 | 739 | 6.6 | 674 | 6.1 | 675 | 6.3 |
| Both sexes | ||||||||||
| Race/Ethnicity | ||||||||||
| American Indian/Alaska Native | 18 | – | 12 | – | 12 | – | 18 | – | 16 | – |
| Asian | 51 | – | 53 | – | 50 | – | 54 | – | 39 | – |
| Black/African American | 1,088 | – | 1,135 | – | 1,107 | – | 996 | – | 964 | – |
| Hispanic/Latinob | 557 | – | 651 | – | 624 | – | 588 | – | 632 | – |
| Native Hawaiian/other Pacific Islander | 2 | – | 8 | – | 6 | – | 3 | – | 2 | – |
| White | 1,117 | – | 1,111 | – | 1,048 | – | 974 | – | 822 | – |
| Multiple races | 98 | – | 86 | – | 73 | – | 70 | – | 53 | – |
| Region of residencef | ||||||||||
| Northeast | 573 | 13.6 | 564 | 13.6 | 512 | 12.6 | 472 | 11.9 | 435 | 11.3 |
| Midwest | 315 | 6.4 | 367 | 7.7 | 354 | 7.7 | 325 | 7.3 | 323 | 7.4 |
| South | 1,437 | 17.2 | 1,468 | 17.6 | 1,404 | 17.1 | 1,304 | 16.1 | 1,288 | 16.2 |
| West | 560 | 11.1 | 599 | 12.0 | 605 | 12.3 | 551 | 11.4 | 430 | 9.0 |
| U.S. dependent areas | 46 | 17.6 | 58 | 22.3 | 45 | 17.5 | 51 | 20.2 | 52 | 21.4 |
| Total | 2,931 | 12.9 | 3,056 | 13.6 | 2,920 | 13.2 | 2,703 | 12.5 | 2,528 | 12.0 |
55–59
| Aged 55–59 Years of Age at Diagnosis | ||||||||||
|---|---|---|---|---|---|---|---|---|---|---|
| 2014 | 2015 | 2016 | 2017 | 2018 | ||||||
| No. | Ratea | No. | Ratea | No. | Ratea | No. | Ratea | No. | Ratea | |
| Male adult | ||||||||||
| Race/Ethnicity | ||||||||||
| American Indian/Alaska Native | 3 | – | 6 | – | 6 | – | 3 | – | 5 | – |
| Asian | 13 | – | 20 | – | 25 | – | 22 | – | 21 | – |
| Black/African American | 517 | – | 492 | – | 456 | – | 470 | – | 433 | – |
| Hispanic/Latinob | 244 | – | 269 | – | 260 | – | 258 | – | 287 | – |
| Native Hawaiian/other Pacific Islander | 0 | – | 3 | – | 1 | – | 1 | – | 5 | – |
| White | 549 | – | 538 | – | 569 | – | 550 | – | 552 | – |
| Multiple races | 40 | – | 40 | – | 42 | – | 31 | – | 16 | – |
| Transmission Categoryc | ||||||||||
| Male-to-male sexual contact | 862 | – | 857 | – | 904 | – | 878 | – | 891 | – |
| Injection drug use | 141 | – | 134 | – | 114 | – | 123 | – | 115 | – |
| Male-to-male sexual contact and injection drug use | 49 | – | 55 | – | 49 | – | 46 | – | 41 | – |
| Heterosexual contactd | 312 | – | 319 | – | 290 | – | 286 | – | 268 | – |
| Othere | 2 | – | 2 | – | 2 | – | 2 | – | 4 | – |
| Region of residencef | ||||||||||
| Northeast | 277 | 14.2 | 282 | 14.3 | 226 | 11.4 | 202 | 10.3 | 234 | 12.0 |
| Midwest | 162 | 6.9 | 155 | 6.6 | 187 | 7.9 | 171 | 7.3 | 148 | 6.4 |
| South | 637 | 16.8 | 650 | 16.9 | 628 | 16.1 | 652 | 16.6 | 644 | 16.2 |
| West | 259 | 11.0 | 260 | 10.9 | 282 | 11.7 | 287 | 11.9 | 273 | 11.3 |
| U.S. dependent areas | 31 | 27.0 | 21 | 18.3 | 36 | 31.4 | 23 | 20.2 | 20 | 17.7 |
| Subtotal, male adult | 1,366 | 13.0 | 1,368 | 12.8 | 1,359 | 12.6 | 1,335 | 12.4 | 1,319 | 12.2 |
| Female adult | ||||||||||
| Race/Ethnicity | ||||||||||
| American Indian/Alaska Native | 3 | – | 4 | – | 2 | – | 2 | – | 3 | – |
| Asian | 10 | – | 4 | – | 8 | – | 8 | – | 9 | – |
| Black/African American | 377 | – | 321 | – | 347 | – | 334 | – | 343 | – |
| Hispanic/Latinob | 102 | – | 80 | – | 97 | – | 86 | – | 91 | – |
| Native Hawaiian/other Pacific Islander | 1 | – | 1 | – | 0 | – | 1 | – | 1 | – |
| White | 96 | – | 115 | – | 112 | – | 132 | – | 102 | – |
| Multiple races | 13 | – | 22 | – | 19 | – | 13 | – | 9 | – |
| Transmission Categoryc | ||||||||||
| Injection drug use | 88 | – | 77 | – | 80 | – | 75 | – | 76 | – |
| Heterosexual contactd | 513 | – | 469 | – | 505 | – | 500 | – | 481 | – |
| Othere | 1 | – | 1 | – | 1 | – | 1 | – | 1 | – |
| Region of residencef | ||||||||||
| Northeast | 137 | 6.6 | 111 | 5.3 | 119 | 5.7 | 117 | 5.6 | 113 | 5.4 |
| Midwest | 62 | 2.5 | 59 | 2.4 | 65 | 2.6 | 75 | 3.1 | 57 | 2.4 |
| South | 320 | 7.8 | 303 | 7.3 | 305 | 7.3 | 294 | 7.0 | 300 | 7.1 |
| West | 69 | 2.8 | 63 | 2.5 | 82 | 3.3 | 79 | 3.1 | 80 | 3.2 |
| U.S. dependent areas | 14 | 10.5 | 11 | 8.2 | 14 | 10.6 | 11 | 8.4 | 8 | 6.1 |
| Subtotal, female adult | 602 | 5.4 | 547 | 4.8 | 585 | 5.1 | 576 | 5.0 | 558 | 4.9 |
| Both sexes | ||||||||||
| Race/Ethnicity | ||||||||||
| American Indian/Alaska Native | 6 | – | 10 | – | 8 | – | 5 | – | 8 | – |
| Asian | 23 | – | 24 | – | 33 | – | 30 | – | 30 | – |
| Black/African American | 894 | – | 813 | – | 803 | – | 804 | – | 776 | – |
| Hispanic/Latinob | 346 | – | 349 | – | 357 | – | 344 | – | 378 | – |
| Native Hawaiian/other Pacific Islander | 1 | – | 4 | – | 1 | – | 2 | – | 6 | – |
| White | 645 | – | 653 | – | 681 | – | 682 | – | 654 | – |
| Multiple races | 53 | – | 62 | – | 61 | – | 44 | – | 25 | – |
| Region of residencef | ||||||||||
| Northeast | 414 | 10.3 | 393 | 9.7 | 345 | 8.5 | 319 | 7.9 | 347 | 8.6 |
| Midwest | 224 | 4.7 | 214 | 4.4 | 252 | 5.2 | 246 | 5.1 | 205 | 4.3 |
| South | 957 | 12.2 | 953 | 11.9 | 933 | 11.5 | 946 | 11.6 | 944 | 11.5 |
| West | 328 | 6.8 | 323 | 6.6 | 364 | 7.4 | 366 | 7.4 | 353 | 7.1 |
| U.S. dependent areas | 45 | 18.1 | 32 | 12.9 | 50 | 20.2 | 34 | 13.9 | 28 | 11.5 |
| Total | 1,968 | 9.1 | 1,915 | 8.7 | 1,944 | 8.8 | 1,911 | 8.6 | 1,877 | 8.5 |
60–64
| Aged 60–64 Years of Age at Diagnosis | ||||||||||
|---|---|---|---|---|---|---|---|---|---|---|
| 2014 | 2015 | 2016 | 2017 | 2018 | ||||||
| No. | Ratea | No. | Ratea | No. | Ratea | No. | Ratea | No. | Ratea | |
| Male adult | ||||||||||
| Race/Ethnicity | ||||||||||
| American Indian/Alaska Native | 0 | – | 0 | – | 4 | – | 4 | – | 2 | – |
| Asian | 9 | – | 6 | – | 14 | – | 12 | – | 17 | – |
| Black/African American | 267 | – | 254 | – | 272 | – | 281 | – | 250 | – |
| Hispanic/Latinob | 137 | – | 111 | – | 136 | – | 134 | – | 136 | – |
| Native Hawaiian/other Pacific Islander | 2 | – | 0 | – | 0 | – | 0 | – | 1 | – |
| White | 292 | – | 321 | – | 303 | – | 313 | – | 314 | – |
| Multiple races | 16 | – | 22 | – | 25 | – | 20 | – | 12 | – |
| Transmission Categoryc | ||||||||||
| Male-to-male sexual contact | 438 | – | 429 | – | 439 | – | 456 | – | 471 | – |
| Injection drug use | 86 | – | 67 | – | 72 | – | 71 | – | 68 | – |
| Male-to-male sexual contact and injection drug use | 22 | – | 21 | – | 27 | – | 26 | – | 19 | – |
| Heterosexual contactd | 176 | – | 196 | – | 213 | – | 209 | – | 173 | – |
| Othere | 2 | – | 3 | – | 2 | – | 3 | – | 2 | – |
| Region of residencef | ||||||||||
| Northeast | 135 | 8.3 | 119 | 7.1 | 129 | 7.6 | 130 | 7.5 | 129 | 7.3 |
| Midwest | 79 | 4.0 | 82 | 4.0 | 95 | 4.6 | 82 | 3.9 | 87 | 4.0 |
| South | 348 | 10.8 | 364 | 11.0 | 363 | 10.7 | 385 | 11.0 | 345 | 9.6 |
| West | 138 | 6.8 | 135 | 6.5 | 149 | 7.0 | 152 | 7.0 | 156 | 7.1 |
| U.S. dependent areas | 23 | 22.1 | 14 | 13.5 | 18 | 17.2 | 15 | 14.2 | 15 | 14.2 |
| Subtotal, male adult | 723 | 8.1 | 714 | 7.8 | 754 | 8.0 | 764 | 7.9 | 732 | 7.4 |
| Female adult | ||||||||||
| Race/Ethnicity | ||||||||||
| American Indian/Alaska Native | 1 | – | 1 | – | 2 | – | 2 | – | 1 | – |
| Asian | 6 | – | 8 | – | 4 | – | 7 | – | 5 | – |
| Black/African American | 174 | – | 202 | – | 217 | – | 224 | – | 204 | – |
| Hispanic/Latinob | 47 | – | 39 | – | 54 | – | 52 | – | 58 | – |
| Native Hawaiian/other Pacific Islander | 1 | – | 0 | – | 0 | – | 0 | – | 0 | – |
| White | 33 | – | 44 | – | 70 | – | 51 | – | 49 | – |
| Multiple races | 11 | – | 6 | – | 5 | – | 3 | – | 9 | – |
| Transmission Categoryc | ||||||||||
| Injection drug use | 37 | – | 43 | – | 50 | – | 44 | – | 46 | – |
| Heterosexual contactd | 236 | – | 257 | – | 301 | – | 294 | – | 279 | – |
| Othere | 1 | – | 1 | – | 1 | – | 1 | – | 1 | – |
| Region of residencef | ||||||||||
| Northeast | 46 | 2.6 | 79 | 4.3 | 72 | 3.9 | 77 | 4.1 | 74 | 3.8 |
| Midwest | 20 | 0.9 | 28 | 1.3 | 40 | 1.8 | 30 | 1.3 | 24 | 1.0 |
| South | 159 | 4.4 | 154 | 4.2 | 197 | 5.2 | 187 | 4.8 | 176 | 4.4 |
| West | 44 | 2.0 | 38 | 1.7 | 36 | 1.6 | 40 | 1.7 | 48 | 2.0 |
| U.S. dependent areas | 4 | 3.2 | 1 | 0.8 | 7 | 5.6 | 5 | 4.0 | 4 | 3.2 |
| Subtotal, female adult | 273 | 2.8 | 300 | 3.0 | 352 | 3.4 | 339 | 3.2 | 326 | 3.0 |
| Both sexes | ||||||||||
| Race/Ethnicity | ||||||||||
| American Indian/Alaska Native | 1 | – | 1 | – | 6 | – | 6 | – | 3 | – |
| Asian | 15 | – | 14 | – | 18 | – | 19 | – | 22 | – |
| Black/African American | 441 | – | 456 | – | 489 | – | 505 | – | 454 | – |
| Hispanic/Latinob | 184 | – | 150 | – | 190 | – | 186 | – | 194 | – |
| Native Hawaiian/other Pacific Islander | 3 | – | 0 | – | 0 | – | 0 | – | 1 | – |
| White | 325 | – | 365 | – | 373 | – | 364 | – | 363 | – |
| Multiple races | 27 | – | 28 | – | 30 | – | 23 | – | 21 | – |
| Region of residencef | ||||||||||
| Northeast | 181 | 5.3 | 198 | 5.7 | 201 | 5.6 | 207 | 5.7 | 203 | 5.5 |
| Midwest | 99 | 2.4 | 110 | 2.6 | 135 | 3.1 | 112 | 2.6 | 111 | 2.5 |
| South | 507 | 7.4 | 518 | 7.4 | 560 | 7.8 | 572 | 7.7 | 521 | 6.9 |
| West | 182 | 4.3 | 173 | 4.0 | 185 | 4.2 | 192 | 4.2 | 204 | 4.4 |
| U.S. dependent areas | 27 | 11.9 | 15 | 6.6 | 25 | 10.9 | 20 | 8.7 | 19 | 8.3 |
| Total | 996 | 5.3 | 1,014 | 5.3 | 1,106 | 5.6 | 1,103 | 5.5 | 1,058 | 5.1 |
65–69
| Aged 65–69 Years of Age at Diagnosis | ||||||||||
|---|---|---|---|---|---|---|---|---|---|---|
| 2014 | 2015 | 2016 | 2017 | 2018 | ||||||
| No. | Ratea | No. | Ratea | No. | Ratea | No. | Ratea | No. | Ratea | |
| Male adult | ||||||||||
| Race/Ethnicity | ||||||||||
| American Indian/Alaska Native | 0 | – | 0 | – | 1 | – | 2 | – | 2 | – |
| Asian | 11 | – | 7 | – | 9 | – | 6 | – | 8 | – |
| Black/African American | 154 | – | 138 | – | 145 | – | 128 | – | 123 | – |
| Hispanic/Latinob | 65 | – | 79 | – | 74 | – | 81 | – | 70 | – |
| Native Hawaiian/other Pacific Islander | 0 | – | 0 | – | 1 | – | 0 | – | 1 | – |
| White | 160 | – | 155 | – | 187 | – | 149 | – | 149 | – |
| Multiple races | 8 | – | 18 | – | 6 | – | 6 | – | 9 | – |
| Transmission Categoryc | ||||||||||
| Male-to-male sexual contact | 233 | – | 228 | – | 223 | – | 217 | – | 233 | – |
| Injection drug use | 40 | – | 39 | – | 46 | – | 37 | – | 28 | – |
| Male-to-male sexual contact and injection drug use | 9 | – | 11 | – | 12 | – | 11 | – | 10 | – |
| Heterosexual contactd | 114 | – | 118 | – | 140 | – | 105 | – | 91 | – |
| Othere | 2 | – | 2 | – | 3 | – | 2 | – | 1 | – |
| Region of residencef | ||||||||||
| Northeast | 96 | 7.4 | 85 | 6.3 | 79 | 5.6 | 69 | 4.9 | 64 | 4.5 |
| Midwest | 38 | 2.4 | 41 | 2.5 | 45 | 2.6 | 49 | 2.8 | 48 | 2.7 |
| South | 182 | 6.6 | 194 | 6.8 | 201 | 6.7 | 194 | 6.6 | 168 | 5.6 |
| West | 72 | 4.4 | 65 | 3.8 | 83 | 4.6 | 53 | 2.9 | 72 | 3.9 |
| U.S. dependent areas | 10 | 10.3 | 12 | 12.2 | 15 | 15.5 | 7 | 7.4 | 10 | 10.7 |
| Subtotal, male adult | 398 | 5.4 | 397 | 5.2 | 423 | 5.3 | 372 | 4.6 | 362 | 4.5 |
| Female adult | ||||||||||
| Race/Ethnicity | ||||||||||
| American Indian/Alaska Native | 0 | – | 1 | – | 1 | – | 1 | – | 0 | – |
| Asian | 1 | – | 5 | – | 4 | – | 3 | – | 5 | – |
| Black/African American | 103 | – | 105 | – | 99 | – | 115 | – | 83 | – |
| Hispanic/Latinob | 17 | – | 31 | – | 29 | – | 19 | – | 28 | – |
| Native Hawaiian/other Pacific Islander | 0 | – | 0 | – | 0 | – | 0 | – | 0 | – |
| White | 15 | – | 17 | – | 17 | – | 12 | – | 16 | – |
| Multiple races | 3 | – | 3 | – | 6 | – | 3 | – | 8 | – |
| Transmission Categoryc | ||||||||||
| Injection drug use | 22.0 | – | 18 | – | 20 | – | 16 | – | 16 | – |
| Heterosexual contactd | 116.0 | – | 143 | – | 135 | – | 137 | – | 123 | – |
| Othere | 1.0 | – | 1 | – | 0 | – | 0 | – | 1 | – |
| Region of residencef | ||||||||||
| Northeast | 40 | 2.7 | 30 | 1.9 | 36 | 2.2 | 28 | 1.8 | 28 | 1.7 |
| Midwest | 15 | 0.9 | 13 | 0.7 | 13 | 0.7 | 13 | 0.7 | 12 | 0.6 |
| South | 66 | 2.1 | 85 | 2.6 | 91 | 2.7 | 97 | 2.9 | 69 | 2.0 |
| West | 14 | 0.8 | 24 | 1.3 | 14 | 0.7 | 14 | 0.7 | 28 | 1.4 |
| U.S. dependent areas | 4 | 3.5 | 10 | 8.5 | 2 | 1.7 | 1 | 0.9 | 3 | 2.7 |
| Subtotal, female adult | 139 | 1.7 | 162 | 1.9 | 156 | 1.7 | 153 | 1.7 | 140 | 1.5 |
| Both sexes | ||||||||||
| Race/Ethnicity | ||||||||||
| American Indian/Alaska Native | 0 | – | 1 | – | 2 | – | 3 | – | 2 | – |
| Asian | 12 | – | 12 | – | 13 | – | 9 | – | 13 | – |
| Black/African American | 257 | – | 243 | – | 244 | – | 243 | – | 206 | – |
| Hispanic/Latinob | 82 | – | 110 | – | 103 | – | 100 | – | 98 | – |
| Native Hawaiian/other Pacific Islander | 0 | – | 0 | – | 1 | – | 0 | – | 1 | – |
| White | 175 | – | 172 | – | 204 | – | 161 | – | 165 | – |
| Multiple races | 11 | – | 21 | – | 12 | – | 9 | – | 17 | – |
| Region of residencef | ||||||||||
| Northeast | 136 | 4.9 | 115 | 4.0 | 115 | 3.8 | 97 | 3.2 | 92 | 3.0 |
| Midwest | 53 | 1.6 | 54 | 1.6 | 58 | 1.6 | 62 | 1.7 | 60 | 1.6 |
| South | 248 | 4.3 | 279 | 4.6 | 292 | 4.6 | 291 | 4.6 | 237 | 3.7 |
| West | 86 | 2.5 | 89 | 2.5 | 97 | 2.6 | 67 | 1.8 | 100 | 2.6 |
| U.S. dependent areas | 14 | 6.6 | 22 | 10.2 | 17 | 8.0 | 8 | 3.8 | 13 | 6.3 |
| Total | 537 | 3.5 | 559 | 3.4 | 579 | 3.4 | 525 | 3.1 | 502 | 2.9 |
70–74
| Aged 70–74 Years of Age at Diagnosis | ||||||||||
|---|---|---|---|---|---|---|---|---|---|---|
| 2014 | 2015 | 2016 | 2017 | 2018 | ||||||
| No. | Ratea | No. | Ratea | No. | Ratea | No. | Ratea | No. | Ratea | |
| Male adult | ||||||||||
| Race/Ethnicity | ||||||||||
| American Indian/Alaska Native | 1 | – | 0 | – | 1 | – | 1 | – | 1 | – |
| Asian | 3 | – | 1 | – | 7 | – | 5 | – | 3 | – |
| Black/African American | 50 | – | 52 | – | 52 | – | 56 | – | 61 | – |
| Hispanic/Latinob | 26 | – | 34 | – | 26 | – | 25 | – | 38 | – |
| Native Hawaiian/other Pacific Islander | 1 | – | 0 | – | 1 | – | 1 | – | 0 | – |
| White | 61 | – | 70 | – | 54 | – | 64 | – | 75 | – |
| Multiple races | 6 | – | 3 | – | 4 | – | 3 | – | 3 | – |
| Transmission Categoryc | ||||||||||
| Male-to-male sexual contact | 78 | – | 90 | – | 79 | – | 87 | – | 107 | – |
| Injection drug use | 13 | – | 11 | – | 13 | – | 15 | – | 15 | – |
| Male-to-male sexual contact and injection drug use | 1 | – | 2 | – | 5 | – | 2 | – | 1 | – |
| Heterosexual contactd | 54 | – | 55 | – | 46 | – | 49 | – | 57 | – |
| Othere | 2 | – | 2 | – | 2 | – | 2 | – | 2 | – |
| Region of residencef | ||||||||||
| Northeast | 31 | 3.4 | 29 | 3.1 | 29 | 3.0 | 22 | 2.1 | 27 | 2.5 |
| Midwest | 15 | 1.4 | 17 | 1.5 | 9 | 0.8 | 14 | 1.1 | 16 | 1.2 |
| South | 73 | 3.7 | 76 | 3.7 | 81 | 3.8 | 71 | 3.1 | 98 | 4.1 |
| West | 24 | 2.1 | 32 | 2.7 | 23 | 1.9 | 45 | 3.3 | 36 | 2.5 |
| U.S. dependent areas | 5 | 6.8 | 6 | 7.9 | 3 | 3.8 | 3 | 3.7 | 4 | 4.8 |
| Subtotal, male adult | 148 | 2.9 | 160 | 3.0 | 145 | 2.6 | 155 | 2.6 | 181 | 2.9 |
| Female adult | ||||||||||
| Race/Ethnicity | ||||||||||
| American Indian/Alaska Native | 0 | – | 0 | – | 0 | – | 0 | – | 0 | – |
| Asian | 0 | – | 0 | – | 1 | – | 2 | – | 2 | – |
| Black/African American | 27 | – | 28 | – | 26 | – | 43 | – | 43 | – |
| Hispanic/Latinob | 14 | – | 6 | – | 9 | – | 16 | – | 17 | – |
| Native Hawaiian/other Pacific Islander | 0 | – | 0 | – | 0 | – | 0 | – | 0 | – |
| White | 4 | – | 8 | – | 8 | – | 14 | – | 10 | – |
| Multiple races | 2 | – | 2 | – | 2 | – | 1 | – | 2 | – |
| Transmission Categoryc | ||||||||||
| Injection drug use | 8 | – | 5 | – | 7 | – | 8 | – | 8 | – |
| Heterosexual contactd | 39 | – | 39 | – | 39 | – | 68 | – | 66 | – |
| Othere | 1 | – | 0 | – | 0 | – | 1 | – | 0 | – |
| Region of residencef | ||||||||||
| Northeast | 18 | 1.6 | 13 | 1.2 | 13 | 1.1 | 18 | 1.4 | 20 | 1.6 |
| Midwest | 2 | 0.2 | 6 | 0.5 | 0 | 0.0 | 6 | 0.4 | 5 | 0.3 |
| South | 19 | 0.8 | 20 | 0.8 | 24 | 1.0 | 44 | 1.6 | 40 | 1.4 |
| West | 4 | 0.3 | 4 | 0.3 | 9 | 0.6 | 5 | 0.3 | 7 | 0.4 |
| U.S. dependent areas | 4 | 4.5 | 1 | 1.1 | 0 | 0.0 | 3 | 3.0 | 2 | 2.0 |
| Subtotal, female adult | 47 | 0.8 | 44 | 0.7 | 46 | 0.7 | 76 | 1.1 | 74 | 1.0 |
| Both sexes | ||||||||||
| Race/Ethnicity | ||||||||||
| American Indian/Alaska Native | 1 | – | 0 | – | 1 | – | 1 | – | 1 | – |
| Asian | 3 | – | 1 | – | 8 | – | 7 | – | 5 | – |
| Black/African American | 77 | – | 80 | – | 78 | – | 99 | – | 104 | – |
| Hispanic/Latinob | 40 | – | 40 | – | 35 | – | 41 | – | 55 | – |
| Native Hawaiian/other Pacific Islander | 1 | – | 0 | – | 1 | – | 1 | – | 0 | – |
| White | 65 | – | 78 | – | 62 | – | 78 | – | 85 | – |
| Multiple races | 8 | – | 5 | – | 6 | – | 4 | – | 5 | – |
| Region of residencef | ||||||||||
| Northeast | 49 | 2.4 | 42 | 2.0 | 42 | 2.0 | 40 | 1.7 | 47 | 2.0 |
| Midwest | 17 | 0.7 | 23 | 1.0 | 9 | 0.4 | 20 | 0.7 | 21 | 0.8 |
| South | 92 | 2.2 | 96 | 2.2 | 105 | 2.3 | 115 | 2.3 | 138 | 2.6 |
| West | 28 | 1.2 | 36 | 1.4 | 32 | 1.2 | 50 | 1.7 | 43 | 1.4 |
| U.S. dependent areas | 9 | 5.5 | 7 | 4.2 | 3 | 1.7 | 6 | 3.3 | 6 | 3.2 |
| Total | 195 | 1.7 | 204 | 1.8 | 191 | 1.6 | 231 | 1.8 | 255 | 1.9 |
75–79
| Aged 75–79 Years of Age at Diagnosis | ||||||||||
|---|---|---|---|---|---|---|---|---|---|---|
| 2014 | 2015 | 2016 | 2017 | 2018 | ||||||
| No. | Ratea | No. | Ratea | No. | Ratea | No. | Ratea | No. | Ratea | |
| Male adult | ||||||||||
| Race/Ethnicity | ||||||||||
| American Indian/Alaska Native | 0 | – | 0 | – | 1 | – | 0 | – | 0 | – |
| Asian | 0 | – | 1 | – | 3 | – | 0 | – | 4 | – |
| Black/African American | 24 | – | 26 | – | 16 | – | 17 | – | 28 | – |
| Hispanic/Latinob | 9 | – | 13 | – | 11 | – | 19 | – | 13 | – |
| Native Hawaiian/other Pacific Islander | 0 | – | 0 | – | 0 | – | 0 | – | 0 | – |
| White | 37 | – | 23 | – | 22 | – | 20 | – | 21 | – |
| Multiple races | 3 | – | 3 | – | 1 | – | 1 | – | 0 | – |
| Transmission Categoryc | ||||||||||
| Male-to-male sexual contact | 44 | – | 28 | – | 31 | – | 29 | – | 34 | – |
| Injection drug use | 7 | – | 7 | – | 5 | – | 8 | – | 6 | – |
| Male-to-male sexual contact and injection drug use | 0 | – | 1 | – | 1 | – | 1 | – | 1 | – |
| Heterosexual contactd | 21 | – | 30 | – | 16 | – | 18 | – | 25 | – |
| Othere | 1 | – | 1 | – | 1 | – | 2 | – | 1 | – |
| Region of residencef | ||||||||||
| Northeast | 22 | 3.5 | 14 | 2.2 | 11 | 1.7 | 11 | 1.6 | 12 | 1.7 |
| Midwest | 4 | 0.5 | 4 | 0.5 | 2 | 0.3 | 5 | 0.6 | 9 | 1.0 |
| South | 32 | 2.4 | 33 | 2.4 | 22 | 1.5 | 25 | 1.7 | 29 | 1.8 |
| West | 13 | 1.7 | 13 | 1.6 | 17 | 2.0 | 12 | 1.4 | 15 | 1.6 |
| U.S. dependent areas | 2 | 3.8 | 2 | 3.7 | 2 | 3.6 | 4 | 7.0 | 1 | 1.7 |
| Subtotal, male adult | 73 | 2.1 | 66 | 1.8 | 54 | 1.4 | 57 | 1.4 | 66 | 1.6 |
| Female adult | ||||||||||
| Race/Ethnicity | ||||||||||
| American Indian/Alaska Native | 0 | – | 0 | – | 0 | – | 0 | – | 0 | – |
| Asian | 0 | – | 0 | – | 0 | – | 0 | – | 0 | – |
| Black/African American | 7 | – | 12 | – | 6 | – | 22 | – | 14 | – |
| Hispanic/Latinob | 5 | – | 4 | – | 6 | – | 8 | – | 11 | – |
| Native Hawaiian/other Pacific Islander | 0 | – | 0 | – | 0 | – | 0 | – | 0 | – |
| White | 3 | – | 2 | – | 3 | – | 4 | – | 3 | – |
| Multiple races | 0 | – | 0 | – | 1 | – | 1 | – | 1 | – |
| Transmission Categoryc | ||||||||||
| Injection drug use | 2 | – | 2 | – | 1 | – | 4 | – | 2 | – |
| Heterosexual contactd | 13 | – | 16 | – | 15 | – | 31 | – | 26 | – |
| Othere | 0 | – | 0 | – | 0 | – | 1 | – | 0 | – |
| Region of residencef | ||||||||||
| Northeast | 3 | 0.4 | 9 | 1.1 | 4 | 0.5 | 11 | 1.2 | 6 | 0.6 |
| Midwest | 1 | 0.1 | 1 | 0.1 | 0 | 0.0 | 1 | 0.1 | 2 | 0.2 |
| South | 9 | 0.5 | 7 | 0.4 | 11 | 0.6 | 20 | 1.1 | 15 | 0.8 |
| West | 2 | 0.2 | 1 | 0.1 | 1 | 0.1 | 3 | 0.3 | 5 | 0.4 |
| U.S. dependent areas | 0 | 0.0 | 0 | 0.0 | 0 | 0.0 | 0 | 0.0 | 1 | 1.3 |
| Subtotal, female adult | 15 | 0.3 | 18 | 0.4 | 16 | 0.3 | 35 | 0.7 | 29 | 0.6 |
| Both sexes | ||||||||||
| Race/Ethnicity | ||||||||||
| American Indian/Alaska Native | 0 | – | 0 | – | 1 | – | 0 | – | 0 | – |
| Asian | 0 | – | 1 | – | 3 | – | 0 | – | 4 | – |
| Black/African American | 31 | – | 38 | – | 22 | – | 39 | – | 42 | – |
| Hispanic/Latinob | 14 | – | 17 | – | 17 | – | 27 | – | 24 | – |
| Native Hawaiian/other Pacific Islander | 0 | – | 0 | – | 0 | – | 0 | – | 0 | – |
| White | 40 | – | 25 | – | 25 | – | 24 | – | 24 | – |
| Multiple races | 3 | – | 3 | – | 2 | – | 2 | – | 1 | – |
| Region of residencef | ||||||||||
| Northeast | 25 | 1.7 | 23 | 1.6 | 15 | 1.0 | 22 | 1.4 | 18 | 1.1 |
| Midwest | 5 | 0.3 | 5 | 0.3 | 2 | 0.1 | 6 | 0.3 | 11 | 0.6 |
| South | 41 | 1.4 | 40 | 1.3 | 33 | 1.0 | 45 | 1.3 | 44 | 1.2 |
| West | 15 | 0.9 | 14 | 0.8 | 18 | 1.0 | 15 | 0.8 | 20 | 1.0 |
| U.S. dependent areas | 2 | 1.7 | 2 | 1.6 | 2 | 1.6 | 4 | 3.1 | 2 | 1.5 |
| Total | 88 | 1.1 | 84 | 1.0 | 70 | 0.8 | 92 | 1.0 | 95 | 1.0 |
80–84
| Aged 80–84 Years of Age at Diagnosis | ||||||||||
|---|---|---|---|---|---|---|---|---|---|---|
| 2014 | 2015 | 2016 | 2017 | 2018 | ||||||
| No. | Ratea | No. | Ratea | No. | Ratea | No. | Ratea | No. | Ratea | |
| Male adult | ||||||||||
| Race/Ethnicity | ||||||||||
| American Indian/Alaska Native | 0 | – | 0 | – | 0 | – | 0 | – | 0 | – |
| Asian | 1 | – | 1 | – | 0 | – | 0 | – | 2 | – |
| Black/African American | 15 | – | 4 | – | 8 | – | 9 | – | 11 | – |
| Hispanic/Latinob | 5 | – | 4 | – | 3 | – | 6 | – | 4 | – |
| Native Hawaiian/other Pacific Islander | 0 | – | 0 | – | 0 | – | 0 | – | 0 | – |
| White | 3 | – | 7 | – | 7 | – | 12 | – | 7 | – |
| Multiple races | 1 | – | 0 | – | 0 | – | 0 | – | 0 | – |
| Transmission Categoryc | ||||||||||
| Male-to-male sexual contact | 8 | – | 7 | – | 8 | – | 10 | – | 8 | – |
| Injection drug use | 3 | – | 1 | – | 1 | – | 3 | – | 3 | – |
| Male-to-male sexual contact and injection drug use | 0 | – | 0 | – | 0 | – | 0 | – | 1 | – |
| Heterosexual contactd | 14 | – | 8 | – | 8 | – | 14 | – | 12 | – |
| Othere | 0 | – | 0 | – | 1 | – | 1 | – | 0 | – |
| Region of residencef | ||||||||||
| Northeast | 7 | 1.5 | 5 | 1.1 | 5 | 1.1 | 7 | 1.5 | 5 | 1.1 |
| Midwest | 0 | 0.0 | 0 | 0.0 | 1 | 0.2 | 3 | 0.6 | 1 | 0.2 |
| South | 17 | 1.9 | 8 | 0.9 | 9 | 1.0 | 12 | 1.3 | 13 | 1.3 |
| West | 1 | 0.2 | 3 | 0.6 | 2 | 0.4 | 3 | 0.5 | 5 | 0.9 |
| U.S. dependent areas | 0 | 0.0 | 0 | 0.0 | 1 | 2.8 | 2 | 5.4 | 0 | 0.0 |
| Subtotal, male adult | 25 | 1.0 | 16 | 0.7 | 18 | 0.7 | 27 | 1.1 | 24 | 0.9 |
| Female adult | ||||||||||
| Race/Ethnicity | ||||||||||
| American Indian/Alaska Native | 0 | – | 0 | – | 0 | – | 0 | – | 0 | – |
| Asian | 0 | – | 0 | – | 0 | – | 0 | – | 0 | – |
| Black/African American | 2 | – | 7 | – | 5 | – | 6 | – | 6 | – |
| Hispanic/Latinob | 1 | – | 1 | – | 2 | – | 2 | – | 1 | – |
| Native Hawaiian/other Pacific Islander | 0 | – | 0 | – | 0 | – | 0 | – | 0 | – |
| White | 0 | – | 4 | – | 2 | – | 0 | – | 2 | – |
| Multiple races | 0 | – | 0 | – | 0 | – | 0 | – | 0 | – |
| Transmission Categoryc | ||||||||||
| Injection drug use | 1 | – | 2 | – | 0 | – | 1 | – | 1 | – |
| Heterosexual contactd | 2 | – | 9 | – | 9 | – | 7 | – | 7 | – |
| Othere | 0 | – | 1 | – | 0 | – | 0 | – | 1 | – |
| Region of residencef | ||||||||||
| Northeast | 2 | 0.3 | 3 | 0.4 | 2 | 0.3 | 2 | 0.3 | 2 | 0.3 |
| Midwest | 0 | 0.0 | 1 | 0.1 | 2 | 0.3 | 0 | 0.0 | 1 | 0.1 |
| South | 0 | 0.0 | 7 | 0.6 | 5 | 0.4 | 6 | 0.5 | 4 | 0.3 |
| West | 1 | 0.1 | 1 | 0.1 | 0 | 0.0 | 0 | 0.0 | 2 | 0.3 |
| U.S. dependent areas | 0 | 0.0 | 0 | 0.0 | 0 | 0.0 | 0 | 0.0 | 0 | 0.0 |
| Subtotal, female adult | 3 | 0.1 | 12 | 0.3 | 9 | 0.3 | 8 | 0.2 | 9 | 0.3 |
| Both sexes | ||||||||||
| Race/Ethnicity | ||||||||||
| American Indian/Alaska Native | 0 | – | 0 | – | 0 | – | 0 | – | 0 | – |
| Asian | 1 | – | 1 | – | 0 | – | 0 | – | 2 | – |
| Black/African American | 17 | – | 11 | – | 13 | – | 15 | – | 17 | – |
| Hispanic/Latinob | 6 | – | 5 | – | 5 | – | 8 | – | 5 | – |
| Native Hawaiian/other Pacific Islander | 0 | – | 0 | – | 0 | – | 0 | – | 0 | – |
| White | 3 | – | 11 | – | 9 | – | 12 | – | 9 | – |
| Multiple races | 1 | – | 0 | – | 0 | – | 0 | – | 0 | – |
| Region of residencef | ||||||||||
| Northeast | 9 | 0.8 | 8 | 0.7 | 7 | 0.6 | 9 | 0.8 | 7 | 0.6 |
| Midwest | 0 | 0.0 | 1 | 0.1 | 3 | 0.2 | 3 | 0.2 | 2 | 0.2 |
| South | 17 | 0.8 | 15 | 0.7 | 14 | 0.6 | 18 | 0.8 | 17 | 0.7 |
| West | 2 | 0.2 | 4 | 0.3 | 2 | 0.2 | 3 | 0.2 | 7 | 0.5 |
| U.S. dependent areas | 0 | 0.0 | 0 | 0.0 | 1 | 1.2 | 2 | 2.2 | 0 | 0.0 |
| Total | 28 | 0.5 | 28 | 0.5 | 27 | 0.5 | 35 | 0.6 | 33 | 0.5 |
85+
| Aged 85+ Years of Age at Diagnosis | ||||||||||
|---|---|---|---|---|---|---|---|---|---|---|
| 2014 | 2015 | 2016 | 2017 | 2018 | ||||||
| No. | Ratea | No. | Ratea | No. | Ratea | No. | Ratea | No. | Ratea | |
| Male adult | ||||||||||
| Race/Ethnicity | ||||||||||
| American Indian/Alaska Native | 0 | – | 0 | – | 0 | – | 0 | – | 0 | – |
| Asian | 0 | – | 0 | – | 0 | – | 0 | – | 0 | – |
| Black/African American | 2 | – | 2 | – | 3 | – | 4 | – | 4 | – |
| Hispanic/Latinob | 2 | – | 2 | – | 1 | – | 2 | – | 1 | – |
| Native Hawaiian/other Pacific Islander | 0 | – | 0 | – | 0 | – | 0 | – | 0 | – |
| White | 1 | – | 2 | – | 0 | – | 0 | – | 5 | – |
| Multiple races | 0 | – | 0 | – | 0 | – | 0 | – | 1 | – |
| Transmission Categoryc | ||||||||||
| Male-to-male sexual contact | 1 | – | 3 | – | 1 | – | 0 | – | 3 | – |
| Injection drug use | 0 | – | 2 | – | 1 | – | 1 | – | 2 | – |
| Male-to-male sexual contact and injection drug use | 0 | – | 0 | – | 0 | – | 0 | – | 0 | – |
| Heterosexual contactd | 3 | – | 1 | – | 2 | – | 4 | – | 5 | – |
| Othere | 0 | – | 1 | – | 0 | – | 0 | – | 1 | – |
| Region of residencef | ||||||||||
| Northeast | 1 | 0.2 | 1 | 0.2 | 2 | 0.4 | 2 | 0.4 | 4 | 0.9 |
| Midwest | 0 | 0.0 | 1 | 0.2 | 0 | 0.0 | 0 | 0.0 | 1 | 0.2 |
| South | 2 | 0.3 | 2 | 0.3 | 2 | 0.3 | 3 | 0.4 | 3 | 0.4 |
| West | 0 | 0.0 | 2 | 0.4 | 0 | 0.0 | 0 | 0.0 | 2 | 0.4 |
| U.S. dependent areas | 2 | 7.1 | 0 | 0.0 | 0 | 0.0 | 1 | 3.1 | 1 | 3.0 |
| Subtotal, male adult | 5 | 0.2 | 6 | 0.3 | 4 | 0.2 | 6 | 0.3 | 11 | 0.5 |
| Female adult | ||||||||||
| Race/Ethnicity | ||||||||||
| American Indian/Alaska Native | 0 | – | 0 | – | 0 | – | 0 | – | 0 | – |
| Asian | 0 | – | 0 | – | 0 | – | 0 | – | 0 | – |
| Black/African American | 4 | – | 0 | – | 3 | – | 3 | – | 2 | – |
| Hispanic/Latinob | 0 | – | 0 | – | 2 | – | 0 | – | 0 | – |
| Native Hawaiian/other Pacific Islander | 0 | – | 0 | – | 0 | – | 0 | – | 0 | – |
| White | 1 | – | 0 | – | 2 | – | 0 | – | 2 | – |
| Multiple races | 0 | – | 0 | – | 0 | – | 0 | – | 0 | – |
| Transmission Categoryc | ||||||||||
| Injection drug use | 1 | – | 0 | – | 2 | – | 0 | – | 1 | – |
| Heterosexual contactd | 4 | – | 0 | – | 5 | – | 3 | – | 3 | – |
| Othere | 0 | – | 0 | – | 0 | – | 0 | – | 0 | – |
| Region of residencef | ||||||||||
| Northeast | 1 | 0.1 | 0 | 0.0 | 3 | 0.3 | 2 | 0.2 | 0 | 0.0 |
| Midwest | 1 | 0.1 | 0 | 0.0 | 0 | 0.0 | 0 | 0.0 | 1 | 0.1 |
| South | 3 | 0.2 | 0 | 0.0 | 2 | 0.1 | 1 | 0.1 | 3 | 0.2 |
| West | 0 | 0.0 | 0 | 0.0 | 1 | 0.1 | 0 | 0.0 | 0 | 0.0 |
| U.S. dependent areas | 0 | 0.0 | 0 | 0.0 | 1 | 1.9 | 0 | 0.0 | 0 | 0.0 |
| Subtotal, female adult | 5 | 0.1 | 0 | 0.0 | 7 | 0.2 | 3 | 0.1 | 4 | 0.1 |
| Both sexes | ||||||||||
| Race/Ethnicity | ||||||||||
| American Indian/Alaska Native | 0 | – | 0 | – | 0 | – | 0 | – | 0 | – |
| Asian | 0 | – | 0 | – | 0 | – | 0 | – | 0 | – |
| Black/African American | 6 | – | 2 | – | 6 | – | 7 | – | 6 | – |
| Hispanic/Latinob | 2 | – | 2 | – | 3 | – | 2 | – | 1 | – |
| Native Hawaiian/other Pacific Islander | 0 | – | 0 | – | 0 | – | 0 | – | 0 | – |
| White | 2 | – | 2 | – | 2 | – | 0 | – | 7 | – |
| Multiple races | 0 | – | 0 | – | 0 | – | 0 | – | 1 | – |
| Region of residencef | ||||||||||
| Northeast | 2 | 0.2 | 1 | 0.1 | 5 | 0.4 | 4 | 0.3 | 4 | 0.3 |
| Midwest | 1 | 0.1 | 1 | 0.1 | 0 | 0.0 | 0 | 0.0 | 2 | 0.1 |
| South | 5 | 0.2 | 2 | 0.1 | 4 | 0.2 | 4 | 0.2 | 6 | 0.3 |
| West | 0 | 0.0 | 2 | 0.1 | 1 | 0.1 | 0 | 0.0 | 2 | 0.1 |
| U.S. dependent areas | 2 | 2.6 | 0 | 0.0 | 1 | 1.2 | 1 | 1.2 | 1 | 1.1 |
| Total | 10 | 0.2 | 6 | 0.1 | 11 | 0.2 | 9 | 0.1 | 15 | 0.2 |
Note. Numbers less than 12, and rates and trends based on these numbers, should be interpreted with caution.
aRates are per 100,000 population. Rates by race/ethnicity are not provided because U.S. census information for U.S. dependent areas is limited. Rates are not calculated by transmission category because of the lack of denominator data.
bHispanics/Latinos can be of any race.
cData have been statistically adjusted to account for missing transmission category; therefore, values may not sum to the column subtotals and total.
dHeterosexual contact with a person known to have, or to be at high risk for, HIV infection.
eIncludes hemophilia, blood transfusion, and risk factor not reported or not identified.
fData are based on residence at time of diagnosis of HIV infection.
American Indian/Alaska Native
| American Indian/Alaska Native | ||||||||||
|---|---|---|---|---|---|---|---|---|---|---|
| 2014 | 2015 | 2016 | 2017 | 2018 | ||||||
| No. | Ratea | No. | Ratea | No. | Ratea | No. | Ratea | No. | Ratea | |
| Aged 50–64 years of age at diagnosis | ||||||||||
| Male adult | ||||||||||
| Transmission Categoryb | ||||||||||
| Male-to-male sexual contact | 9 | – | 8 | – | 10 | – | 12 | – | 13 | – |
| Injection drug use | 3 | – | 2 | – | 4 | – | 4 | – | 3 | – |
| Male-to-male sexual contact and injection drug use | 2 | – | 0 | – | 2 | – | 1 | – | 1 | – |
| Heterosexual contactc | 1 | – | 3 | – | 2 | – | 1 | – | 3 | – |
| Otherd | 0 | – | 0 | – | 0 | – | 0 | – | 0 | – |
| Region of residencee | ||||||||||
| Northeast | 1 | 7.9 | 1 | 7.8 | 0 | 0.0 | 0 | 0.0 | 1 | 7.7 |
| Midwest | 1 | 2.9 | 2 | 5.7 | 3 | 8.5 | 3 | 8.4 | 4 | 11.2 |
| South | 8 | 11.0 | 4 | 5.4 | 2 | 2.7 | 6 | 8.1 | 5 | 6.8 |
| West | 6 | 7.0 | 7 | 8.1 | 12 | 13.8 | 9 | 10.3 | 10 | 11.4 |
| Subtotal, male aged 50–64 years | 16 | 7.8 | 14 | 6.7 | 17 | 8.1 | 18 | 8.6 | 20 | 9.5 |
| Female adult | ||||||||||
| Transmission Categoryb | ||||||||||
| Injection drug use | 1 | – | 3 | – | 5 | – | 2 | – | 2 | – |
| Heterosexual contactc | 8 | – | 6 | – | 4 | – | 9 | – | 5 | – |
| Otherd | 0 | – | 0 | – | 0 | – | 0 | – | 0 | – |
| Region of residencee | ||||||||||
| Northeast | 0 | 0.0 | 0 | 0.0 | 0 | 0.0 | 0 | 0.0 | 0 | 0.0 |
| Midwest | 1 | 2.7 | 1 | 2.6 | 0 | 0.0 | 1 | 2.6 | 0 | 0.0 |
| South | 2 | 2.5 | 5 | 6.2 | 3 | 3.7 | 0 | 0.0 | 4 | 4.9 |
| West | 6 | 6.2 | 3 | 3.0 | 6 | 6.0 | 10 | 10.0 | 3 | 3.0 |
| Subtotal, female aged 50–64 years | 9 | 4.0 | 9 | 3.9 | 9 | 3.9 | 11 | 4.7 | 7 | 3.0 |
| Aged ≥65 years of age at diagnosis | ||||||||||
| Male adult | ||||||||||
| Transmission Categoryb | ||||||||||
| Male-to-male sexual contact | 1 | – | 0 | – | 1 | – | 1 | – | 3 | – |
| Injection drug use | 0 | – | 0 | – | 0 | – | 1 | – | 0 | – |
| Male-to-male sexual contact and injection drug use | 0 | – | 0 | – | 0 | – | 1 | – | 0 | – |
| Heterosexual contactc | 0 | – | 0 | – | 2 | – | 0 | – | 0 | – |
| Otherd | 0 | – | 0 | – | 0 | – | 0 | – | 0 | – |
| Region of residencee | ||||||||||
| Northeast | 0 | 0.0 | 0 | 0.0 | 0 | 0.0 | 1 | 12.7 | 0 | 0.0 |
| Midwest | 0 | 0.0 | 0 | 0.0 | 0 | 0.0 | 0 | 0.0 | 0 | 0.0 |
| South | 0 | 0.0 | 0 | 0.0 | 1 | 2.2 | 1 | 2.1 | 2 | 4.0 |
| West | 1 | 2.3 | 0 | 0.0 | 2 | 4.2 | 1 | 2.0 | 1 | 1.9 |
| Subtotal, male aged ≥65 years | 1 | 1.0 | 0 | 0.0 | 3 | 2.6 | 3 | 2.4 | 3 | 2.3 |
| Female adult | ||||||||||
| Transmission Categoryb | ||||||||||
| Injection drug use | 0 | – | 0 | – | 0 | – | 1 | – | 0 | – |
| Heterosexual contactc | 0 | – | 1 | – | 1 | – | 0 | – | 0 | – |
| Otherd | 0 | – | 0 | – | 0 | – | 0 | – | 0 | – |
| Region of residencee | ||||||||||
| Northeast | 0 | 0.0 | 0 | 0.0 | 0 | 0.0 | 0 | 0.0 | 0 | 0.0 |
| Midwest | 0 | 0.0 | 0 | 0.0 | 0 | 0.0 | 0 | 0.0 | 0 | 0.0 |
| South | 0 | 0.0 | 0 | 0.0 | 0 | 0.0 | 1 | 1.8 | 0 | 0.0 |
| West | 0 | 0.0 | 1 | 1.7 | 1 | 1.7 | 0 | 0.0 | 0 | 0.0 |
| Subtotal, female aged ≥65 years | 0 | 0.0 | 1 | 0.7 | 1 | 0.7 | 1 | 0.7 | 0 | 0.0 |
| Aged ≥50 years of age at diagnosis | ||||||||||
| Male adult | ||||||||||
| Transmission Categoryb | ||||||||||
| Male-to-male sexual contact | 10 | – | 8 | – | 11 | – | 13 | – | 15 | – |
| Injection drug use | 3 | – | 2 | – | 4 | – | 5 | – | 3 | – |
| Male-to-male sexual contact and injection drug use | 2 | – | 0 | – | 2 | – | 2 | – | 1 | – |
| Heterosexual contactc | 1 | – | 3 | – | 3 | – | 1 | – | 4 | – |
| Otherd | 0 | – | 0 | – | 0 | – | 0 | – | 0 | – |
| Region of residencee | ||||||||||
| Northeast | 1 | 5.2 | 1 | 5.0 | 0 | 0.0 | 1 | 4.8 | 1 | 4.7 |
| Midwest | 1 | 2.0 | 2 | 3.9 | 3 | 5.8 | 3 | 5.6 | 4 | 7.3 |
| South | 8 | 7.1 | 4 | 3.5 | 3 | 2.5 | 7 | 5.8 | 7 | 5.7 |
| West | 7 | 5.5 | 7 | 5.3 | 14 | 10.4 | 10 | 7.3 | 11 | 7.9 |
| Subtotal, male ≥50 years of age | 17 | 5.5 | 14 | 4.4 | 20 | 6.1 | 21 | 6.3 | 23 | 6.8 |
| Female adult | ||||||||||
| Transmission Categoryb | ||||||||||
| Injection drug use | 1 | – | 3 | – | 5 | – | 3 | – | 2 | – |
| Heterosexual contactc | 8 | – | 7 | – | 5 | – | 9 | – | 5 | – |
| Otherd | 0 | – | 0 | – | 0 | – | 0 | – | 0 | – |
| Region of residencee | ||||||||||
| Northeast | 0 | 0.0 | 0 | 0.0 | 0 | 0.0 | 0 | 0.0 | 0 | 0.0 |
| Midwest | 1 | 1.8 | 1 | 1.7 | 0 | 0.0 | 1 | 1.6 | 0 | 0.0 |
| South | 2 | 1.6 | 5 | 3.9 | 3 | 2.3 | 1 | 0.7 | 4 | 2.9 |
| West | 6 | 4.0 | 4 | 2.6 | 7 | 4.4 | 10 | 6.1 | 3 | 1.8 |
| Subtotal, female ≥50 years of age | 9 | 2.5 | 10 | 2.7 | 10 | 2.7 | 12 | 3.1 | 7 | 1.8 |
| Total, ≥50 years of age at diagnosis | 26 | 3.9 | 24 | 3.5 | 30 | 4.3 | 33 | 4.6 | 30 | 4.1 |
Asian
| Asian | ||||||||||
|---|---|---|---|---|---|---|---|---|---|---|
| 2014 | 2015 | 2016 | 2017 | 2018 | ||||||
| No. | Ratea | No. | Ratea | No. | Ratea | No. | Ratea | No. | Ratea | |
| Aged 50–64 years of age at diagnosis | ||||||||||
| Male adult | ||||||||||
| Transmission Categoryb | ||||||||||
| Male-to-male sexual contact | 48 | – | 55 | – | 61 | – | 62 | – | 51 | – |
| Injection drug use | 2 | – | 4 | – | 4 | – | 2 | – | 3 | – |
| Male-to-male sexual contact and injection drug use | 3 | – | 1 | – | 1 | – | 0 | – | 1 | – |
| Heterosexual contactc | 11 | – | 11 | – | 12 | – | 9 | – | 13 | – |
| Otherd | 0 | – | 0 | – | 0 | – | 0 | – | 1 | – |
| Region of residencee | ||||||||||
| Northeast | 18 | 6.3 | 14 | 4.8 | 14 | 4.7 | 14 | 4.6 | 19 | 6.1 |
| Midwest | 3 | 2.3 | 8 | 5.9 | 13 | 9.3 | 3 | 2.1 | 5 | 3.3 |
| South | 11 | 3.9 | 14 | 4.7 | 18 | 5.8 | 14 | 4.3 | 14 | 4.1 |
| West | 32 | 5.0 | 35 | 5.4 | 34 | 5.1 | 42 | 6.2 | 30 | 4.3 |
| Subtotal, male aged 50–64 years | 64 | 4.8 | 71 | 5.2 | 79 | 5.6 | 73 | 5.0 | 68 | 4.6 |
| Female adult | ||||||||||
| Transmission Categoryb | ||||||||||
| Injection drug use | 3 | – | 2 | – | 1 | – | 2 | – | 1 | – |
| Heterosexual contactc | 21 | – | 18 | – | 21 | – | 28 | – | 22 | – |
| Otherd | 0 | – | 0 | – | 0 | – | 1 | – | 0 | – |
| Region of residencee | ||||||||||
| Northeast | 1 | 0.3 | 5 | 1.5 | 5 | 1.5 | 6 | 1.8 | 11 | 3.1 |
| Midwest | 4 | 2.6 | 3 | 1.9 | 1 | 0.6 | 2 | 1.2 | 0 | 0.0 |
| South | 4 | 1.2 | 4 | 1.1 | 4 | 1.1 | 8 | 2.1 | 7 | 1.8 |
| West | 15 | 1.9 | 8 | 1.0 | 12 | 1.5 | 14 | 1.7 | 5 | 0.6 |
| Subtotal, female adult aged 50–64 years | 24 | 1.5 | 20 | 1.2 | 22 | 1.3 | 30 | 1.7 | 23 | 1.3 |
| Aged ≥65 years of age at diagnosis | ||||||||||
| Male adult | ||||||||||
| Transmission Categoryb | ||||||||||
| Male-to-male sexual contact | 8 | – | 5 | – | 10 | – | 8 | – | 10 | – |
| Injection drug use | 1 | – | 1 | – | 1 | – | 0 | – | 1 | – |
| Male-to-male sexual contact and injection drug use | 0 | – | 0 | – | 1 | – | 0 | – | 0 | – |
| Heterosexual contactc | 6 | – | 4 | – | 6 | – | 2 | – | 6 | – |
| Otherd | 0 | – | 0 | – | 1 | – | 1 | – | 0 | – |
| Region of residencee | ||||||||||
| Northeast | 5 | 3.2 | 3 | 1.8 | 6 | 3.4 | 1 | 0.5 | 4 | 2.0 |
| Midwest | 2 | 2.8 | 0 | 0.0 | 3 | 3.6 | 2 | 2.3 | 0 | 0.0 |
| South | 1 | 0.7 | 1 | 0.6 | 3 | 1.7 | 4 | 2.1 | 4 | 2.0 |
| West | 7 | 1.7 | 6 | 1.3 | 7 | 1.5 | 4 | 0.8 | 9 | 1.7 |
| Subtotal, male aged ≥65 years | 15 | 1.9 | 10 | 1.2 | 19 | 2.1 | 11 | 1.1 | 17 | 1.7 |
| Female adult | ||||||||||
| Transmission Categoryb | ||||||||||
| Injection drug use | 0 | – | 0 | – | 0 | – | 0 | – | 0 | – |
| Heterosexual contactc | 1 | – | 4 | – | 5 | – | 5 | – | 7 | – |
| Otherd | 0 | – | 1 | – | 0 | – | 0 | – | 0 | – |
| Region of residencee | ||||||||||
| Northeast | 1 | 0.5 | 0 | 0.0 | 2 | 0.9 | 1 | 0.4 | 2 | 0.8 |
| Midwest | 0 | 0.0 | 0 | 0.0 | 1 | 0.9 | 1 | 0.9 | 0 | 0.0 |
| South | 0 | 0.0 | 2 | 0.9 | 0 | 0.0 | 2 | 0.8 | 2 | 0.7 |
| West | 0 | 0.0 | 3 | 0.5 | 2 | 0.3 | 1 | 0.1 | 3 | 0.4 |
| Subtotal, female aged ≥65 years | 1 | 0.1 | 5 | 0.4 | 5 | 0.4 | 5 | 0.4 | 7 | 0.5 |
| Aged ≥50 years of age at diagnosis | ||||||||||
| Male adult | ||||||||||
| Transmission Categoryb | ||||||||||
| Male-to-male sexual contact | 56 | – | 60 | – | 72 | – | 70 | – | 61 | – |
| Injection drug use | 3 | – | 5 | – | 5 | – | 2 | – | 4 | – |
| Male-to-male sexual contact and injection drug use | 3 | – | 1 | – | 2 | – | 0 | – | 1 | – |
| Heterosexual contactc | 16 | – | 14 | – | 18 | – | 11 | – | 19 | – |
| Otherd | 1 | – | 1 | – | 1 | – | 1 | – | 1 | – |
| Region of residencee | ||||||||||
| Northeast | 23 | 5.2 | 17 | 3.7 | 20 | 4.2 | 15 | 3.1 | 23 | 4.5 |
| Midwest | 5 | 2.5 | 8 | 3.8 | 16 | 7.2 | 5 | 2.1 | 5 | 2.0 |
| South | 12 | 2.8 | 15 | 3.3 | 21 | 4.3 | 18 | 3.5 | 18 | 3.3 |
| West | 39 | 3.7 | 41 | 3.7 | 41 | 3.6 | 46 | 3.9 | 39 | 3.2 |
| Subtotal, male ≥50 years of age | 79 | 3.7 | 81 | 3.6 | 98 | 4.2 | 84 | 3.5 | 85 | 3.4 |
| Female adult | ||||||||||
| Transmission Categoryb | ||||||||||
| Injection drug use | 3 | – | 2 | – | 1 | – | 2 | – | 1 | – |
| Heterosexual contactc | 22 | – | 22 | – | 26 | – | 33 | – | 28 | – |
| Otherd | 0 | – | 1 | – | 0 | – | 1 | – | 1 | – |
| Region of residencee | ||||||||||
| Northeast | 2 | 0.4 | 5 | 1.0 | 7 | 1.3 | 7 | 1.2 | 13 | 2.2 |
| Midwest | 4 | 1.6 | 3 | 1.2 | 2 | 0.7 | 3 | 1.1 | 0 | 0.0 |
| South | 4 | 0.7 | 6 | 1.1 | 4 | 0.7 | 10 | 1.6 | 9 | 1.3 |
| West | 15 | 1.1 | 11 | 0.8 | 14 | 1.0 | 15 | 1.0 | 8 | 0.5 |
| Subtotal, female ≥50 years of age | 25 | 0.9 | 25 | 0.9 | 27 | 0.9 | 35 | 1.2 | 30 | 1.0 |
| Total, ≥50 years of age at diagnosis | 104 | 2.2 | 106 | 2.1 | 125 | 2.4 | 119 | 2.2 | 115 | 2.0 |
Black/African American
| Black/African American | ||||||||||
|---|---|---|---|---|---|---|---|---|---|---|
| 2014 | 2015 | 2016 | 2017 | 2018 | ||||||
| No. | Ratea | No. | Ratea | No. | Ratea | No. | Ratea | No. | Ratea | |
| Aged 50–64 years of age at diagnosis | ||||||||||
| Male adult | ||||||||||
| Transmission Categoryb | ||||||||||
| Male-to-male sexual contact | 664 | – | 654 | – | 680 | – | 665 | – | 628 | – |
| Injection drug use | 177 | – | 158 | – | 143 | – | 136 | – | 129 | – |
| Male-to-male sexual contact and injection drug use | 47 | – | 32 | – | 30 | – | 41 | – | 33 | – |
| Heterosexual contactc | 560 | – | 604 | – | 538 | – | 518 | – | 478 | – |
| Otherd | 3 | – | 2 | – | 2 | – | 3 | – | 3 | – |
| Region of residencee | ||||||||||
| Northeast | 321 | 60.7 | 288 | 53.4 | 228 | 41.8 | 255 | 46.4 | 240 | 43.4 |
| Midwest | 152 | 26.9 | 169 | 29.7 | 155 | 27.1 | 174 | 30.4 | 178 | 31.1 |
| South | 856 | 45.1 | 871 | 45.0 | 862 | 44.0 | 796 | 40.3 | 735 | 37.0 |
| West | 122 | 37.6 | 121 | 36.7 | 149 | 44.6 | 137 | 40.6 | 118 | 34.7 |
| Subtotal, male aged 50–64 years | 1,451 | 43.7 | 1,449 | 43.0 | 1,394 | 40.9 | 1,362 | 39.7 | 1,271 | 36.8 |
| Female adult | ||||||||||
| Transmission Categoryb | ||||||||||
| Injection drug use | 118 | – | 102 | – | 119 | – | 95 | – | 97 | – |
| Heterosexual contactc | 844 | – | 852 | – | 884 | – | 847 | – | 824 | – |
| Otherd | 1 | – | 0 | – | 1 | – | 1 | – | 1 | – |
| Region of residencee | ||||||||||
| Northeast | 190 | 29.7 | 205 | 31.6 | 210 | 32.1 | 187 | 28.4 | 179 | 27.1 |
| Midwest | 90 | 13.6 | 93 | 14.0 | 103 | 15.5 | 100 | 15.1 | 87 | 13.1 |
| South | 616 | 27.3 | 591 | 25.7 | 614 | 26.3 | 583 | 24.7 | 574 | 24.2 |
| West | 67 | 20.8 | 66 | 20.2 | 76 | 23.0 | 73 | 21.9 | 81 | 24.1 |
| Subtotal, female adult aged 50–64 years | 963 | 24.8 | 955 | 24.2 | 1,003 | 25.2 | 943 | 23.5 | 921 | 22.8 |
| Aged ≥65 years of age at diagnosis | ||||||||||
| Male adult | ||||||||||
| Transmission Categoryb | ||||||||||
| Male-to-male sexual contact | 79 | – | 81 | – | 68 | – | 69 | – | 80 | – |
| Injection drug use | 38 | – | 30 | – | 31 | – | 28 | – | 33 | – |
| Male-to-male sexual contact and injection drug use | 5 | – | 5 | – | 4 | – | 4 | – | 3 | – |
| Heterosexual contactc | 122 | – | 106 | – | 120 | – | 112 | – | 108 | – |
| Otherd | 1 | – | 1 | – | 1 | – | 1 | – | 2 | – |
| Region of residencee | ||||||||||
| Northeast | 68 | 25.5 | 50 | 18.0 | 49 | 17.0 | 47 | 15.8 | 38 | 12.4 |
| Midwest | 16 | 5.7 | 23 | 7.9 | 26 | 8.6 | 21 | 6.7 | 25 | 7.7 |
| South | 150 | 16.6 | 132 | 13.8 | 133 | 13.2 | 132 | 12.5 | 147 | 13.2 |
| West | 10 | 6.5 | 17 | 10.6 | 16 | 9.5 | 14 | 8.0 | 17 | 9.3 |
| Subtotal, male aged ≥65 years | 244 | 15.2 | 222 | 13.2 | 224 | 12.7 | 214 | 11.6 | 227 | 11.8 |
| Female adult | ||||||||||
| Transmission Categoryb | ||||||||||
| Injection drug use | 18 | – | 14 | – | 16 | – | 19 | – | 17 | – |
| Heterosexual contactc | 125 | – | 135 | – | 123 | – | 170 | – | 131 | – |
| Otherd | 1 | – | 0 | – | 0 | – | 0 | – | 0 | – |
| Region of residencee | ||||||||||
| Northeast | 43 | 9.8 | 29 | 6.4 | 19 | 4.1 | 40 | 8.4 | 30 | 6.1 |
| Midwest | 13 | 3.1 | 17 | 3.9 | 9 | 2.0 | 13 | 2.8 | 14 | 2.9 |
| South | 80 | 6.0 | 97 | 6.9 | 98 | 6.6 | 125 | 8.0 | 91 | 5.6 |
| West | 7 | 3.5 | 7 | 3.3 | 13 | 5.9 | 11 | 4.8 | 13 | 5.5 |
| Subtotal, female aged ≥65 years | 143 | 5.9 | 150 | 6.0 | 139 | 5.3 | 189 | 6.9 | 148 | 5.2 |
| Aged ≥50 years of age at diagnosis | ||||||||||
| Male adult | ||||||||||
| Transmission Categoryb | ||||||||||
| Male-to-male sexual contact | 742 | – | 735 | – | 748 | – | 734 | – | 708 | – |
| Injection drug use | 215 | – | 188 | – | 174 | – | 164 | – | 162 | – |
| Male-to-male sexual contact and injection drug use | 52 | – | 36 | – | 34 | – | 45 | – | 36 | – |
| Heterosexual contactc | 682 | – | 710 | – | 658 | – | 629 | – | 586 | – |
| Otherd | 4 | – | 3 | – | 3 | – | 4 | – | 5 | – |
| Region of residencee | ||||||||||
| Northeast | 389 | 48.8 | 338 | 41.4 | 277 | 33.2 | 302 | 35.7 | 278 | 32.3 |
| Midwest | 168 | 19.9 | 192 | 22.3 | 181 | 20.7 | 195 | 22.0 | 203 | 22.6 |
| South | 1,006 | 35.9 | 1,003 | 34.7 | 995 | 33.5 | 928 | 30.6 | 882 | 28.5 |
| West | 132 | 27.7 | 138 | 28.1 | 165 | 32.9 | 151 | 29.5 | 135 | 25.8 |
| Subtotal, male ≥50 years of age | 1,695 | 34.4 | 1,671 | 33.0 | 1,618 | 31.2 | 1,576 | 29.8 | 1,498 | 27.8 |
| Female adult | ||||||||||
| Transmission Categoryb | ||||||||||
| Injection drug use | 136 | – | 116 | – | 135 | – | 114 | – | 114 | – |
| Heterosexual contactc | 968 | – | 988 | – | 1,006 | – | 1,017 | – | 955 | – |
| Otherd | 2 | – | 1 | – | 1 | – | 1 | – | 1 | – |
| Region of residencee | ||||||||||
| Northeast | 233 | 21.6 | 234 | 21.3 | 229 | 20.4 | 227 | 20.0 | 209 | 18.2 |
| Midwest | 103 | 9.5 | 110 | 10.0 | 112 | 10.0 | 113 | 10.0 | 101 | 8.8 |
| South | 696 | 19.3 | 688 | 18.5 | 712 | 18.6 | 708 | 18.1 | 665 | 16.6 |
| West | 74 | 14.1 | 73 | 13.6 | 89 | 16.2 | 84 | 14.9 | 94 | 16.4 |
| Subtotal, female ≥50 years of age | 1,106 | 17.6 | 1,105 | 17.1 | 1,142 | 17.3 | 1,132 | 16.8 | 1,069 | 15.5 |
| Total, ≥50 years of age at diagnosis | 2,801 | 25.0 | 2,776 | 24.1 | 2,760 | 23.4 | 2,708 | 22.5 | 2,567 | 20.9 |
Hispanic/Latino
| Hispanic/Latinof | ||||||||||
|---|---|---|---|---|---|---|---|---|---|---|
| 2014 | 2015 | 2016 | 2017 | 2018 | ||||||
| No. | Ratea | No. | Ratea | No. | Ratea | No. | Ratea | No. | Ratea | |
| Aged 50–64 years of age at diagnosis | ||||||||||
| Male adult | ||||||||||
| Transmission Categoryb | ||||||||||
| Male-to-male sexual contact | 507 | – | 589 | – | 586 | – | 581 | – | 619 | – |
| Injection drug use | 75 | – | 71 | – | 75 | – | 73 | – | 77 | – |
| Male-to-male sexual contact and injection drug use | 22 | – | 19 | – | 28 | – | 25 | – | 24 | – |
| Heterosexual contactc | 136 | – | 133 | – | 120 | – | 116 | – | 128 | – |
| Otherd | 1 | – | 1 | – | 1 | – | 1 | – | 1 | – |
| Region of residencee | ||||||||||
| Northeast | 154 | 31.1 | 177 | 34.3 | 163 | 30.4 | 136 | 24.5 | 163 | 28.4 |
| Midwest | 40 | 14.5 | 51 | 17.7 | 43 | 14.3 | 41 | 13.0 | 42 | 12.8 |
| South | 349 | 27.6 | 349 | 26.1 | 347 | 24.7 | 364 | 24.8 | 406 | 26.4 |
| West | 197 | 14.5 | 235 | 16.6 | 256 | 17.4 | 255 | 16.7 | 238 | 15.0 |
| Subtotal, male aged 50–64 years | 740 | 21.8 | 812 | 22.8 | 809 | 21.8 | 796 | 20.6 | 849 | 21.1 |
| Female adult | ||||||||||
| Transmission Categoryb | ||||||||||
| Injection drug use | 37 | – | 26 | – | 37 | – | 28 | – | 31 | – |
| Heterosexual contactc | 203 | – | 210 | – | 208 | – | 192 | – | 230 | – |
| Otherd | 0 | – | 0 | – | 0 | – | 0 | – | 0 | – |
| Region of residencee | ||||||||||
| Northeast | 87 | 15.6 | 86 | 14.9 | 89 | 14.9 | 80 | 13.0 | 81 | 12.8 |
| Midwest | 10 | 3.8 | 10 | 3.7 | 11 | 3.9 | 10 | 3.4 | 12 | 3.9 |
| South | 81 | 6.2 | 95 | 6.9 | 97 | 6.7 | 88 | 5.8 | 118 | 7.5 |
| West | 62 | 4.4 | 45 | 3.1 | 48 | 3.2 | 42 | 2.7 | 50 | 3.1 |
| Subtotal, female aged 50–64 years | 240 | 6.8 | 236 | 6.4 | 245 | 6.4 | 220 | 5.5 | 261 | 6.3 |
| Aged ≥65 years of age at diagnosis | ||||||||||
| Male adult | ||||||||||
| Transmission Categoryb | ||||||||||
| Male-to-male sexual contact | 55 | – | 58 | – | 52 | – | 72 | – | 69 | – |
| Injection drug use | 7 | – | 13 | – | 13 | – | 13 | – | 8 | – |
| Male-to-male sexual contact and injection drug use | 1 | – | 2 | – | 3 | – | 2 | – | 2 | – |
| Heterosexual contactc | 25 | – | 37 | – | 25 | – | 28 | – | 31 | – |
| Otherd | 1 | – | 1 | – | 1 | – | 1 | – | 1 | – |
| Region of residencee | ||||||||||
| Northeast | 22 | 9.8 | 36 | 15.2 | 19 | 7.6 | 22 | 8.3 | 21 | 7.5 |
| Midwest | 5 | 4.8 | 4 | 3.6 | 1 | 0.8 | 3 | 2.3 | 13 | 9.4 |
| South | 38 | 6.3 | 51 | 8.0 | 49 | 7.2 | 54 | 7.5 | 41 | 5.4 |
| West | 24 | 4.1 | 21 | 3.4 | 25 | 3.8 | 37 | 5.3 | 35 | 4.7 |
| Subtotal, male aged ≥65 years | 89 | 5.9 | 112 | 6.9 | 94 | 5.5 | 116 | 6.4 | 110 | 5.7 |
| Female adult | ||||||||||
| Transmission Categoryb | ||||||||||
| Injection drug use | 7 | – | 6 | – | 5 | – | 4 | – | 4 | – |
| Heterosexual contactc | 23 | – | 27 | – | 40 | – | 37 | – | 47 | – |
| Otherd | 0 | – | 0 | – | 0 | – | 0 | – | 0 | – |
| Region of residencee | ||||||||||
| Northeast | 13 | 4.0 | 15 | 4.4 | 22 | 6.1 | 13 | 3.5 | 17 | 4.3 |
| Midwest | 2 | 1.6 | 0 | 0.0 | 0 | 0.0 | 4 | 2.7 | 2 | 1.3 |
| South | 10 | 1.3 | 7 | 0.8 | 15 | 1.7 | 20 | 2.1 | 17 | 1.7 |
| West | 5 | 0.7 | 11 | 1.4 | 8 | 0.9 | 4 | 0.4 | 15 | 1.6 |
| Subtotal, female aged ≥65 years | 30 | 1.5 | 33 | 1.6 | 45 | 2.0 | 41 | 1.7 | 51 | 2.0 |
| Aged ≥50 years of age at diagnosis | ||||||||||
| Male adult | ||||||||||
| Transmission Categoryb | ||||||||||
| Male-to-male sexual contact | 562 | – | 647 | – | 638 | – | 653 | – | 688 | – |
| Injection drug use | 81 | – | 84 | – | 88 | – | 86 | – | 85 | – |
| Male-to-male sexual contact and injection drug use | 23 | – | 21 | – | 31 | – | 27 | – | 26 | – |
| Heterosexual contactc | 162 | – | 170 | – | 144 | – | 144 | – | 159 | – |
| Otherd | 1 | – | 2 | – | 2 | – | 2 | – | 2 | – |
| Region of residencee | ||||||||||
| Northeast | 176 | 24.5 | 213 | 28.3 | 182 | 23.1 | 158 | 19.3 | 184 | 21.6 |
| Midwest | 45 | 11.8 | 55 | 13.7 | 44 | 10.4 | 44 | 9.9 | 55 | 11.8 |
| South | 387 | 20.8 | 400 | 20.3 | 396 | 19.0 | 418 | 19.1 | 447 | 19.4 |
| West | 221 | 11.4 | 256 | 12.5 | 281 | 13.1 | 292 | 13.1 | 273 | 11.7 |
| Subtotal, male ≥50 years of age | 829 | 16.9 | 924 | 17.9 | 903 | 16.6 | 912 | 16.1 | 959 | 16.1 |
| Female adult | ||||||||||
| Transmission Categoryb | ||||||||||
| Injection drug use | 43 | – | 32 | – | 42 | – | 32 | – | 35 | – |
| Heterosexual contactc | 227 | – | 237 | – | 247 | – | 228 | – | 277 | – |
| Otherd | 0 | – | 0 | – | 0 | – | 0 | – | 0 | – |
| Region of residencee | ||||||||||
| Northeast | 100 | 11.4 | 101 | 11.0 | 111 | 11.6 | 93 | 9.4 | 98 | 9.5 |
| Midwest | 12 | 3.1 | 10 | 2.5 | 11 | 2.6 | 14 | 3.1 | 14 | 3.0 |
| South | 91 | 4.3 | 102 | 4.6 | 112 | 4.8 | 108 | 4.4 | 135 | 5.2 |
| West | 67 | 3.1 | 56 | 2.5 | 56 | 2.4 | 46 | 1.9 | 65 | 2.5 |
| Subtotal, female adult ≥50 years of age | 270 | 4.9 | 269 | 4.6 | 290 | 4.8 | 261 | 4.1 | 312 | 4.7 |
| Total, ≥50 years of age at diagnosis | 1,099 | 10.5 | 1,193 | 10.9 | 1,193 | 10.4 | 1,173 | 9.8 | 1,271 | 10.1 |
Native Hawaiian/other Pacific Islander
| Native Hawaiian/other Pacific Islander | ||||||||||
|---|---|---|---|---|---|---|---|---|---|---|
| 2014 | 2015 | 2016 | 2017 | 2018 | ||||||
| No. | Ratea | No. | Ratea | No. | Ratea | No. | Ratea | No. | Ratea | |
| Aged 50–64 years of age at diagnosis | ||||||||||
| Male adult | ||||||||||
| Transmission Categoryb | ||||||||||
| Male-to-male sexual contact | 1 | – | 7 | – | 2 | – | 1 | – | 6 | – |
| Injection drug use | 1 | – | 0 | – | 0 | – | 1 | – | 0 | – |
| Male-to-male sexual contact and injection drug use | 0 | – | 0 | – | 0 | – | 0 | – | 0 | – |
| Heterosexual contactc | 0 | – | 2 | – | 0 | – | 0 | – | 0 | – |
| Otherd | 0 | – | 0 | – | 0 | – | 0 | – | 0 | – |
| Region of residencee | ||||||||||
| Northeast | 1 | 62.6 | 0 | 0.0 | 1 | 56.6 | 0 | 0.0 | 1 | 52.5 |
| Midwest | 0 | 0.0 | 0 | 0.0 | 0 | 0.0 | 0 | 0.0 | 0 | 0.0 |
| South | 1 | 18.2 | 2 | 34.5 | 0 | 0.0 | 0 | 0.0 | 0 | 0.0 |
| West | 1 | 3.1 | 7 | 20.7 | 1 | 2.9 | 2 | 5.7 | 5 | 13.9 |
| Subtotal, adult aged 50–64 years | 3 | 7.2 | 9 | 20.8 | 2 | 4.5 | 2 | 4.4 | 6 | 12.8 |
| Female adult | ||||||||||
| Transmission Categoryb | ||||||||||
| Injection drug use | 0 | – | 0 | – | 2 | – | 0 | – | 0 | – |
| Heterosexual contactc | 3 | – | 2 | – | 2 | – | 1 | – | 2 | – |
| Otherd | 0 | – | 0 | – | 0 | – | 0 | – | 0 | – |
| Region of residencee | ||||||||||
| Northeast | 0 | 0.0 | 0 | 0.0 | 0 | 0.0 | 0 | 0.0 | 1 | 47.3 |
| Midwest | 0 | 0.0 | 0 | 0.0 | 0 | 0.0 | 0 | 0.0 | 0 | 0.0 |
| South | 0 | 0.0 | 0 | 0.0 | 1 | 15.2 | 0 | 0.0 | 1 | 13.9 |
| West | 3 | 8.9 | 2 | 5.8 | 3 | 8.4 | 1 | 2.7 | 0 | 0.0 |
| Subtotal, female aged 50–64 years | 3 | 6.9 | 2 | 4.4 | 4 | 8.6 | 1 | 2.1 | 2 | 4.1 |
| Aged ≥65 years of age at diagnosis | ||||||||||
| Male adult | ||||||||||
| Transmission Categoryb | ||||||||||
| Male-to-male sexual contact | 1 | – | 0 | – | 1 | – | 0 | – | 1 | – |
| Injection drug use | 0 | – | 0 | – | 0 | – | 0 | – | 0 | – |
| Male-to-male sexual contact and injection drug use | 0 | – | 0 | – | 1 | – | 0 | – | 0 | – |
| Heterosexual contactc | 0 | – | 0 | – | 0 | – | 1 | – | 0 | – |
| Otherd | 0 | – | 0 | – | 0 | – | 0 | – | 0 | – |
| Region of residencee | ||||||||||
| Northeast | 0 | 0.0 | 0 | 0.0 | 0 | 0.0 | 1 | 120.9 | 1 | 109.6 |
| Midwest | 0 | 0.0 | 0 | 0.0 | 0 | 0.0 | 0 | 0.0 | 0 | 0.0 |
| South | 0 | 0.0 | 0 | 0.0 | 1 | 36.0 | 0 | 0.0 | 0 | 0.0 |
| West | 1 | 6.2 | 0 | 0.0 | 1 | 5.4 | 0 | 0.0 | 0 | 0.0 |
| Subtotal, male aged ≥65 years | 1 | 5.1 | 0 | 0.0 | 2 | 8.7 | 1 | 4.0 | 1 | 3.8 |
| Female adult | ||||||||||
| Transmission Categoryb | ||||||||||
| Injection drug use | 0 | – | 0 | – | 0 | – | 0 | – | 0 | – |
| Heterosexual contactc | 0 | – | 0 | – | 0 | – | 0 | – | 0 | – |
| Otherd | 0 | – | 0 | – | 0 | – | 0 | – | 0 | – |
| Region of residencee | ||||||||||
| Northeast | 0 | 0.0 | 0 | 0.0 | 0 | 0.0 | 0 | 0.0 | 0 | 0.0 |
| Midwest | 0 | 0.0 | 0 | 0.0 | 0 | 0.0 | 0 | 0.0 | 0 | 0.0 |
| South | 0 | 0.0 | 0 | 0.0 | 0 | 0.0 | 0 | 0.0 | 0 | 0.0 |
| West | 0 | 0.0 | 0 | 0.0 | 0 | 0.0 | 0 | 0.0 | 0 | 0.0 |
| Subtotal, female aged ≥65 years | 0 | 0.0 | 0 | 0.0 | 0 | 0.0 | 0 | 0.0 | 0 | 0.0 |
| Aged ≥50 years of age at diagnosis | ||||||||||
| Male adult | ||||||||||
| Transmission Categoryb | ||||||||||
| Male-to-male sexual contact | 2 | – | 7 | – | 3 | – | 1 | – | 7 | – |
| Injection drug use | 1 | – | 0 | – | 0 | – | 1 | – | 0 | – |
| Male-to-male sexual contact and injection drug use | 0 | – | 0 | – | 1 | – | 0 | – | 0 | – |
| Heterosexual contactc | 0 | – | 2 | – | 0 | – | 1 | – | 0 | – |
| Otherd | 0 | – | 0 | – | 0 | – | 0 | – | 0 | – |
| Region of residencee | ||||||||||
| Northeast | 1 | 43.8 | 0 | 0.0 | 1 | 39.4 | 1 | 37.4 | 2 | 71.0 |
| Midwest | 0 | 0.0 | 0 | 0.0 | 0 | 0.0 | 0 | 0.0 | 0 | 0.0 |
| South | 1 | 12.8 | 2 | 24.1 | 1 | 11.4 | 0 | 0.0 | 0 | 0.0 |
| West | 2 | 4.1 | 7 | 13.7 | 2 | 3.8 | 2 | 3.6 | 5 | 8.8 |
| Subtotal, male ≥50 years of age | 4 | 6.5 | 9 | 13.9 | 4 | 5.9 | 3 | 4.3 | 7 | 9.5 |
| Female adult | ||||||||||
| Transmission Categoryb | ||||||||||
| Injection drug use | 0 | – | 0 | – | 2 | – | 0 | – | 0 | – |
| Heterosexual contactc | 3 | – | 2 | – | 2 | – | 1 | – | 2 | – |
| Otherd | 0 | – | 0 | – | 0 | – | 0 | – | 0 | – |
| Region of residencee | ||||||||||
| Northeast | 0 | 0.0 | 0 | 0.0 | 0 | 0.0 | 0 | 0.0 | 1 | 30.1 |
| Midwest | 0 | 0.0 | 0 | 0.0 | 0 | 0.0 | 0 | 0.0 | 0 | 0.0 |
| South | 0 | 0.0 | 0 | 0.0 | 1 | 10.3 | 0 | 0.0 | 1 | 9.1 |
| West | 3 | 5.8 | 2 | 3.7 | 3 | 5.3 | 1 | 1.7 | 0 | 0.0 |
| Subtotal, female adult ≥50 years of age | 3 | 4.5 | 2 | 2.9 | 4 | 5.5 | 1 | 1.3 | 2 | 2.5 |
| Total, ≥50 years of age at diagnosis | 7 | 5.5 | 11 | 8.2 | 8 | 5.7 | 4 | 2.7 | 9 | 5.9 |
White
| White | ||||||||||
|---|---|---|---|---|---|---|---|---|---|---|
| 2014 | 2015 | 2016 | 2017 | 2018 | ||||||
| No. | Ratea | No. | Ratea | No. | Ratea | No. | Ratea | No. | Ratea | |
| Aged 50–64 years of age at diagnosis | ||||||||||
| Male adult | ||||||||||
| Transmission Categoryb | ||||||||||
| Male-to-male sexual contact | 1,492 | – | 1,478 | – | 1,434 | – | 1,380 | – | 1,234 | – |
| Injection drug use | 100 | – | 107 | – | 96 | – | 95 | – | 106 | – |
| Male-to-male sexual contact and injection drug use | 83 | – | 108 | – | 85 | – | 76 | – | 76 | – |
| Heterosexual contactc | 146 | – | 125 | – | 163 | – | 142 | – | 127 | – |
| Otherd | 1 | – | 3 | – | 1 | – | 2 | – | 2 | – |
| Region of residencee | ||||||||||
| Northeast | 304 | 7.1 | 275 | 6.5 | 273 | 6.5 | 223 | 5.3 | 218 | 5.3 |
| Midwest | 290 | 5.1 | 290 | 5.1 | 334 | 5.9 | 283 | 5.1 | 263 | 4.8 |
| South | 757 | 10.1 | 778 | 10.4 | 716 | 9.6 | 752 | 10.1 | 702 | 9.5 |
| West | 471 | 10.9 | 478 | 11.1 | 457 | 10.7 | 437 | 10.4 | 362 | 8.7 |
| Subtotal, male aged 50–64 years | 1,822 | 8.4 | 1,821 | 8.4 | 1,780 | 8.2 | 1,695 | 7.9 | 1,545 | 7.3 |
| Female adult | ||||||||||
| Transmission Categoryb | ||||||||||
| Injection drug use | 54 | – | 77 | – | 73 | – | 80 | – | 79 | – |
| Heterosexual contactc | 209 | – | 228 | – | 247 | – | 242 | – | 211 | – |
| Otherd | 1 | – | 1 | – | 2 | – | 1 | – | 2 | – |
| Region of residencee | ||||||||||
| Northeast | 45 | 1.0 | 52 | 1.2 | 39 | 0.9 | 58 | 1.3 | 41 | 1.0 |
| Midwest | 33 | 0.6 | 48 | 0.8 | 52 | 0.9 | 54 | 0.9 | 40 | 0.7 |
| South | 135 | 1.7 | 149 | 1.9 | 158 | 2.0 | 150 | 1.9 | 146 | 1.9 |
| West | 51 | 1.2 | 57 | 1.3 | 73 | 1.7 | 62 | 1.4 | 65 | 1.5 |
| Subtotal, female aged 50–64 years | 264 | 1.2 | 306 | 1.4 | 322 | 1.4 | 324 | 1.5 | 292 | 1.3 |
| Aged ≥65 years of age at diagnosis | ||||||||||
| Male adult | ||||||||||
| Transmission Categoryb | ||||||||||
| Male-to-male sexual contact | 207 | – | 192 | – | 200 | – | 184 | – | 210 | – |
| Injection drug use | 13 | – | 9 | – | 16 | – | 16 | – | 7 | – |
| Male-to-male sexual contact and injection drug use | 3 | – | 4 | – | 8 | – | 8 | – | 6 | – |
| Heterosexual contactc | 37 | – | 48 | – | 43 | – | 34 | – | 31 | – |
| Otherd | 3 | – | 3 | – | 3 | – | 3 | – | 2 | – |
| Region of residencee | ||||||||||
| Northeast | 56 | 1.8 | 39 | 1.3 | 48 | 1.5 | 36 | 1.1 | 42 | 1.3 |
| Midwest | 33 | 0.8 | 32 | 0.8 | 26 | 0.6 | 43 | 1.0 | 36 | 0.8 |
| South | 108 | 1.8 | 117 | 1.9 | 123 | 2.0 | 109 | 1.7 | 113 | 1.7 |
| West | 65 | 2.0 | 69 | 2.0 | 73 | 2.1 | 57 | 1.6 | 66 | 1.8 |
| Subtotal, male aged ≥65 years | 262 | 1.6 | 257 | 1.5 | 270 | 1.6 | 245 | 1.4 | 257 | 1.4 |
| Female adult | ||||||||||
| Transmission Categoryb | ||||||||||
| Injection drug use | 6 | – | 5 | – | 8 | – | 5 | – | 6 | – |
| Heterosexual contactc | 15 | – | 25 | – | 23 | – | 24 | – | 25 | – |
| Otherd | 1 | – | 1 | – | 1 | – | 1 | – | 2 | – |
| Region of residencee | ||||||||||
| Northeast | 5 | 0.1 | 9 | 0.2 | 13 | 0.3 | 5 | 0.1 | 5 | 0.1 |
| Midwest | 4 | 0.1 | 4 | 0.1 | 3 | 0.1 | 2 | 0.0 | 5 | 0.1 |
| South | 4 | 0.1 | 11 | 0.1 | 15 | 0.2 | 18 | 0.2 | 16 | 0.2 |
| West | 9 | 0.2 | 7 | 0.2 | 1 | 0.0 | 5 | 0.1 | 7 | 0.2 |
| Subtotal, female aged ≥65 years | 22 | 0.1 | 31 | 0.2 | 32 | 0.2 | 30 | 0.1 | 33 | 0.1 |
| Aged ≥50 years of age at diagnosis | ||||||||||
| Male adult | ||||||||||
| Transmission Categoryb | ||||||||||
| Male-to-male sexual contact | 1,699 | – | 1,670 | – | 1,634 | – | 1,564 | – | 1,444 | – |
| Injection drug use | 113 | – | 117 | – | 112 | – | 111 | – | 113 | – |
| Male-to-male sexual contact and injection drug use | 85 | – | 113 | – | 93 | – | 85 | – | 82 | – |
| Heterosexual contactc | 183 | – | 173 | – | 206 | – | 175 | – | 158 | – |
| Otherd | 4 | – | 6 | – | 5 | – | 5 | – | 5 | – |
| Region of residencee | ||||||||||
| Northeast | 360 | 4.9 | 314 | 4.3 | 321 | 4.3 | 259 | 3.5 | 260 | 3.5 |
| Midwest | 323 | 3.4 | 322 | 3.3 | 360 | 3.7 | 326 | 3.3 | 299 | 3.0 |
| South | 865 | 6.5 | 895 | 6.6 | 839 | 6.1 | 861 | 6.2 | 815 | 5.8 |
| West | 536 | 7.1 | 547 | 7.1 | 530 | 6.8 | 494 | 6.3 | 428 | 5.4 |
| Subtotal, male ≥50 years of age | 2,084 | 5.5 | 2,078 | 5.4 | 2,050 | 5.3 | 1,940 | 5.0 | 1,802 | 4.6 |
| Female adult | ||||||||||
| Transmission Categoryb | ||||||||||
| Injection drug use | 61 | – | 82 | – | 81 | – | 85 | – | 86 | – |
| Heterosexual contactc | 224 | – | 253 | – | 270 | – | 267 | – | 236 | – |
| Otherd | 2 | – | 2 | – | 3 | – | 2 | – | 3 | – |
| Region of residencee | ||||||||||
| Northeast | 50 | 0.6 | 61 | 0.7 | 52 | 0.6 | 63 | 0.7 | 46 | 0.5 |
| Midwest | 37 | 0.3 | 52 | 0.5 | 55 | 0.5 | 56 | 0.5 | 45 | 0.4 |
| South | 139 | 0.9 | 160 | 1.0 | 173 | 1.1 | 168 | 1.1 | 162 | 1.0 |
| West | 60 | 0.7 | 64 | 0.8 | 74 | 0.9 | 67 | 0.8 | 72 | 0.8 |
| Subtotal, female ≥50 years of age | 286 | 0.7 | 337 | 0.8 | 354 | 0.8 | 354 | 0.8 | 325 | 0.7 |
| Total, ≥50 years of age at diagnosis | 2,370 | 2.9 | 2,415 | 3.0 | 2,404 | 2.9 | 2,294 | 2.8 | 2,127 | 2.6 |
Multiple Races
| Multiple Races | ||||||||||
|---|---|---|---|---|---|---|---|---|---|---|
| 2014 | 2015 | 2016 | 2017 | 2018 | ||||||
| No. | Ratea | No. | Ratea | No. | Ratea | No. | Ratea | No. | Ratea | |
| Aged 50–64 years of age at diagnosis | ||||||||||
| Male adult | ||||||||||
| Transmission Categoryb | ||||||||||
| Male-to-male sexual contact | 89 | – | 84 | – | 81 | – | 73 | – | 46 | – |
| Injection drug use | 12 | – | 12 | – | 12 | – | 5 | – | 10 | – |
| Male-to-male sexual contact and injection drug use | 7 | – | 4 | – | 8 | – | 9 | – | 3 | – |
| Heterosexual contactc | 24 | – | 23 | – | 21 | – | 17 | – | 11 | – |
| Otherd | 0 | – | 1 | – | 1 | – | 0 | – | 0 | – |
| Region of residencee | ||||||||||
| Northeast | 37 | 92.3 | 37 | 89.7 | 27 | 64.0 | 26 | 60.6 | 20 | 45.9 |
| Midwest | 10 | 21.6 | 11 | 23.3 | 20 | 41.7 | 10 | 20.5 | 7 | 14.1 |
| South | 56 | 59.4 | 50 | 51.8 | 51 | 51.8 | 49 | 49.0 | 31 | 30.5 |
| West | 29 | 26.0 | 25 | 21.9 | 24 | 20.6 | 20 | 16.9 | 12 | 10.0 |
| Subtotal, male aged 50–64 years | 132 | 45.1 | 123 | 41.1 | 122 | 40.0 | 105 | 33.9 | 70 | 22.2 |
| Female adult | ||||||||||
| Transmission Categoryb | ||||||||||
| Injection drug use | 11 | – | 13 | – | 10 | – | 7 | – | 7 | – |
| Heterosexual contactc | 35 | – | 41 | – | 32 | – | 25 | – | 22 | – |
| Otherd | 0 | – | 0 | – | 0 | – | 0 | – | 0 | – |
| Region of residencee | ||||||||||
| Northeast | 9 | 19.9 | 15 | 32.2 | 9 | 18.9 | 13 | 26.8 | 10 | 20.2 |
| Midwest | 4 | 7.9 | 5 | 9.7 | 6 | 11.4 | 2 | 3.7 | 1 | 1.8 |
| South | 25 | 23.7 | 27 | 24.9 | 24 | 21.6 | 12 | 10.5 | 10 | 8.6 |
| West | 8 | 6.6 | 6 | 4.8 | 3 | 2.4 | 5 | 3.9 | 8 | 6.1 |
| Subtotal, female aged 50–64 years | 46 | 14.3 | 53 | 16.0 | 42 | 12.4 | 32 | 9.3 | 29 | 8.3 |
| Aged ≥65 years of age at diagnosis | ||||||||||
| Male adult | ||||||||||
| Transmission Categoryb | ||||||||||
| Male-to-male sexual contact | 10 | – | 13 | – | 8 | – | 5 | – | 10 | – |
| Injection drug use | 2 | – | 4 | – | 1 | – | 0 | – | 1 | – |
| Male-to-male sexual contact and injection drug use | 0 | – | 1 | – | 0 | – | 0 | – | 0 | – |
| Heterosexual contactc | 6 | – | 7 | – | 2 | – | 4 | – | 3 | – |
| Otherd | 0 | – | 0 | – | 0 | – | 0 | – | 0 | – |
| Region of residencee | ||||||||||
| Northeast | 6 | 32.3 | 6 | 30.7 | 4 | 19.5 | 3 | 13.9 | 6 | 26.3 |
| Midwest | 1 | 4.6 | 4 | 17.2 | 1 | 4.0 | 2 | 7.6 | 1 | 3.6 |
| South | 9 | 18.2 | 12 | 22.8 | 5 | 8.9 | 5 | 8.4 | 4 | 6.4 |
| West | 2 | 3.8 | 2 | 3.5 | 1 | 1.7 | 0 | 0.0 | 2 | 3.0 |
| Subtotal, male aged ≥65 years | 18 | 12.6 | 24 | 15.7 | 11 | 6.8 | 10 | 5.8 | 13 | 7.2 |
| Female adult | ||||||||||
| Transmission Categoryb | ||||||||||
| Injection drug use | 2 | – | 1 | – | 1 | – | 0 | – | 2 | – |
| Heterosexual contactc | 3 | – | 4 | – | 8 | – | 5 | – | 9 | – |
| Otherd | 0 | – | 0 | – | 0 | – | 0 | – | 0 | – |
| Region of residencee | ||||||||||
| Northeast | 2 | 8.0 | 2 | 7.7 | 2 | 7.4 | 2 | 7.0 | 2 | 6.7 |
| Midwest | 0 | 0.0 | 0 | 0.0 | 2 | 6.5 | 0 | 0.0 | 0 | 0.0 |
| South | 3 | 4.8 | 2 | 3.0 | 5 | 7.1 | 2 | 2.7 | 5 | 6.4 |
| West | 0 | 0.0 | 1 | 1.5 | 0 | 0.0 | 1 | 1.3 | 4 | 4.9 |
| Subtotal, female aged ≥65 years | 5 | 2.8 | 5 | 2.6 | 9 | 4.5 | 5 | 2.4 | 11 | 4.9 |
| Aged ≥50 years of age at diagnosis | ||||||||||
| Male adult | ||||||||||
| Transmission Categoryb | ||||||||||
| Male-to-male sexual contact | 99 | – | 97 | – | 89 | – | 79 | – | 55 | – |
| Injection drug use | 14 | – | 15 | – | 12 | – | 5 | – | 11 | – |
| Male-to-male sexual contact and injection drug use | 7 | – | 5 | – | 8 | – | 9 | – | 3 | – |
| Heterosexual contactc | 29 | – | 30 | – | 22 | – | 22 | – | 14 | – |
| Otherd | 0 | – | 1 | – | 1 | – | 0 | – | 0 | – |
| Region of residencee | ||||||||||
| Northeast | 43 | 73.3 | 43 | 70.7 | 31 | 49.4 | 29 | 44.9 | 26 | 39.2 |
| Midwest | 11 | 16.1 | 15 | 21.3 | 21 | 28.9 | 12 | 16.0 | 8 | 10.3 |
| South | 65 | 45.2 | 62 | 41.5 | 56 | 36.3 | 54 | 33.9 | 35 | 21.3 |
| West | 31 | 18.8 | 27 | 15.8 | 25 | 14.1 | 20 | 11.0 | 14 | 7.5 |
| Subtotal, male ≥50 years of age | 150 | 34.4 | 147 | 32.5 | 133 | 28.5 | 115 | 23.9 | 83 | 16.7 |
| Female adult | ||||||||||
| Transmission Categoryb | ||||||||||
| Injection drug use | 13 | – | 14 | – | 11 | – | 7 | – | 9 | – |
| Heterosexual contactc | 38 | – | 44 | – | 41 | – | 30 | – | 31 | – |
| Otherd | 0 | – | 0 | – | 0 | – | 0 | – | 0 | – |
| Region of residencee | ||||||||||
| Northeast | 11 | 15.7 | 17 | 23.4 | 11 | 14.7 | 15 | 19.5 | 12 | 15.1 |
| Midwest | 4 | 5.1 | 5 | 6.2 | 8 | 9.6 | 2 | 2.3 | 1 | 1.1 |
| South | 28 | 16.6 | 29 | 16.6 | 29 | 16.0 | 14 | 7.5 | 15 | 7.7 |
| West | 8 | 4.3 | 7 | 3.6 | 3 | 1.5 | 6 | 2.9 | 12 | 5.6 |
| Subtotal, female adult ≥50 years of age | 51 | 10.1 | 58 | 11.1 | 51 | 9.5 | 37 | 6.6 | 40 | 7.0 |
| Total, ≥50 years of age at diagnosis | 201 | 21.4 | 205 | 21.1 | 184 | 18.3 | 152 | 14.6 | 123 | 11.5 |
Note. Numbers less than 12, and rates and trends based on these numbers, should be interpreted with caution.
aRates are per 100,000 population. Rates are not calculated by transmission category because of the lack of denominator data.
bData have been statistically adjusted to account for missing transmission category; therefore, values may not sum to the column subtotals and total.
cHeterosexual contact with a person known to have, or to be at high risk for, HIV infection.
dIncludes hemophilia, blood transfusion, and risk factor not reported or not identified.
eData are based on residence at time of diagnosis of HIV infection.
fHispanics/Latinos can be of any race.
American Indian/Alaska Native
| American Indian/Alaska Native | |||||
|---|---|---|---|---|---|
| 2014 | 2015 | 2016 | 2017 | 2018 | |
| No. | No. | No. | No. | No. | |
| Aged 50–64 years of age at diagnosis | |||||
| Male adult | |||||
| Transmission Categorya | |||||
| Male-to-male sexual contact | 9 | 8 | 10 | 12 | 13 |
| Injection drug use | 3 | 2 | 4 | 4 | 3 |
| Male-to-male sexual contact and injection drug use | 2 | 0 | 2 | 1 | 1 |
| Heterosexual contactb | 1 | 3 | 2 | 1 | 3 |
| Otherc | 0 | 0 | 0 | 0 | 0 |
| Region of residenced | |||||
| Northeast | 1 | 1 | 0 | 0 | 1 |
| Midwest | 1 | 2 | 3 | 3 | 4 |
| South | 8 | 4 | 2 | 6 | 5 |
| West | 6 | 7 | 12 | 9 | 10 |
| U.S. dependent areas | 0 | 0 | 0 | 0 | 0 |
| Subtotal, male adult aged 50–64 years | 16 | 14 | 17 | 18 | 20 |
| Female adult | |||||
| Transmission Categorya | |||||
| Injection drug use | 1 | 3 | 5 | 2 | 2 |
| Heterosexual contactb | 8 | 6 | 4 | 9 | 5 |
| Otherc | 0 | 0 | 0 | 0 | 0 |
| Region of residenced | |||||
| Northeast | 0 | 0 | 0 | 0 | 0 |
| Midwest | 1 | 1 | 0 | 1 | 0 |
| South | 2 | 5 | 3 | 0 | 4 |
| West | 6 | 3 | 6 | 10 | 3 |
| U.S. dependent areas | 0 | 0 | 0 | 0 | 0 |
| Subtotal, female aged 50–64 years | 9 | 9 | 9 | 11 | 7 |
| Aged ≥65 years of age at diagnosis | |||||
| Male adult | |||||
| Transmission Categorya | |||||
| Male-to-male sexual contact | 1 | 0 | 1 | 1 | 3 |
| Injection drug use | 0 | 0 | 0 | 1 | 0 |
| Male-to-male sexual contact and injection drug use | 0 | 0 | 0 | 1 | 0 |
| Heterosexual contactb | 0 | 0 | 2 | 0 | 0 |
| Otherc | 0 | 0 | 0 | 0 | 0 |
| Region of residenced | |||||
| Northeast | 0 | 0 | 0 | 1 | 0 |
| Midwest | 0 | 0 | 0 | 0 | 0 |
| South | 0 | 0 | 1 | 1 | 2 |
| West | 1 | 0 | 2 | 1 | 1 |
| U.S. dependent areas | 0 | 0 | 0 | 0 | 0 |
| Subtotal, male aged ≥65 years | 1 | 0 | 3 | 3 | 3 |
| Female adult | |||||
| Transmission Categorya | |||||
| Injection drug use | 0 | 0 | 0 | 1 | 0 |
| Heterosexual contactb | 0 | 1 | 1 | 0 | 0 |
| Otherc | 0 | 0 | 0 | 0 | 0 |
| Region of residenced | |||||
| Northeast | 0 | 0 | 0 | 0 | 0 |
| Midwest | 0 | 0 | 0 | 0 | 0 |
| South | 0 | 0 | 0 | 1 | 0 |
| West | 0 | 1 | 1 | 0 | 0 |
| U.S. dependent areas | 0 | 0 | 0 | 0 | 0 |
| Subtotal, female aged ≥65 years | 0 | 1 | 1 | 1 | 0 |
| Aged ≥50 years of age at diagnosis | |||||
| Male adult | |||||
| Transmission Categorya | |||||
| Male-to-male sexual contact | 10 | 8 | 11 | 13 | 15 |
| Injection drug use | 3 | 2 | 4 | 5 | 3 |
| Male-to-male sexual contact and injection drug use | 2 | 0 | 2 | 2 | 1 |
| Heterosexual contactb | 1 | 3 | 3 | 1 | 4 |
| Otherc | 0 | 0 | 0 | 0 | 0 |
| Region of residenced | |||||
| Northeast | 1 | 1 | 0 | 1 | 1 |
| Midwest | 1 | 2 | 3 | 3 | 4 |
| South | 8 | 4 | 3 | 7 | 7 |
| West | 7 | 7 | 14 | 10 | 11 |
| U.S. dependent areas | 0 | 0 | 0 | 0 | 0 |
| Subtotal, male ≥50 years of age | 17 | 14 | 20 | 21 | 23 |
| Female adult | |||||
| Transmission Categorya | |||||
| Injection drug use | 1 | 3 | 5 | 3 | 2 |
| Heterosexual contactb | 8 | 7 | 5 | 9 | 5 |
| Otherc | 0 | 0 | 0 | 0 | 0 |
| Region of residenced | |||||
| Northeast | 0 | 0 | 0 | 0 | 0 |
| Midwest | 1 | 1 | 0 | 1 | 0 |
| South | 2 | 5 | 3 | 1 | 4 |
| West | 6 | 4 | 7 | 10 | 3 |
| U.S. dependent areas | 0 | 0 | 0 | 0 | 0 |
| Subtotal, female ≥50 years of age | 9 | 10 | 10 | 12 | 7 |
| Total, ≥50 years of age at diagnosis | 26 | 24 | 30 | 33 | 30 |
Asian
| Asian | |||||
|---|---|---|---|---|---|
| 2014 | 2015 | 2016 | 2017 | 2018 | |
| No. | No. | No. | No. | No. | |
| Aged 50–64 years of age at diagnosis | |||||
| Male adult | |||||
| Transmission Categorya | |||||
| Male-to-male sexual contact | 49 | 55 | 61 | 62 | 51 |
| Injection drug use | 2 | 4 | 4 | 2 | 3 |
| Male-to-male sexual contact and injection drug use | 3 | 1 | 1 | 0 | 1 |
| Heterosexual contactb | 11 | 11 | 12 | 9 | 13 |
| Otherc | 0 | 0 | 0 | 0 | 1 |
| Region of residenced | |||||
| Northeast | 18 | 14 | 14 | 14 | 19 |
| Midwest | 3 | 8 | 13 | 3 | 5 |
| South | 11 | 14 | 18 | 14 | 14 |
| West | 32 | 35 | 34 | 42 | 30 |
| U.S. dependent areas | 1 | 0 | 0 | 0 | 0 |
| Subtotal, male aged 50–64 years | 65 | 71 | 79 | 73 | 68 |
| Female adult | |||||
| Transmission Categorya | |||||
| Injection drug use | 3 | 2 | 1 | 2 | 1 |
| Heterosexual contactb | 21 | 18 | 21 | 28 | 22 |
| Otherc | 0 | 0 | 0 | 1 | 0 |
| Region of residenced | |||||
| Northeast | 1 | 5 | 5 | 6 | 11 |
| Midwest | 4 | 3 | 1 | 2 | 0 |
| South | 4 | 4 | 4 | 8 | 7 |
| West | 15 | 8 | 12 | 14 | 5 |
| U.S. dependent areas | 0 | 0 | 0 | 0 | 0 |
| Subtotal, female aged 50–64 years | 24 | 20 | 22 | 30 | 23 |
| Aged ≥65 years of age at diagnosis | |||||
| Male adult | |||||
| Transmission Categorya | |||||
| Male-to-male sexual contact | 8 | 5 | 10 | 8 | 10 |
| Injection drug use | 1 | 1 | 1 | 0 | 1 |
| Male-to-male sexual contact and injection drug use | 0 | 0 | 1 | 0 | 0 |
| Heterosexual contactb | 6 | 4 | 6 | 2 | 6 |
| Otherc | 0 | 0 | 1 | 1 | 0 |
| Region of residenced | |||||
| Northeast | 5 | 3 | 6 | 1 | 4 |
| Midwest | 2 | 0 | 3 | 2 | 0 |
| South | 1 | 1 | 3 | 4 | 4 |
| West | 7 | 6 | 7 | 4 | 9 |
| U.S. dependent areas | 0 | 0 | 0 | 0 | 0 |
| Subtotal, male aged ≥65 years | 15 | 10 | 19 | 11 | 17 |
| Female adult | |||||
| Transmission Categorya | |||||
| Injection drug use | 0 | 0 | 0 | 0 | 0 |
| Heterosexual contactb | 1 | 4 | 5 | 5 | 7 |
| Otherc | 0 | 1 | 0 | 0 | 0 |
| Region of residenced | |||||
| Northeast | 1 | 0 | 2 | 1 | 2 |
| Midwest | 0 | 0 | 1 | 1 | 0 |
| South | 0 | 2 | 0 | 2 | 2 |
| West | 0 | 3 | 2 | 1 | 3 |
| U.S. dependent areas | 0 | 0 | 0 | 0 | 0 |
| Subtotal, female aged ≥65 years | 1 | 5 | 5 | 5 | 7 |
| Aged ≥50 years of age at diagnosis | |||||
| Male adult | |||||
| Transmission Categorya | |||||
| Male-to-male sexual contact | 57 | 60 | 72 | 70 | 61 |
| Injection drug use | 3 | 5 | 5 | 2 | 4 |
| Male-to-male sexual contact and injection drug use | 3 | 1 | 2 | 0 | 1 |
| Heterosexual contactb | 16 | 14 | 18 | 11 | 19 |
| Otherc | 1 | 1 | 1 | 1 | 1 |
| Region of residenced | |||||
| Northeast | 23 | 17 | 20 | 15 | 23 |
| Midwest | 5 | 8 | 16 | 5 | 5 |
| South | 12 | 15 | 21 | 18 | 18 |
| West | 39 | 41 | 41 | 46 | 39 |
| U.S. dependent areas | 1 | 0 | 0 | 0 | 0 |
| Subtotal, male ≥50 years of age | 80 | 81 | 98 | 84 | 85 |
| Female adult | |||||
| Transmission Categorya | |||||
| Injection drug use | 3 | 2 | 1 | 2 | 1 |
| Heterosexual contactb | 22 | 22 | 26 | 33 | 28 |
| Otherc | 0 | 1 | 0 | 1 | 1 |
| Region of residenced | |||||
| Northeast | 2 | 5 | 7 | 7 | 13 |
| Midwest | 4 | 3 | 2 | 3 | 0 |
| South | 4 | 6 | 4 | 10 | 9 |
| West | 15 | 11 | 14 | 15 | 8 |
| U.S. dependent areas | 0 | 0 | 0 | 0 | 0 |
| Subtotal, female ≥50 years of age | 25 | 25 | 27 | 35 | 30 |
| Total, ≥50 years of age at diagnosis | 105 | 106 | 125 | 119 | 115 |
Black/African American
| Black/African American | |||||
|---|---|---|---|---|---|
| 2014 | 2015 | 2016 | 2017 | 2018 | |
| No. | No. | No. | No. | No. | |
| Aged 50–64 years of age at diagnosis | |||||
| Male adult | |||||
| Transmission Categorya | |||||
| Male-to-male sexual contact | 664 | 654 | 681 | 665 | 628 |
| Injection drug use | 180 | 158 | 144 | 136 | 130 |
| Male-to-male sexual contact and injection drug use | 47 | 32 | 30 | 41 | 33 |
| Heterosexual contactb | 563 | 604 | 540 | 518 | 479 |
| Otherc | 3 | 2 | 2 | 3 | 3 |
| Region of residenced | |||||
| Northeast | 321 | 288 | 228 | 255 | 240 |
| Midwest | 152 | 169 | 155 | 174 | 178 |
| South | 856 | 871 | 862 | 796 | 735 |
| West | 122 | 121 | 149 | 137 | 118 |
| U.S. dependent areas | 6 | 0 | 2 | 0 | 2 |
| Subtotal, male aged 50–64 years | 1,457 | 1,449 | 1,396 | 1,362 | 1,273 |
| Female adult | |||||
| Transmission Categorya | |||||
| Injection drug use | 118 | 102 | 119 | 95 | 97 |
| Heterosexual contactb | 847 | 852 | 884 | 847 | 824 |
| Otherc | 1 | 0 | 1 | 1 | 1 |
| Region of residenced | |||||
| Northeast | 190 | 205 | 210 | 187 | 179 |
| Midwest | 90 | 93 | 103 | 100 | 87 |
| South | 616 | 591 | 614 | 583 | 574 |
| West | 67 | 66 | 76 | 73 | 81 |
| U.S. dependent areas | 3 | 0 | 0 | 0 | 0 |
| Subtotal, female aged 50–64 years | 966 | 955 | 1,003 | 943 | 921 |
| Aged ≥65 years of age at diagnosis | |||||
| Male adult | |||||
| Transmission Categorya | |||||
| Male-to-male sexual contact | 79 | 81 | 68 | 69 | 80 |
| Injection drug use | 38 | 30 | 31 | 28 | 33 |
| Male-to-male sexual contact and injection drug use | 5 | 5 | 4 | 4 | 3 |
| Heterosexual contactb | 123 | 106 | 120 | 112 | 108 |
| Otherc | 1 | 1 | 1 | 1 | 2 |
| Region of residenced | |||||
| Northeast | 68 | 50 | 49 | 47 | 38 |
| Midwest | 16 | 23 | 26 | 21 | 25 |
| South | 150 | 132 | 133 | 132 | 147 |
| West | 10 | 17 | 16 | 14 | 17 |
| U.S. dependent areas | 1 | 0 | 0 | 0 | 0 |
| Subtotal, male aged ≥65 years | 245 | 222 | 224 | 214 | 227 |
| Female adult | |||||
| Transmission Categorya | |||||
| Injection drug use | 18 | 14 | 16 | 19 | 17 |
| Heterosexual contactb | 125 | 137 | 123 | 170 | 131 |
| Otherc | 1 | 0 | 0 | 0 | 0 |
| Region of residenced | |||||
| Northeast | 43 | 29 | 19 | 40 | 30 |
| Midwest | 13 | 17 | 9 | 13 | 14 |
| South | 80 | 97 | 98 | 125 | 91 |
| West | 7 | 7 | 13 | 11 | 13 |
| U.S. dependent areas | 0 | 2 | 0 | 0 | 0 |
| Subtotal, female aged ≥65 years | 143 | 152 | 139 | 189 | 148 |
| Aged ≥50 years of age at diagnosis | |||||
| Male adult | |||||
| Transmission Categorya | |||||
| Male-to-male sexual contact | 743 | 735 | 749 | 734 | 708 |
| Injection drug use | 217 | 188 | 175 | 164 | 163 |
| Male-to-male sexual contact and injection drug use | 52 | 36 | 34 | 45 | 37 |
| Heterosexual contactb | 686 | 710 | 660 | 629 | 587 |
| Otherc | 4 | 3 | 3 | 4 | 5 |
| Region of residenced | |||||
| Northeast | 389 | 338 | 277 | 302 | 278 |
| Midwest | 168 | 192 | 181 | 195 | 203 |
| South | 1,006 | 1,003 | 995 | 928 | 882 |
| West | 132 | 138 | 165 | 151 | 135 |
| U.S. dependent areas | 7 | 0 | 2 | 0 | 2 |
| Subtotal, male ≥50 years of age | 1,702 | 1,671 | 1,620 | 1,576 | 1,500 |
| Female adult | |||||
| Transmission Categorya | |||||
| Injection drug use | 136 | 117 | 135 | 114 | 114 |
| Heterosexual contactb | 971 | 990 | 1,006 | 1,017 | 955 |
| Otherc | 2 | 1 | 1 | 1 | 1 |
| Region of residenced | |||||
| Northeast | 233 | 234 | 229 | 227 | 209 |
| Midwest | 103 | 110 | 112 | 113 | 101 |
| South | 696 | 688 | 712 | 708 | 665 |
| West | 74 | 73 | 89 | 84 | 94 |
| U.S. dependent areas | 3 | 2 | 0 | 0 | 0 |
| Subtotal, female ≥50 years of age | 1,109 | 1,107 | 1,142 | 1,132 | 1,069 |
| Total, ≥50 years of age at diagnosis | 2,811 | 2,778 | 2,762 | 2,708 | 2,569 |
Hispanic/Latino
| Hispanic/Latinoe | |||||
|---|---|---|---|---|---|
| 2014 | 2015 | 2016 | 2017 | 2018 | |
| No. | No. | No. | No. | No. | |
| Aged 50–64 years of age at diagnosis | |||||
| Male adult | |||||
| Transmission Categorya | |||||
| Male-to-male sexual contact | 529 | 621 | 629 | 614 | 655 |
| Injection drug use | 95 | 89 | 89 | 91 | 84 |
| Male-to-male sexual contact and injection drug use | 22 | 21 | 28 | 25 | 26 |
| Heterosexual contactb | 174 | 155 | 150 | 140 | 153 |
| Otherc | 1 | 1 | 1 | 1 | 1 |
| Region of residenced | |||||
| Northeast | 154 | 177 | 163 | 136 | 163 |
| Midwest | 40 | 51 | 43 | 41 | 42 |
| South | 349 | 349 | 347 | 364 | 406 |
| West | 197 | 235 | 256 | 255 | 238 |
| U.S. dependent areas | 79 | 75 | 88 | 75 | 70 |
| Subtotal, male aged 50–64 years | 819 | 887 | 897 | 871 | 919 |
| Female adult | |||||
| Transmission Categorya | |||||
| Injection drug use | 39 | 27 | 39 | 31 | 31 |
| Heterosexual contactb | 229 | 236 | 235 | 216 | 254 |
| Otherc | 0 | 0 | 0 | 0 | 0 |
| Region of residenced | |||||
| Northeast | 87 | 86 | 89 | 80 | 81 |
| Midwest | 10 | 10 | 11 | 10 | 12 |
| South | 81 | 95 | 97 | 88 | 118 |
| West | 62 | 45 | 48 | 42 | 50 |
| U.S. dependent areas | 28 | 27 | 29 | 27 | 24 |
| Subtotal, female aged 50–64 years | 268 | 263 | 274 | 247 | 285 |
| Aged ≥65 years of age at diagnosis | |||||
| Male adult | |||||
| Transmission Categorya | |||||
| Male-to-male sexual contact | 60 | 65 | 54 | 75 | 71 |
| Injection drug use | 9 | 15 | 17 | 18 | 11 |
| Male-to-male sexual contact and injection drug use | 2 | 4 | 3 | 2 | 3 |
| Heterosexual contactb | 35 | 47 | 40 | 37 | 40 |
| Otherc | 1 | 1 | 1 | 1 | 1 |
| Region of residenced | |||||
| Northeast | 22 | 36 | 19 | 22 | 21 |
| Midwest | 5 | 4 | 1 | 3 | 13 |
| South | 38 | 51 | 49 | 54 | 41 |
| West | 24 | 21 | 25 | 37 | 35 |
| U.S. dependent areas | 18 | 20 | 21 | 17 | 16 |
| Subtotal, male aged ≥65 years | 107 | 132 | 115 | 133 | 126 |
| Female adult | |||||
| Transmission Categorya | |||||
| Injection drug use | 8 | 6 | 5 | 5 | 4 |
| Heterosexual contactb | 29 | 36 | 42 | 40 | 53 |
| Otherc | 0 | 0 | 0 | 0 | 0 |
| Region of residenced | |||||
| Northeast | 13 | 15 | 22 | 13 | 17 |
| Midwest | 2 | 0 | 0 | 4 | 2 |
| South | 10 | 7 | 15 | 20 | 17 |
| West | 5 | 11 | 8 | 4 | 15 |
| U.S. dependent areas | 7 | 9 | 3 | 4 | 6 |
| Subtotal, female aged ≥65 years | 37 | 42 | 48 | 45 | 57 |
| Aged ≥50 years of age at diagnosis | |||||
| Male adult | |||||
| Transmission Categorya | |||||
| Male-to-male sexual contact | 588 | 686 | 683 | 689 | 726 |
| Injection drug use | 104 | 104 | 106 | 108 | 95 |
| Male-to-male sexual contact and injection drug use | 24 | 26 | 31 | 27 | 29 |
| Heterosexual contactb | 209 | 202 | 191 | 178 | 193 |
| Otherc | 1 | 2 | 2 | 2 | 2 |
| Region of residenced | |||||
| Northeast | 176 | 213 | 182 | 158 | 184 |
| Midwest | 45 | 55 | 44 | 44 | 55 |
| South | 387 | 400 | 396 | 418 | 447 |
| West | 221 | 256 | 281 | 292 | 273 |
| U.S. dependent areas | 97 | 95 | 109 | 92 | 86 |
| Subtotal, male ≥50 years of age | 926 | 1,019 | 1,012 | 1,004 | 1,045 |
| Female adult | |||||
| Transmission Categorya | |||||
| Injection drug use | 46 | 33 | 45 | 36 | 35 |
| Heterosexual contactb | 259 | 272 | 277 | 256 | 307 |
| Otherc | 0 | 0 | 0 | 0 | 0 |
| Region of residenced | |||||
| Northeast | 100 | 101 | 111 | 93 | 98 |
| Midwest | 12 | 10 | 11 | 14 | 14 |
| South | 91 | 102 | 112 | 108 | 135 |
| West | 67 | 56 | 56 | 46 | 65 |
| U.S. dependent areas | 35 | 36 | 32 | 31 | 30 |
| Subtotal, female ≥50 years of age | 305 | 305 | 322 | 292 | 342 |
| Total, ≥50 years of age at diagnosis | 1,231 | 1,324 | 1,334 | 1,296 | 1,387 |
Native Hawaiian/Other Pacific Islander
| Native Hawaiian/Other Pacific Islander | |||||
|---|---|---|---|---|---|
| 2014 | 2015 | 2016 | 2017 | 2018 | |
| No. | No. | No. | No. | No. | |
| Aged 50–64 years of age at diagnosis | |||||
| Male adult | |||||
| Transmission Categorya | |||||
| Male-to-male sexual contact | 1 | 8 | 2 | 3 | 6 |
| Injection drug use | 1 | 0 | 0 | 1 | 0 |
| Male-to-male sexual contact and injection drug use | 0 | 0 | 0 | 0 | 0 |
| Heterosexual contactb | 0 | 2 | 0 | 0 | 1 |
| Otherc | 0 | 0 | 0 | 0 | 0 |
| Region of residenced | |||||
| Northeast | 1 | 0 | 1 | 0 | 1 |
| Midwest | 0 | 0 | 0 | 0 | 0 |
| South | 1 | 2 | 0 | 0 | 0 |
| West | 1 | 7 | 1 | 2 | 5 |
| U.S. dependent areas | 0 | 1 | 1 | 2 | 1 |
| Subtotal, male aged 50–64 years | 3 | 10 | 3 | 4 | 7 |
| Female adult | |||||
| Transmission Categorya | |||||
| Injection drug use | 0 | 0 | 2 | 0 | 0 |
| Heterosexual contactb | 3 | 2 | 2 | 1 | 2 |
| Otherc | 0 | 0 | 0 | 0 | 0 |
| Region of residenced | |||||
| Northeast | 0 | 0 | 0 | 0 | 1 |
| Midwest | 0 | 0 | 0 | 0 | 0 |
| South | 0 | 0 | 1 | 0 | 1 |
| West | 3 | 2 | 3 | 1 | 0 |
| U.S. dependent areas | 0 | 0 | 0 | 0 | 0 |
| Subtotal, female aged 50–64 years | 3 | 2 | 4 | 1 | 2 |
| Aged ≥65 years of age at diagnosis | |||||
| Male adult | |||||
| Transmission Categorya | |||||
| Male-to-male sexual contact | 1 | 0 | 1 | 0 | 1 |
| Injection drug use | 0 | 0 | 0 | 0 | 0 |
| Male-to-male sexual contact and injection drug use | 0 | 0 | 1 | 0 | 0 |
| Heterosexual contactb | 0 | 0 | 0 | 1 | 0 |
| Otherc | 0 | 0 | 0 | 0 | 0 |
| Region of residenced | |||||
| Northeast | 0 | 0 | 0 | 1 | 1 |
| Midwest | 0 | 0 | 0 | 0 | 0 |
| South | 0 | 0 | 1 | 0 | 0 |
| West | 1 | 0 | 1 | 0 | 0 |
| U.S. dependent areas | 0 | 0 | 0 | 0 | 0 |
| Subtotal, male aged ≥65 years | 1 | 0 | 2 | 1 | 1 |
| Female adult | |||||
| Transmission Categorya | |||||
| Injection drug use | 0 | 0 | 0 | 0 | 0 |
| Heterosexual contactb | 0 | 0 | 0 | 0 | 0 |
| Otherc | 0 | 0 | 0 | 0 | 0 |
| Region of residenced | |||||
| Northeast | 0 | 0 | 0 | 0 | 0 |
| Midwest | 0 | 0 | 0 | 0 | 0 |
| South | 0 | 0 | 0 | 0 | 0 |
| West | 0 | 0 | 0 | 0 | 0 |
| U.S. dependent areas | 0 | 0 | 0 | 0 | 0 |
| Subtotal, female aged ≥65 years | 0 | 0 | 0 | 0 | 0 |
| Aged ≥50 years of age at diagnosis | |||||
| Male adult | |||||
| Transmission Categorya | |||||
| Male-to-male sexual contact | 2 | 8 | 3 | 3 | 7 |
| Injection drug use | 1 | 0 | 0 | 1 | 0 |
| Male-to-male sexual contact and injection drug use | 0 | 0 | 1 | 0 | 0 |
| Heterosexual contactb | 0 | 2 | 0 | 1 | 1 |
| Otherc | 0 | 0 | 0 | 0 | 0 |
| Region of residenced | |||||
| Northeast | 1 | 0 | 1 | 1 | 2 |
| Midwest | 0 | 0 | 0 | 0 | 0 |
| South | 1 | 2 | 1 | 0 | 0 |
| West | 2 | 7 | 2 | 2 | 5 |
| U.S. dependent areas | 0 | 1 | 1 | 2 | 1 |
| Subtotal, male ≥50 years of age | 4 | 10 | 5 | 5 | 8 |
| Female adult | |||||
| Transmission Categorya | |||||
| Injection drug use | 0 | 0 | 2 | 0 | 0 |
| Heterosexual contactb | 3 | 2 | 2 | 1 | 2 |
| Otherc | 0 | 0 | 0 | 0 | 0 |
| Region of residenced | |||||
| Northeast | 0 | 0 | 0 | 0 | 1 |
| Midwest | 0 | 0 | 0 | 0 | 0 |
| South | 0 | 0 | 1 | 0 | 1 |
| West | 3 | 2 | 3 | 1 | 0 |
| U.S. dependent areas | 0 | 0 | 0 | 0 | 0 |
| Subtotal, female ≥50 years of age | 3 | 2 | 4 | 1 | 2 |
| Total, ≥50 years of age at diagnosis | 7 | 12 | 9 | 6 | 10 |
White
| White | |||||
|---|---|---|---|---|---|
| 2014 | 2015 | 2016 | 2017 | 2018 | |
| No. | No. | No. | No. | No. | |
| Aged 50–64 years of age at diagnosis | |||||
| Male adult | |||||
| Transmission Categorya | |||||
| Male-to-male sexual contact | 1,493 | 1,479 | 1,434 | 1,380 | 1,236 |
| Injection drug use | 100 | 108 | 96 | 95 | 106 |
| Male-to-male sexual contact and injection drug use | 83 | 108 | 85 | 76 | 76 |
| Heterosexual contactb | 146 | 125 | 163 | 142 | 127 |
| Otherc | 1 | 3 | 1 | 2 | 2 |
| Region of residenced | |||||
| Northeast | 304 | 275 | 273 | 223 | 218 |
| Midwest | 290 | 290 | 334 | 283 | 263 |
| South | 757 | 778 | 716 | 752 | 702 |
| West | 471 | 478 | 457 | 437 | 362 |
| U.S. dependent areas | 1 | 2 | 0 | 0 | 2 |
| Subtotal, male aged 50–64 years | 1,823 | 1,823 | 1,780 | 1,695 | 1,547 |
| Female adult | |||||
| Transmission Categorya | |||||
| Injection drug use | 54 | 77 | 73 | 80 | 79 |
| Heterosexual contactb | 209 | 228 | 247 | 243 | 211 |
| Otherc | 1 | 1 | 2 | 1 | 2 |
| Region of residenced | |||||
| Northeast | 45 | 52 | 39 | 58 | 41 |
| Midwest | 33 | 48 | 52 | 54 | 40 |
| South | 135 | 149 | 158 | 150 | 146 |
| West | 51 | 57 | 73 | 62 | 65 |
| U.S. dependent areas | 0 | 0 | 0 | 1 | 0 |
| Subtotal, female aged 50–64 years | 264 | 306 | 322 | 325 | 292 |
| Aged ≥65 years of age at diagnosis | |||||
| Male adult | |||||
| Transmission Categorya | |||||
| Male-to-male sexual contact | 207 | 192 | 200 | 184 | 210 |
| Injection drug use | 13 | 9 | 16 | 16 | 7 |
| Male-to-male sexual contact and injection drug use | 3 | 4 | 8 | 8 | 6 |
| Heterosexual contactb | 37 | 48 | 43 | 34 | 31 |
| Otherc | 3 | 3 | 3 | 3 | 2 |
| Region of residenced | |||||
| Northeast | 56 | 39 | 48 | 36 | 42 |
| Midwest | 33 | 32 | 26 | 43 | 36 |
| South | 108 | 117 | 123 | 109 | 113 |
| West | 65 | 69 | 73 | 57 | 66 |
| U.S. dependent areas | 0 | 0 | 0 | 0 | 0 |
| Subtotal, male aged ≥65 years | 262 | 257 | 270 | 245 | 257 |
| Female adult | |||||
| Transmission Categorya | |||||
| Injection drug use | 6 | 5 | 8 | 5 | 6 |
| Heterosexual contactb | 16 | 25 | 23 | 24 | 25 |
| Otherc | 1 | 1 | 1 | 1 | 2 |
| Region of residenced | |||||
| Northeast | 5 | 9 | 13 | 5 | 5 |
| Midwest | 4 | 4 | 3 | 2 | 5 |
| South | 4 | 11 | 15 | 18 | 16 |
| West | 9 | 7 | 1 | 5 | 7 |
| U.S. dependent areas | 1 | 0 | 0 | 0 | 0 |
| Subtotal, female aged ≥65 years | 23 | 31 | 32 | 30 | 33 |
| Aged ≥50 years of age at diagnosis | |||||
| Male adult | |||||
| Transmission Categorya | |||||
| Male-to-male sexual contact | 1,700 | 1,672 | 1,634 | 1,564 | 1,446 |
| Injection drug use | 113 | 117 | 112 | 111 | 113 |
| Male-to-male sexual contact and injection drug use | 85 | 113 | 93 | 85 | 82 |
| Heterosexual contactb | 183 | 173 | 206 | 175 | 158 |
| Otherc | 4 | 6 | 5 | 5 | 5 |
| Region of residenced | |||||
| Northeast | 360 | 314 | 321 | 259 | 260 |
| Midwest | 323 | 322 | 360 | 326 | 299 |
| South | 865 | 895 | 839 | 861 | 815 |
| West | 536 | 547 | 530 | 494 | 428 |
| U.S. dependent areas | 1 | 2 | 0 | 0 | 2 |
| Subtotal, male ≥50 years of age | 2,085 | 2,080 | 2,050 | 1,940 | 1,804 |
| Female adult | |||||
| Transmission Categorya | |||||
| Injection drug use | 61 | 82 | 81 | 85 | 86 |
| Heterosexual contactb | 225 | 253 | 270 | 268 | 236 |
| Otherc | 2 | 2 | 3 | 2 | 3 |
| Region of residenced | |||||
| Northeast | 50 | 61 | 52 | 63 | 46 |
| Midwest | 37 | 52 | 55 | 56 | 45 |
| South | 139 | 160 | 173 | 168 | 162 |
| West | 60 | 64 | 74 | 67 | 72 |
| U.S. dependent areas | 1 | 0 | 0 | 1 | 0 |
| Subtotal, female ≥50 years of age | 287 | 337 | 354 | 355 | 325 |
| Total, ≥50 years of age at diagnosis | 2,372 | 2,417 | 2,404 | 2,295 | 2,129 |
Multiple Races
| Multiple Races | |||||
|---|---|---|---|---|---|
| 2014 | 2015 | 2016 | 2017 | 2018 | |
| No. | No. | No. | No. | No. | |
| Aged 50–64 years of age at diagnosis | |||||
| Male adult | |||||
| Transmission Categorya | |||||
| Male-to-male sexual contact | 89 | 84 | 81 | 73 | 46 |
| Injection drug use | 12 | 12 | 12 | 5 | 10 |
| Male-to-male sexual contact and injection drug use | 7 | 4 | 8 | 9 | 3 |
| Heterosexual contactb | 24 | 23 | 21 | 17 | 11 |
| Otherc | 0 | 1 | 1 | 0 | 0 |
| Region of residenced | |||||
| Northeast | 37 | 37 | 27 | 26 | 20 |
| Midwest | 10 | 11 | 20 | 10 | 7 |
| South | 56 | 50 | 51 | 49 | 31 |
| West | 29 | 25 | 24 | 20 | 12 |
| U.S. dependent areas | 0 | 0 | 0 | 0 | 0 |
| Subtotal, male aged 50–64 years | 132 | 123 | 122 | 105 | 70 |
| Female adult | |||||
| Transmission Categorya | |||||
| Injection drug use | 11 | 13 | 10 | 7 | 7 |
| Heterosexual contactb | 35 | 41 | 32 | 25 | 22 |
| Otherc | 0 | 0 | 0 | 0 | 0 |
| Region of residenced | |||||
| Northeast | 9 | 15 | 9 | 13 | 10 |
| Midwest | 4 | 5 | 6 | 2 | 1 |
| South | 25 | 27 | 24 | 12 | 10 |
| West | 8 | 6 | 3 | 5 | 8 |
| U.S. dependent areas | 0 | 0 | 0 | 0 | 0 |
| Subtotal, female aged 50–64 years | 46 | 53 | 42 | 32 | 29 |
| Aged ≥65 years of age at diagnosis | |||||
| Male adult | |||||
| Transmission Categorya | |||||
| Male-to-male sexual contact | 10 | 13 | 8 | 5 | 10 |
| Injection drug use | 2 | 4 | 1 | 0 | 1 |
| Male-to-male sexual contact and injection drug use | 0 | 1 | 0 | 0 | 0 |
| Heterosexual contactb | 6 | 7 | 2 | 4 | 3 |
| Otherc | 0 | 0 | 0 | 0 | 0 |
| Region of residenced | |||||
| Northeast | 6 | 6 | 4 | 3 | 6 |
| Midwest | 1 | 4 | 1 | 2 | 1 |
| South | 9 | 12 | 5 | 5 | 4 |
| West | 2 | 2 | 1 | 0 | 2 |
| U.S. dependent areas | 0 | 0 | 0 | 0 | 0 |
| Subtotal, male aged ≥65 years | 18 | 24 | 11 | 10 | 13 |
| Female adult | |||||
| Transmission Categorya | |||||
| Injection drug use | 2 | 1 | 1 | 0 | 2 |
| Heterosexual contactb | 3 | 4 | 8 | 5 | 9 |
| Otherc | 0 | 0 | 0 | 0 | 0 |
| Region of residenced | |||||
| Northeast | 2 | 2 | 2 | 2 | 2 |
| Midwest | 0 | 0 | 2 | 0 | 0 |
| South | 3 | 2 | 5 | 2 | 5 |
| West | 0 | 1 | 0 | 1 | 4 |
| U.S. dependent areas | 0 | 0 | 0 | 0 | 0 |
| Subtotal, female aged ≥65 years | 5 | 5 | 9 | 5 | 11 |
| Aged ≥50 years of age at diagnosis | |||||
| Male adult | |||||
| Transmission Categorya | |||||
| Male-to-male sexual contact | 99 | 97 | 89 | 79 | 55 |
| Injection drug use | 14 | 15 | 12 | 5 | 11 |
| Male-to-male sexual contact and injection drug use | 7 | 5 | 8 | 9 | 3 |
| Heterosexual contactb | 29 | 30 | 22 | 22 | 14 |
| Otherc | 0 | 1 | 1 | 0 | 0 |
| Region of residenced | |||||
| Northeast | 43 | 43 | 31 | 29 | 26 |
| Midwest | 11 | 15 | 21 | 12 | 8 |
| South | 65 | 62 | 56 | 54 | 35 |
| West | 31 | 27 | 25 | 20 | 14 |
| U.S. dependent areas | 0 | 0 | 0 | 0 | 0 |
| Subtotal, male ≥50 years of age | 150 | 147 | 133 | 115 | 83 |
| Female adult | |||||
| Transmission Categorya | |||||
| Injection drug use | 13 | 14 | 11 | 7 | 9 |
| Heterosexual contactb | 38 | 44 | 41 | 30 | 31 |
| Otherc | 0 | 0 | 0 | 0 | 0 |
| Region of residenced | |||||
| Northeast | 11 | 17 | 11 | 15 | 12 |
| Midwest | 4 | 5 | 8 | 2 | 1 |
| South | 28 | 29 | 29 | 14 | 15 |
| West | 8 | 7 | 3 | 6 | 12 |
| U.S. dependent areas | 0 | 0 | 0 | 0 | 0 |
| Subtotal, female ≥50 years of age | 51 | 58 | 51 | 37 | 40 |
| Total, ≥50 years of age at diagnosis | 201 | 205 | 184 | 152 | 123 |
Note. Numbers less than 12, and trends based on these numbers, should be interpreted with caution.
aData have been statistically adjusted to account for missing transmission category; therefore, values may not sum to the column subtotals and total.
bHeterosexual contact with a person known to have, or to be at high risk for, HIV infection.
cIncludes hemophilia, blood transfusion, and risk factor not reported or not identified.
dData are based on residence at time of diagnosis of HIV infection.
eHispanics/Latinos can be of any race.
| 2017 | 2018 | |||||||||||
|---|---|---|---|---|---|---|---|---|---|---|---|---|
| 50–64 years at diagnosis | ≥65 years at diagnosis | Total | 50–64 years at diagnosis | ≥65 years at diagnosis | Total | |||||||
| No. | Ratea | No. | Ratea | No. | Ratea | No. | Ratea | No. | Ratea | No. | Ratea | |
| Alabama | 85 | 8.7 | 8 | 1.0 | 93 | 5.2 | 71 | 7.3 | 11 | 1.3 | 82 | 4.6 |
| Alaska | 4 | 2.8 | 0 | 0.0 | 4 | 1.8 | 4 | 2.9 | 0 | 0.0 | 4 | 1.8 |
| Arizona | 112 | 8.8 | 13 | 1.1 | 125 | 5.0 | 103 | 8.0 | 11 | 0.9 | 114 | 4.5 |
| Arkansas | 30 | 5.2 | 3 | 0.6 | 33 | 3.1 | 31 | 5.4 | 4 | 0.8 | 35 | 3.2 |
| California | 679 | 9.3 | 86 | 1.6 | 765 | 6.0 | 593 | 8.1 | 119 | 2.1 | 712 | 5.5 |
| Colorado | 58 | 5.5 | 7 | 0.9 | 65 | 3.6 | 46 | 4.4 | 7 | 0.9 | 53 | 2.8 |
| Connecticut | 54 | 7.0 | 11 | 1.8 | 65 | 4.7 | 52 | 6.7 | 8 | 1.3 | 60 | 4.3 |
| Delaware | 16 | 8.1 | 3 | 1.7 | 19 | 5.1 | 23 | 11.5 | 6 | 3.3 | 29 | 7.6 |
| District of Columbia | 37 | 34.3 | 14 | 16.7 | 51 | 26.6 | 42 | 39.3 | 9 | 10.6 | 51 | 26.5 |
| Florida | 783 | 18.6 | 166 | 3.9 | 949 | 11.3 | 790 | 18.6 | 136 | 3.1 | 926 | 10.8 |
| Georgia | 359 | 18.3 | 56 | 4.0 | 415 | 12.3 | 324 | 16.4 | 56 | 3.8 | 380 | 11.0 |
| Hawaii | 17 | 6.3 | 2 | 0.8 | 19 | 3.6 | 13 | 4.9 | 0 | 0.0 | 13 | 2.5 |
| Idaho | 9 | 2.9 | 0 | 0.0 | 9 | 1.6 | 8 | 2.6 | 2 | 0.7 | 10 | 1.7 |
| Illinois | 164 | 6.5 | 32 | 1.6 | 196 | 4.4 | 189 | 7.6 | 23 | 1.2 | 212 | 4.7 |
| Indiana | 72 | 5.5 | 8 | 0.8 | 80 | 3.4 | 65 | 5.0 | 9 | 0.9 | 74 | 3.2 |
| Iowa | 24 | 3.9 | 2 | 0.4 | 26 | 2.3 | 13 | 2.1 | 3 | 0.6 | 16 | 1.4 |
| Kansas | 11 | 2.0 | 2 | 0.4 | 13 | 1.3 | 19 | 3.5 | 3 | 0.6 | 22 | 2.2 |
| Kentucky | 54 | 6.0 | 6 | 0.8 | 60 | 3.7 | 46 | 5.2 | 7 | 1.0 | 53 | 3.3 |
| Louisiana | 136 | 15.1 | 23 | 3.3 | 159 | 9.9 | 126 | 14.1 | 12 | 1.7 | 138 | 8.6 |
| Maine | 6 | 1.9 | 1 | 0.4 | 7 | 1.2 | 4 | 1.3 | 1 | 0.4 | 5 | 0.9 |
| Maryland | 158 | 12.8 | 37 | 4.1 | 195 | 9.1 | 163 | 13.2 | 27 | 2.9 | 190 | 8.8 |
| Massachusetts | 88 | 6.2 | 13 | 1.2 | 101 | 4.0 | 122 | 8.6 | 19 | 1.7 | 141 | 5.5 |
| Michigan | 102 | 4.9 | 12 | 0.7 | 114 | 3.0 | 92 | 4.5 | 20 | 1.2 | 112 | 3.0 |
| Minnesota | 50 | 4.5 | 5 | 0.6 | 55 | 2.8 | 28 | 2.5 | 6 | 0.7 | 34 | 1.7 |
| Mississippi | 53 | 9.2 | 9 | 1.9 | 62 | 6.0 | 61 | 10.7 | 10 | 2.1 | 71 | 6.8 |
| Missouri | 68 | 5.6 | 11 | 1.1 | 79 | 3.5 | 61 | 5.0 | 8 | 0.8 | 69 | 3.1 |
| Montana | 5 | 2.3 | 0 | 0.0 | 5 | 1.2 | 2 | 0.9 | 1 | 0.5 | 3 | 0.7 |
| Nebraska | 8 | 2.2 | 1 | 0.3 | 9 | 1.4 | 12 | 3.4 | 1 | 0.3 | 13 | 2.0 |
| Nevada | 77 | 13.7 | 6 | 1.3 | 83 | 8.2 | 59 | 10.3 | 12 | 2.5 | 71 | 6.8 |
| New Hampshire | 7 | 2.2 | 1 | 0.4 | 8 | 1.5 | 4 | 1.3 | 1 | 0.4 | 5 | 0.9 |
| New Jersey | 217 | 11.7 | 35 | 2.5 | 252 | 7.7 | 194 | 10.5 | 29 | 2.0 | 223 | 6.8 |
| New Mexico | 21 | 5.2 | 3 | 0.8 | 24 | 3.2 | 14 | 3.5 | 3 | 0.8 | 17 | 2.2 |
| New York | 437 | 11.1 | 75 | 2.4 | 512 | 7.2 | 413 | 10.6 | 86 | 2.7 | 499 | 7.0 |
| North Carolina | 200 | 10.0 | 28 | 1.7 | 228 | 6.3 | 195 | 9.6 | 28 | 1.7 | 223 | 6.0 |
| North Dakota | 8 | 5.8 | 0 | 0.0 | 8 | 3.2 | 3 | 2.2 | 1 | 0.9 | 4 | 1.6 |
| Ohio | 133 | 5.6 | 16 | 0.8 | 149 | 3.4 | 118 | 5.0 | 13 | 0.7 | 131 | 3.0 |
| Oklahoma | 46 | 6.3 | 9 | 1.5 | 55 | 4.1 | 28 | 3.9 | 6 | 1.0 | 34 | 2.5 |
| Oregon | 27 | 3.4 | 3 | 0.4 | 30 | 2.0 | 27 | 3.4 | 7 | 0.9 | 34 | 2.2 |
| Pennsylvania | 163 | 6.1 | 34 | 1.5 | 197 | 4.0 | 175 | 6.6 | 22 | 0.9 | 197 | 3.9 |
| Rhode Island | 22 | 9.9 | 1 | 0.6 | 23 | 5.7 | 17 | 7.6 | 1 | 0.5 | 18 | 4.4 |
| South Carolina | 113 | 11.3 | 15 | 1.7 | 128 | 6.9 | 96 | 9.6 | 18 | 2.0 | 114 | 6.0 |
| South Dakota | 4 | 2.4 | 0 | 0.0 | 4 | 1.3 | 10 | 6.0 | 0 | 0.0 | 10 | 3.2 |
| Tennessee | 93 | 7.0 | 20 | 1.9 | 113 | 4.7 | 95 | 7.2 | 21 | 1.9 | 116 | 4.8 |
| Texas | 536 | 10.9 | 56 | 1.6 | 592 | 7.1 | 533 | 10.8 | 71 | 2.0 | 604 | 7.1 |
| Utah | 19 | 4.3 | 4 | 1.2 | 23 | 2.9 | 15 | 3.3 | 2 | 0.6 | 17 | 2.1 |
| Vermont | 4 | 2.8 | 1 | 0.9 | 5 | 1.9 | 4 | 2.9 | 1 | 0.8 | 5 | 1.9 |
| Virginia | 116 | 6.9 | 20 | 1.6 | 136 | 4.6 | 121 | 7.2 | 19 | 1.4 | 140 | 4.7 |
| Washington | 78 | 5.5 | 11 | 1.0 | 89 | 3.5 | 103 | 7.3 | 8 | 0.7 | 111 | 4.3 |
| West Virginia | 7 | 1.8 | 0 | 0.0 | 7 | 1.0 | 8 | 2.1 | 1 | 0.3 | 9 | 1.2 |
| Wisconsin | 39 | 3.2 | 2 | 0.2 | 41 | 1.9 | 29 | 2.4 | 9 | 0.9 | 38 | 1.7 |
| Wyoming | 3 | 2.6 | 0 | 0.0 | 3 | 1.5 | 0 | 0.0 | 0 | 0.0 | 0 | 0.0 |
| Subtotal | 5,612 | 8.9 | 871 | 1.7 | 6,483 | 5.7 | 5,364 | 8.5 | 878 | 1.7 | 6,242 | 5.4 |
| U.S. dependent areas | ||||||||||||
| American Samoa | 0 | 0.0 | 0 | 0.0 | 0 | 0.0 | 0 | 0.0 | 0 | 0.0 | 0 | 0.0 |
| Guam | 2 | 7.4 | 0 | 0.0 | 2 | 4.8 | 2 | 7.4 | 0 | 0.0 | 2 | 4.7 |
| Northern Mariana Islands | 0 | 0.0 | 0 | 0.0 | 0 | 0.0 | 0 | 0.0 | 0 | 0.0 | 0 | 0.0 |
| Puerto Rico | 102 | 15.6 | 21 | 3.2 | 123 | 9.4 | 95 | 14.8 | 22 | 3.3 | 117 | 9.0 |
| Republic of Palau | 0 | 0.0 | 0 | 0.0 | 0 | 0.0 | 0 | 0.0 | 0 | 0.0 | 0 | 0.0 |
| U.S. Virgin Islands | 1 | 4.4 | 0 | 0.0 | 1 | 2.4 | 2 | 8.9 | 0 | 0.0 | 2 | 4.8 |
| Subtotal | 105 | 14.4 | 21 | 3.0 | 126 | 8.9 | 99 | 13.8 | 22 | 3.1 | 121 | 8.5 |
| Total | 5,717 | 8.9 | 892 | 1.7 | 6,609 | 5.7 | 5,463 | 8.6 | 900 | 1.7 | 6,363 | 5.4 |
Note. Data are based on residence at time of diagnosis of HIV infection. Numbers less than 12, and rates based on these numbers, should be interpreted with caution.
aRates are per 100,000 population.
| 2014 | 2015 | 2016 | 2017 | 2018 | ||||||
|---|---|---|---|---|---|---|---|---|---|---|
| No. | Ratea | No. | Ratea | No. | Ratea | No. | Ratea | No. | Ratea | |
| Gender | ||||||||||
| Male | 318,343 | – | 340,296 | – | 360,202 | – | 378,348 | – | 395,565 | – |
| Female | 93,568 | – | 100,715 | – | 107,595 | – | 114,109 | – | 120,765 | – |
| Transgender male-to-femaleb | 1,419 | – | 1,569 | – | 1,725 | – | 1,924 | – | 2,104 | – |
| Transgender female-to-maleb | 68 | – | 79 | – | 91 | – | 96 | – | 100 | – |
| Additional gender identityc | 26 | – | 27 | – | 31 | – | 32 | – | 34 | – |
| Age at end of year (yr) | ||||||||||
| 50–54 | 163,186 | 724.7 | 166,612 | 748.3 | 167,011 | 765.7 | 163,471 | 765.8 | 158,278 | 757.9 |
| 55–59 | 118,865 | 553.8 | 127,938 | 588.4 | 136,131 | 620.1 | 144,797 | 659.4 | 153,473 | 699.5 |
| 60–64 | 71,989 | 388.5 | 79,336 | 417.1 | 87,775 | 451.0 | 96,359 | 483.2 | 104,620 | 514.6 |
| 65–69 | 35,094 | 229.4 | 40,966 | 255.5 | 46,720 | 278.0 | 52,441 | 312.1 | 58,508 | 342.4 |
| 70–74 | 15,071 | 136.3 | 17,064 | 148.9 | 19,545 | 165.6 | 22,884 | 178.4 | 26,873 | 200.5 |
| 75–79 | 6,061 | 76.6 | 6,999 | 86.3 | 8,070 | 96.5 | 9,478 | 108.6 | 10,884 | 117.4 |
| 80–84 | 2,206 | 38.4 | 2,582 | 44.6 | 3,005 | 51.2 | 3,463 | 58.1 | 4,032 | 65.8 |
| ≥85 | 952 | 15.5 | 1,189 | 19.0 | 1,387 | 21.7 | 1,616 | 25.0 | 1,900 | 29.0 |
| Race/Ethnicity | ||||||||||
| American Indian/Alaska Native | 944 | 142.2 | 1,018 | 148.9 | 1,105 | 157.7 | 1,193 | 166.5 | 1,283 | 175.5 |
| Asiand | 3,548 | 74.2 | 3,975 | 79.5 | 4,415 | 84.7 | 4,917 | 90.8 | 5,410 | 96.1 |
| Black/African American | 159,291 | 1,420.4 | 169,937 | 1,475.3 | 179,845 | 1,525.5 | 189,049 | 1,572.0 | 197,919 | 1,614.8 |
| Hispanic/Latinoe | 75,712 | 723.9 | 82,528 | 751.0 | 89,100 | 774.0 | 95,483 | 793.7 | 101,947 | 810.8 |
| Native Hawaiian/other Pacific Islander | 238 | 186.1 | 266 | 197.8 | 287 | 204.0 | 308 | 209.9 | 332 | 217.5 |
| White | 154,117 | 191.4 | 164,168 | 201.7 | 173,088 | 210.9 | 180,889 | 218.8 | 188,197 | 226.3 |
| Multiple races | 19,025 | 2,027.0 | 20,217 | 2,076.9 | 21,207 | 2,107.7 | 22,051 | 2,123.8 | 22,838 | 2,132.5 |
| Transmission Categoryf | ||||||||||
| Male adultg | ||||||||||
| Male-to-male sexual contact | 201,778 | – | 218,732 | – | 234,296 | – | 248,732 | – | 262,541 | – |
| Injection drug use | 50,821 | – | 51,787 | – | 52,476 | – | 52,978 | – | 53,357 | – |
| Male-to-male sexual contact and injection drug use | 26,744 | – | 28,253 | – | 29,529 | – | 30,712 | – | 31,587 | – |
| Heterosexual contacth | 39,179 | – | 41,809 | – | 44,300 | – | 46,483 | – | 48,772 | – |
| Otheri | 1,257 | – | 1,302 | – | 1,347 | – | 1,388 | – | 1,434 | – |
| Subtotal | 319,779 | 631.5 | 341,883 | 662.2 | 361,948 | 689.7 | 380,293 | 714.3 | 397,692 | 736.7 |
| Female adultg | ||||||||||
| Injection drug use | 27,575 | – | 28,973 | – | 30,187 | – | 31,208 | – | 32,146 | – |
| Heterosexual contacth | 65,166 | – | 70,907 | – | 76,569 | – | 82,061 | – | 87,776 | – |
| Otheri | 904 | – | 923 | – | 940 | – | 947 | – | 954 | – |
| Subtotal | 93,645 | 161.3 | 100,803 | 170.7 | 107,696 | 179.6 | 114,216 | 187.9 | 120,876 | 196.2 |
| Region of residencej | ||||||||||
| Northeast | 115,116 | 566.6 | 121,378 | 589.4 | 127,786 | 614.0 | 132,569 | 631.3 | 137,470 | 649.6 |
| Midwest | 44,713 | 187.6 | 47,850 | 198.4 | 51,137 | 210.0 | 54,163 | 220.4 | 56,935 | 229.8 |
| South | 170,182 | 421.6 | 183,578 | 444.8 | 194,995 | 463.2 | 206,619 | 482.2 | 217,882 | 499.7 |
| West | 83,413 | 345.2 | 89,880 | 363.8 | 95,726 | 380.2 | 101,158 | 394.9 | 106,281 | 408.0 |
| Totalk | 413,424 | 380.4 | 442,686 | 399.9 | 469,644 | 417.7 | 494,509 | 433.6 | 518,568 | 448.6 |
Note. Data for the year 2018 are considered preliminary and are based on death data reported to the Centers for Disease Control and Prevention through December 2019.
aRates are per 100,000 population. Rates are not calculated by gender or transmission category because of the lack of denominator data.
b“Transgender male-to-female” includes individuals who were assigned “male” sex at birth but have ever identified as “female” gender. “Transgender female-to-male” includes individuals who were assigned “female” sex at birth but have ever identified as “male” gender.
cAdditional gender identity examples include “bigender,” “gender queer,” and “two-spirit.”
dIncludes Asian/Pacific Islander legacy cases.
eHispanics/Latinos can be of any race.
fData have been statistically adjusted to account for missing transmission category; therefore, values may not sum to the column subtotals and total.
gData presented based on sex at birth and include transgender persons.
hHeterosexual contact with a person known to have, or to be at high risk for, HIV infection.
iIncludes hemophilia, blood transfusion, and risk factor not reported or not identified.
jData are based on address of residence at the end of the specified year (i.e., most recent known address).
kIncludes persons whose race/ethnicity is unknown.
| 2014 | 2015 | 2016 | 2017 | 2018 | ||||||
|---|---|---|---|---|---|---|---|---|---|---|
| No. | Ratea | No. | Ratea | No. | Ratea | No. | Ratea | No. | Ratea | |
| Gender | ||||||||||
| Male | 324,095 | – | 346,363 | – | 366,572 | – | 384,968 | – | 402,438 | – |
| Female | 96,180 | – | 103,475 | – | 110,461 | – | 117,034 | – | 123,784 | – |
| Transgender male-to-femaleb | 1,423 | – | 1,573 | – | 1,730 | – | 1,930 | – | 2,110 | – |
| Transgender female-to-maleb | 68 | – | 79 | – | 91 | – | 96 | – | 100 | – |
| Additional gender identityc | 26 | – | 27 | – | 31 | – | 32 | – | 34 | – |
| Age at end of year (yr) | ||||||||||
| 50–54 | 166,289 | 729.9 | 169,712 | 753.5 | 170,064 | 770.6 | 166,422 | 770.5 | 161,131 | 762.6 |
| 55–59 | 121,210 | 558.2 | 130,405 | 593.0 | 138,713 | 624.8 | 147,471 | 664.1 | 156,237 | 704.3 |
| 60–64 | 73,436 | 391.5 | 80,916 | 420.4 | 89,517 | 454.7 | 98,212 | 486.9 | 106,641 | 518.7 |
| 65–69 | 35,871 | 231.2 | 41,875 | 257.7 | 47,722 | 280.4 | 53,525 | 314.6 | 59,663 | 345.0 |
| 70–74 | 15,487 | 138.0 | 17,516 | 150.6 | 20,036 | 167.3 | 23,434 | 180.1 | 27,496 | 202.3 |
| 75–79 | 6,234 | 77.6 | 7,199 | 87.4 | 8,293 | 97.7 | 9,750 | 110.0 | 11,176 | 118.9 |
| 80–84 | 2,274 | 39.0 | 2,655 | 45.2 | 3,102 | 52.1 | 3,572 | 59.0 | 4,157 | 66.8 |
| ≥85 | 991 | 15.9 | 1,239 | 19.5 | 1,438 | 22.2 | 1,674 | 25.5 | 1,965 | 29.6 |
| Race/Ethnicity | ||||||||||
| American Indian/Alaska Native | 945 | – | 1,019 | – | 1,106 | – | 1,195 | – | 1,285 | – |
| Asiand | 3,570 | – | 3,999 | – | 4,444 | – | 4,947 | – | 5,444 | – |
| Black/African American | 159,450 | – | 170,099 | – | 180,015 | – | 189,224 | – | 198,110 | – |
| Hispanic/Latinoe | 83,843 | – | 91,114 | – | 98,077 | – | 104,752 | – | 111,544 | – |
| Native Hawaiian/other Pacific Islander | 243 | – | 271 | – | 293 | – | 319 | – | 344 | – |
| White | 154,161 | – | 164,214 | – | 173,139 | – | 180,943 | – | 188,250 | – |
| Multiple races | 19,030 | – | 20,223 | – | 21,213 | – | 22,060 | – | 22,846 | – |
| Transmission Categoryf | ||||||||||
| Male adultg | ||||||||||
| Male-to-male sexual contact | 203,521 | – | 220,598 | – | 236,331 | – | 250,902 | – | 264,865 | – |
| Injection drug use | 52,935 | – | 53,985 | – | 54,752 | – | 55,307 | – | 55,725 | – |
| Male-to-male sexual contact and injection drug use | 27,179 | – | 28,723 | – | 30,002 | – | 31,189 | – | 32,066 | – |
| Heterosexual contacth | 40,636 | – | 43,338 | – | 45,882 | – | 48,123 | – | 50,471 | – |
| Otheri | 1,264 | – | 1,311 | – | 1,356 | – | 1,398 | – | 1,444 | – |
| Subtotal | 325,535 | 635.0 | 347,954 | 665.8 | 368,323 | 693.5 | 386,919 | 718.1 | 404,571 | 740.7 |
| Female adultg | ||||||||||
| Injection drug use | 28,148 | – | 29,566 | – | 30,793 | – | 31,827 | – | 32,778 | – |
| Heterosexual contacth | 67,200 | – | 73,067 | – | 78,824 | – | 84,362 | – | 90,158 | – |
| Otheri | 910 | – | 930 | – | 946 | – | 953 | – | 960 | – |
| Subtotal | 96,257 | 163.7 | 103,563 | 173.1 | 110,562 | 182.0 | 117,141 | 190.2 | 123,895 | 198.6 |
| Region of residencej | ||||||||||
| Northeast | 115,116 | 566.6 | 121,378 | 589.4 | 127,786 | 614.0 | 132,569 | 631.3 | 137,470 | 649.6 |
| Midwest | 44,713 | 187.6 | 47,850 | 198.4 | 51,137 | 210.0 | 54,163 | 220.4 | 56,935 | 229.8 |
| South | 170,182 | 421.6 | 183,578 | 444.8 | 194,995 | 463.2 | 206,619 | 482.2 | 217,882 | 499.7 |
| West | 83,413 | 345.2 | 89,880 | 363.8 | 95,726 | 380.2 | 101,158 | 394.9 | 106,281 | 408.0 |
| U.S. dependent areas | 8,368 | 602.7 | 8,831 | 629.5 | 9,241 | 652.8 | 9,551 | 671.4 | 9,898 | 697.7 |
| Totalk | 421,792 | 383.2 | 451,517 | 402.8 | 478,885 | 420.6 | 504,060 | 436.5 | 528,466 | 451.7 |
Note. Data for the year 2018 are considered preliminary and are based on death data reported to the Centers for Disease Control and Prevention through December 2019.
aRates are per 100,000 population. Rates by race/ethnicity are not provided because U.S. census information for U.S. dependent areas is limited. Rates are not calculated by gender or transmission category because of the lack of denominator data.
b“Transgender male-to-female” includes individuals who were assigned “male” sex at birth but have ever identified as “female” gender. “Transgender female-to-male” includes individuals who were assigned “female” sex at birth but have ever identified as “male” gender.
cAdditional gender identity examples include “bigender,” “gender queer,” and “two-spirit.”
dIncludes Asian/Pacific Islander legacy cases.
eHispanics/Latinos can be of any race.
fData have been statistically adjusted to account for missing transmission category; therefore, values may not sum to the column subtotals and total.
gData presented based on sex at birth and include transgender persons.
hHeterosexual contact with a person known to have, or to be at high risk for, HIV infection.
iIncludes hemophilia, blood transfusion, and risk factor not reported or not identified.
jData are based on address of residence at the end of the specified year (i.e., most recent known address).
kIncludes persons whose race/ethnicity is unknown.
| 2014 | 2015 | 2016 | 2017 | 2018 | ||||||
|---|---|---|---|---|---|---|---|---|---|---|
| No. | Ratea | No. | Ratea | No. | Ratea | No. | Ratea | No. | Ratea | |
| Male adult | ||||||||||
| Age at end of year (yr) | ||||||||||
| 50–54 | 126,347 | 1,143.4 | 128,813 | 1,178.7 | 128,715 | 1,201.1 | 125,510 | 1,196.0 | 120,648 | 1,173.9 |
| 55–59 | 91,314 | 876.4 | 98,299 | 930.5 | 104,623 | 980.5 | 111,341 | 1,042.8 | 118,215 | 1,108.0 |
| 60–64 | 55,892 | 631.0 | 61,267 | 674.1 | 67,527 | 725.9 | 73,945 | 775.5 | 79,995 | 822.2 |
| 65–69 | 27,504 | 380.1 | 32,012 | 422.4 | 36,388 | 458.9 | 40,631 | 513.4 | 45,179 | 562.3 |
| 70–74 | 11,728 | 230.3 | 13,313 | 251.9 | 15,243 | 279.7 | 17,872 | 300.9 | 20,923 | 336.9 |
| 75–79 | 4,650 | 132.6 | 5,393 | 149.6 | 6,225 | 167.2 | 7,265 | 186.5 | 8,348 | 201.4 |
| 80–84 | 1,647 | 69.3 | 1,915 | 79.5 | 2,221 | 90.5 | 2,568 | 102.4 | 3,003 | 115.9 |
| ≥85 | 697 | 33.2 | 871 | 40.2 | 1,006 | 45.1 | 1,161 | 50.9 | 1,381 | 59.4 |
| Race/Ethnicity | ||||||||||
| American Indian/Alaska Native | 679 | 219.3 | 724 | 227.3 | 788 | 241.5 | 854 | 256.5 | 925 | 272.6 |
| Asianb | 2,897 | 135.7 | 3,261 | 146.0 | 3,622 | 155.7 | 4,028 | 166.7 | 4,438 | 176.6 |
| Black/African American | 105,484 | 2,142.6 | 111,914 | 2,211.8 | 117,808 | 2,274.8 | 123,088 | 2,330.8 | 128,001 | 2,379.0 |
| Hispanic/Latinoc | 58,300 | 1,188.0 | 63,750 | 1,233.4 | 68,994 | 1,271.7 | 74,132 | 1,305.5 | 79,299 | 1,334.0 |
| Native Hawaiian/other Pacific Islander | 190 | 308.3 | 212 | 327.3 | 229 | 338.3 | 248 | 351.5 | 269 | 366.8 |
| White | 137,311 | 362.6 | 146,198 | 381.4 | 153,938 | 397.9 | 160,750 | 412.4 | 166,974 | 425.6 |
| Multiple races | 14,507 | 3,330.1 | 15,390 | 3,407.4 | 16,121 | 3,455.0 | 16,726 | 3,476.0 | 17,304 | 3,489.2 |
| Region of residenced | ||||||||||
| Northeast | 81,706 | 874.8 | 85,807 | 905.1 | 90,105 | 939.4 | 93,227 | 962.7 | 96,332 | 986.3 |
| Midwest | 36,678 | 328.8 | 39,264 | 347.4 | 41,832 | 366.2 | 44,167 | 383.0 | 46,172 | 396.8 |
| South | 127,576 | 681.5 | 137,381 | 717.3 | 145,542 | 744.7 | 153,764 | 772.9 | 161,742 | 799.1 |
| West | 73,819 | 646.1 | 79,431 | 679.5 | 84,469 | 708.6 | 89,135 | 734.8 | 93,446 | 757.3 |
| Subtotal, male adulte | 319,779 | 631.5 | 341,883 | 662.2 | 361,948 | 689.7 | 380,293 | 714.3 | 397,692 | 736.7 |
| Female adult | ||||||||||
| Age at end of year (yr) | ||||||||||
| 50–54 | 36,839 | 321.2 | 37,799 | 333.4 | 38,296 | 345.2 | 37,961 | 349.8 | 37,630 | 354.8 |
| 55–59 | 27,551 | 249.4 | 29,639 | 265.2 | 31,508 | 279.3 | 33,456 | 296.5 | 35,258 | 312.8 |
| 60–64 | 16,097 | 166.4 | 18,069 | 182.0 | 20,248 | 199.3 | 22,414 | 215.4 | 24,625 | 232.3 |
| 65–69 | 7,590 | 94.1 | 8,954 | 105.9 | 10,332 | 116.4 | 11,810 | 132.9 | 13,329 | 147.2 |
| 70–74 | 3,343 | 56.0 | 3,751 | 60.7 | 4,302 | 67.7 | 5,012 | 72.7 | 5,950 | 82.7 |
| 75–79 | 1,411 | 32.0 | 1,606 | 35.6 | 1,845 | 39.7 | 2,213 | 45.8 | 2,536 | 49.5 |
| 80–84 | 559 | 16.6 | 667 | 19.7 | 784 | 23.0 | 895 | 25.9 | 1,029 | 29.1 |
| ≥85 | 255 | 6.3 | 318 | 7.8 | 381 | 9.2 | 455 | 10.9 | 519 | 12.3 |
| Race/Ethnicity | ||||||||||
| American Indian/Alaska Native | 265 | 74.8 | 294 | 80.5 | 317 | 84.6 | 339 | 88.4 | 358 | 91.4 |
| Asianb | 651 | 24.6 | 714 | 25.8 | 793 | 27.5 | 889 | 29.7 | 972 | 31.2 |
| Black/African American | 53,807 | 855.2 | 58,023 | 898.3 | 62,037 | 938.5 | 65,961 | 977.9 | 69,918 | 1,016.8 |
| Hispanic/Latinoc | 17,412 | 313.7 | 18,778 | 322.6 | 20,106 | 330.3 | 21,351 | 336.2 | 22,648 | 341.7 |
| Native Hawaiian/other Pacific Islander | 48 | 72.4 | 54 | 77.4 | 58 | 79.5 | 60 | 78.8 | 63 | 79.5 |
| White | 16,806 | 39.4 | 17,970 | 41.7 | 19,150 | 44.1 | 20,139 | 46.1 | 21,223 | 48.3 |
| Multiple races | 4,518 | 898.3 | 4,827 | 925.2 | 5,086 | 942.6 | 5,325 | 955.9 | 5,534 | 962.4 |
| Region of residenced | ||||||||||
| Northeast | 33,410 | 304.3 | 35,571 | 320.1 | 37,681 | 335.8 | 39,342 | 347.7 | 41,138 | 361.0 |
| Midwest | 8,035 | 63.3 | 8,586 | 67.0 | 9,305 | 71.9 | 9,996 | 76.6 | 10,763 | 81.9 |
| South | 42,606 | 196.8 | 46,197 | 208.8 | 49,453 | 219.2 | 52,855 | 230.2 | 56,140 | 240.3 |
| West | 9,594 | 75.3 | 10,449 | 80.3 | 11,257 | 84.9 | 12,023 | 89.2 | 12,835 | 93.6 |
| Subtotal, female adulte | 93,645 | 161.3 | 100,803 | 170.7 | 107,696 | 179.6 | 114,216 | 187.9 | 120,876 | 196.2 |
| Totale | 413,424 | 380.4 | 442,686 | 399.9 | 469,644 | 417.7 | 494,509 | 433.6 | 518,568 | 448.6 |
Note. Data for the year 2018 are considered preliminary and are based on death data reported to the Centers for Disease Control and Prevention through December 2019.
aRates are per 100,000 population.
bIncludes Asian/Pacific Islander legacy cases.
cHispanics/Latinos can be of any race.
dData are based on address of residence at the end of the specified year (i.e., most recent known address).
eIncludes persons whose race/ethnicity is unknown.
| 2014 | 2015 | 2016 | 2017 | 2018 | ||||||
|---|---|---|---|---|---|---|---|---|---|---|
| No. | Ratea | No. | Ratea | No. | Ratea | No. | Ratea | No. | Ratea | |
| Male adult | ||||||||||
| Age at end of year (yr) | ||||||||||
| 50–54 | 128,505 | 1,150.2 | 130,958 | 1,185.2 | 130,857 | 1,207.5 | 127,596 | 1,202.3 | 122,694 | 1,180.7 |
| 55–59 | 92,901 | 881.9 | 99,975 | 936.1 | 106,365 | 986.3 | 113,169 | 1,048.7 | 120,127 | 1,114.1 |
| 60–64 | 56,903 | 635.0 | 62,380 | 678.6 | 68,750 | 730.9 | 75,243 | 780.5 | 81,375 | 827.4 |
| 65–69 | 28,023 | 382.1 | 32,616 | 424.9 | 37,075 | 461.9 | 41,375 | 516.6 | 45,975 | 565.6 |
| 70–74 | 12,014 | 232.6 | 13,616 | 254.0 | 15,562 | 281.5 | 18,234 | 302.8 | 21,335 | 338.9 |
| 75–79 | 4,774 | 134.1 | 5,540 | 151.4 | 6,384 | 168.9 | 7,457 | 188.7 | 8,548 | 203.3 |
| 80–84 | 1,693 | 70.2 | 1,966 | 80.5 | 2,290 | 91.9 | 2,644 | 103.9 | 3,093 | 117.6 |
| ≥85 | 722 | 33.9 | 903 | 41.1 | 1,040 | 46.0 | 1,201 | 52.0 | 1,424 | 60.4 |
| Race/ethnicity | ||||||||||
| American Indian/Alaska Native | 680 | – | 725 | – | 789 | – | 856 | – | 927 | – |
| Asianb | 2,915 | – | 3,281 | – | 3,646 | – | 4,053 | – | 4,467 | – |
| Black/African American | 105,586 | – | 112,018 | – | 117,914 | – | 123,195 | – | 128,120 | – |
| Hispanic/Latinoc | 63,889 | – | 69,647 | – | 75,185 | – | 80,561 | – | 85,967 | – |
| Native Hawaiian/other Pacific Islander | 194 | – | 216 | – | 234 | – | 257 | – | 279 | – |
| White | 137,347 | – | 146,237 | – | 153,980 | – | 160,795 | – | 167,018 | – |
| Multiple races | 14,512 | – | 15,395 | – | 16,126 | – | 16,734 | – | 17,310 | – |
| Region of residenced | ||||||||||
| Northeast | 81,706 | 874.8 | 85,807 | 905.1 | 90,105 | 939.4 | 93,227 | 962.7 | 96,332 | 986.3 |
| Midwest | 36,678 | 328.8 | 39,264 | 347.4 | 41,832 | 366.2 | 44,167 | 383.0 | 46,172 | 396.8 |
| South | 127,576 | 681.5 | 137,381 | 717.3 | 145,542 | 744.7 | 153,764 | 772.9 | 161,742 | 799.1 |
| West | 73,819 | 646.1 | 79,431 | 679.5 | 84,469 | 708.6 | 89,135 | 734.8 | 93,446 | 757.3 |
| U.S. dependent areas | 5,756 | 920.5 | 6,071 | 961.2 | 6,375 | 1,001.0 | 6,626 | 1,034.8 | 6,879 | 1,075.2 |
| Subtotal, male adulte | 325,535 | 635.0 | 347,954 | 665.8 | 368,323 | 693.5 | 386,919 | 718.1 | 404,571 | 740.7 |
| Female adult | ||||||||||
| Age at end of year (yr) | ||||||||||
| 50–54 | 37,784 | 325.5 | 38,754 | 337.7 | 39,207 | 349.1 | 38,826 | 353.4 | 38,437 | 358.0 |
| 55–59 | 28,309 | 253.2 | 30,430 | 269.0 | 32,348 | 283.4 | 34,302 | 300.5 | 36,110 | 316.7 |
| 60–64 | 16,533 | 168.7 | 18,536 | 184.4 | 20,767 | 202.0 | 22,969 | 218.1 | 25,266 | 235.6 |
| 65–69 | 7,848 | 95.9 | 9,259 | 108.0 | 10,647 | 118.4 | 12,150 | 134.9 | 13,688 | 149.4 |
| 70–74 | 3,473 | 57.3 | 3,900 | 62.2 | 4,474 | 69.4 | 5,200 | 74.4 | 6,161 | 84.4 |
| 75–79 | 1,460 | 32.6 | 1,659 | 36.3 | 1,909 | 40.5 | 2,293 | 46.7 | 2,628 | 50.6 |
| 80–84 | 581 | 17.0 | 689 | 20.1 | 812 | 23.5 | 928 | 26.5 | 1,064 | 29.6 |
| ≥85 | 269 | 6.6 | 336 | 8.1 | 398 | 9.5 | 473 | 11.1 | 541 | 12.7 |
| Race/ethnicity | ||||||||||
| American Indian/Alaska Native | 265 | – | 294 | – | 317 | – | 339 | – | 358 | – |
| Asianb | 655 | – | 718 | – | 798 | – | 894 | – | 977 | – |
| Black/African American | 53,864 | – | 58,081 | – | 62,101 | – | 66,029 | – | 69,990 | – |
| Hispanic/Latinoc | 19,954 | – | 21,467 | – | 22,892 | – | 24,191 | – | 25,577 | – |
| Native Hawaiian/other Pacific Islander | 49 | – | 55 | – | 59 | – | 62 | – | 65 | – |
| White | 16,814 | – | 17,977 | – | 19,159 | – | 20,148 | – | 21,232 | – |
| Multiple races | 4,518 | – | 4,828 | – | 5,087 | – | 5,326 | – | 5,536 | – |
| Region of residenced | ||||||||||
| Northeast | 33,410 | 304.3 | 35,571 | 320.1 | 37,681 | 335.8 | 39,342 | 347.7 | 41,138 | 361.0 |
| Midwest | 8,035 | 63.3 | 8,586 | 67.0 | 9,305 | 71.9 | 9,996 | 76.6 | 10,763 | 81.9 |
| South | 42,606 | 196.8 | 46,197 | 208.8 | 49,453 | 219.2 | 52,855 | 230.2 | 56,140 | 240.3 |
| West | 9,594 | 75.3 | 10,449 | 80.3 | 11,257 | 84.9 | 12,023 | 89.2 | 12,835 | 93.6 |
| U.S. dependent areas | 2,612 | 342.2 | 2,760 | 357.9 | 2,866 | 368.0 | 2,925 | 374.0 | 3,019 | 387.6 |
| Subtotal, female adulte | 96,257 | 163.7 | 103,563 | 173.1 | 110,562 | 182.0 | 117,141 | 190.2 | 123,895 | 198.6 |
| Totale | 421,792 | 383.2 | 451,517 | 402.8 | 478,885 | 420.6 | 504,060 | 436.5 | 528,466 | 451.7 |
Note. Data for the year 2018 are considered preliminary and are based on death data reported to the Centers for Disease Control and Prevention through December 2019.
aRates are per 100,000 population. Rates by race/ethnicity are not provided because U.S. census information for U.S. dependent areas is limited.
bIncludes Asian/Pacific Islander legacy cases.
cHispanics/Latinos can be of any race.
dData are based on address of residence at the end of the specified year (i.e., most recent known address).
eIncludes persons whose race/ethnicity is unknown.
| 2014 | 2015 | 2016 | 2017 | 2018 | ||||||
|---|---|---|---|---|---|---|---|---|---|---|
| No. | Ratea | No. | Ratea | No. | Ratea | No. | Ratea | No. | Ratea | |
| Aged 50–64 years at year-end | ||||||||||
| Male adult | ||||||||||
| Race/Ethnicity | ||||||||||
| American Indian/Alaska Native | 604 | 294.0 | 644 | 309.5 | 698 | 333.1 | 746 | 354.6 | 786 | 373.5 |
| Asianb | 2,426 | 181.4 | 2,716 | 197.3 | 2,995 | 211.3 | 3,295 | 226.9 | 3,588 | 240.6 |
| Black/African American | 90,635 | 2,731.6 | 94,529 | 2,803.2 | 97,811 | 2,868.9 | 100,372 | 2,922.1 | 102,200 | 2,959.9 |
| Hispanic/Latinoc | 50,652 | 1,494.0 | 54,867 | 1,542.8 | 58,859 | 1,584.9 | 62,521 | 1,617.0 | 66,114 | 1,643.2 |
| Native Hawaiian/other Pacific Islander | 164 | 391.8 | 182 | 419.8 | 191 | 427.7 | 206 | 449.8 | 219 | 468.0 |
| White | 116,069 | 533.9 | 121,816 | 560.7 | 126,200 | 584.5 | 129,199 | 604.1 | 131,226 | 620.9 |
| Multiple races | 12,680 | 4,336.7 | 13,295 | 4,442.9 | 13,778 | 4,517.9 | 14,119 | 4,553.1 | 14,394 | 4,573.7 |
| Transmission Categoryd | ||||||||||
| Male-to-male sexual contact | 173,834 | – | 186,423 | – | 197,295 | – | 206,534 | – | 214,521 | – |
| Injection drug use | 42,637 | – | 42,136 | – | 41,391 | – | 40,315 | – | 38,985 | – |
| Male-to-male sexual contact and injection drug use | 24,239 | – | 25,308 | – | 26,102 | – | 26,706 | – | 26,922 | – |
| Heterosexual contacte | 31,889 | – | 33,543 | – | 35,086 | – | 36,231 | – | 37,416 | – |
| Otherf | 954 | – | 969 | – | 991 | – | 1,011 | – | 1,014 | – |
| Region of residenceg | ||||||||||
| Northeast | 68,196 | 1,213.2 | 70,395 | 1,244.5 | 72,501 | 1,281.6 | 73,457 | 1,302.8 | 74,164 | 1,322.8 |
| Midwest | 32,107 | 475.6 | 34,002 | 502.8 | 35,783 | 531.3 | 37,155 | 555.3 | 38,098 | 574.1 |
| South | 110,477 | 996.7 | 117,433 | 1,046.1 | 122,849 | 1,085.3 | 127,840 | 1,123.4 | 132,152 | 1,156.6 |
| West | 62,773 | 913.5 | 66,549 | 959.2 | 69,732 | 999.4 | 72,344 | 1,033.9 | 74,444 | 1,062.4 |
| Subtotal, male adult aged 50–64 yearsh | 273,553 | 902.0 | 288,379 | 943.0 | 300,865 | 980.4 | 310,796 | 1,012.1 | 318,858 | 1,039.4 |
| Female adult | ||||||||||
| Race/Ethnicity | ||||||||||
| American Indian/Alaska Native | 234 | 103.1 | 249 | 108.1 | 266 | 114.4 | 280 | 119.9 | 288 | 123.3 |
| Asianb | 531 | 33.2 | 560 | 34.1 | 616 | 36.5 | 686 | 39.8 | 735 | 41.5 |
| Black/African American | 46,489 | 1,196.7 | 49,446 | 1,253.5 | 52,107 | 1,307.7 | 54,337 | 1,353.9 | 56,556 | 1,402.4 |
| Hispanic/Latinoc | 14,597 | 412.1 | 15,568 | 421.3 | 16,411 | 427.1 | 17,197 | 431.4 | 17,929 | 434.0 |
| Native Hawaiian/other Pacific Islander | 43 | 98.8 | 49 | 108.4 | 50 | 107.1 | 51 | 106.5 | 50 | 102.0 |
| White | 14,493 | 64.2 | 15,319 | 67.9 | 16,154 | 72.1 | 16,724 | 75.4 | 17,321 | 79.0 |
| Multiple races | 3,984 | 1,237.2 | 4,198 | 1,268.6 | 4,331 | 1,279.8 | 4,440 | 1,285.9 | 4,516 | 1,285.2 |
| Transmission Categoryd | ||||||||||
| Injection drug use | 24,702 | – | 25,546 | – | 26,135 | – | 26,352 | – | 26,415 | – |
| Heterosexual contacte | 55,188 | – | 59,375 | – | 63,337 | – | 66,914 | – | 70,557 | – |
| Otherf | 597 | – | 586 | – | 581 | – | 565 | – | 541 | – |
| Region of residenceg | ||||||||||
| Northeast | 28,556 | 475.2 | 29,932 | 495.4 | 31,187 | 516.2 | 31,931 | 530.1 | 32,755 | 546.8 |
| Midwest | 7,043 | 100.2 | 7,418 | 105.4 | 7,972 | 113.7 | 8,401 | 120.6 | 8,918 | 129.2 |
| South | 36,775 | 307.4 | 39,412 | 325.4 | 41,559 | 340.5 | 43,688 | 356.3 | 45,572 | 370.5 |
| West | 8,113 | 112.8 | 8,745 | 120.6 | 9,334 | 128.2 | 9,811 | 134.5 | 10,268 | 140.9 |
| Subtotal, female adult aged 50–64 yearsh | 80,487 | 250.0 | 85,507 | 263.6 | 90,052 | 276.8 | 93,831 | 288.3 | 97,513 | 300.2 |
| Both sexes | ||||||||||
| Race/Ethnicity | ||||||||||
| American Indian/Alaska Native | 838 | 193.8 | 893 | 203.7 | 964 | 218.1 | 1,026 | 231.1 | 1,074 | 241.9 |
| Asianb | 2,957 | 100.7 | 3,276 | 108.6 | 3,611 | 116.4 | 3,981 | 125.3 | 4,323 | 132.6 |
| Black/African American | 137,124 | 1,903.8 | 143,975 | 1,967.8 | 149,918 | 2,027.6 | 154,709 | 2,077.1 | 158,756 | 2,120.8 |
| Hispanic/Latinoc | 65,249 | 941.2 | 70,435 | 971.3 | 75,270 | 996.2 | 79,718 | 1,015.2 | 84,043 | 1,030.6 |
| Native Hawaiian/other Pacific Islander | 207 | 242.4 | 231 | 260.8 | 241 | 263.9 | 257 | 274.3 | 269 | 280.7 |
| White | 130,562 | 294.6 | 137,135 | 309.7 | 142,354 | 323.6 | 145,923 | 334.9 | 148,547 | 345.1 |
| Multiple races | 16,664 | 2,712.2 | 17,493 | 2,775.9 | 18,109 | 2,814.7 | 18,559 | 2,831.8 | 18,910 | 2,838.9 |
| Region of residenceg | ||||||||||
| Northeast | 96,752 | 831.9 | 100,327 | 857.6 | 103,688 | 886.3 | 105,388 | 903.7 | 106,919 | 922.0 |
| Midwest | 39,150 | 284.1 | 41,420 | 300.1 | 43,755 | 318.4 | 45,556 | 333.6 | 47,016 | 347.3 |
| South | 147,252 | 639.0 | 156,845 | 672.1 | 164,408 | 698.9 | 171,528 | 725.5 | 177,724 | 749.0 |
| West | 70,886 | 504.1 | 75,294 | 530.6 | 79,066 | 554.5 | 82,155 | 574.9 | 84,712 | 592.6 |
| Subtotal, adult aged 50–64 yearsh | 354,040 | 566.3 | 373,886 | 593.2 | 390,917 | 618.3 | 404,627 | 639.7 | 416,371 | 659.3 |
| Aged ≥65 years at year-end | ||||||||||
| Males | ||||||||||
| Race/Ethnicity | ||||||||||
| American Indian/Alaska Native | 75 | 72.0 | 80 | 72.4 | 90 | 77.1 | 108 | 88.1 | 139 | 107.8 |
| Asianb | 471 | 59.0 | 545 | 63.6 | 627 | 69.0 | 733 | 76.0 | 850 | 83.2 |
| Black/African American | 14,849 | 925.1 | 17,385 | 1,030.1 | 19,997 | 1,130.2 | 22,716 | 1,230.5 | 25,801 | 1,338.5 |
| Hispanic/Latinoc | 7,648 | 504.1 | 8,883 | 550.9 | 10,135 | 592.1 | 11,611 | 640.9 | 13,185 | 686.4 |
| Native Hawaiian/other Pacific Islander | 26 | 131.6 | 30 | 140.1 | 38 | 164.9 | 42 | 169.6 | 50 | 188.3 |
| White | 21,242 | 131.7 | 24,382 | 146.8 | 27,738 | 162.2 | 31,551 | 179.3 | 35,748 | 197.5 |
| Multiple races | 1,827 | 1,275.5 | 2,095 | 1,374.4 | 2,343 | 1,449.6 | 2,607 | 1,523.8 | 2,910 | 1,605.8 |
| Transmission Categoryd | ||||||||||
| Male-to-male sexual contact | 27,944 | – | 32,310 | – | 37,001 | – | 42,198 | – | 48,020 | – |
| Injection drug use | 8,185 | – | 9,650 | – | 11,086 | – | 12,663 | – | 14,372 | – |
| Male-to-male sexual contact and injection drug use | 2,505 | – | 2,946 | – | 3,428 | – | 4,006 | – | 4,666 | – |
| Heterosexual contacte | 7,289 | – | 8,266 | – | 9,213 | – | 10,253 | – | 11,356 | – |
| Otherf | 303 | – | 333 | – | 356 | – | 377 | – | 420 | – |
| Region of residenceg | ||||||||||
| Northeast | 13,510 | 363.3 | 15,412 | 403.0 | 17,604 | 447.4 | 19,770 | 488.7 | 22,168 | 532.9 |
| Midwest | 4,571 | 103.7 | 5,262 | 115.9 | 6,049 | 129.1 | 7,012 | 144.8 | 8,074 | 161.5 |
| South | 17,099 | 224.0 | 19,948 | 251.6 | 22,693 | 275.9 | 25,924 | 304.5 | 29,590 | 335.6 |
| West | 11,046 | 242.6 | 12,882 | 271.1 | 14,737 | 298.1 | 16,791 | 327.1 | 19,002 | 356.4 |
| Subtotal, male adult aged ≥65 yearsh | 46,226 | 227.6 | 53,504 | 254.2 | 61,083 | 280.4 | 69,497 | 308.4 | 78,834 | 338.2 |
| Females | ||||||||||
| Race/Ethnicity | ||||||||||
| American Indian/Alaska Native | 31 | 24.3 | 45 | 33.4 | 51 | 35.9 | 59 | 39.4 | 70 | 44.3 |
| Asianb | 120 | 11.5 | 154 | 13.7 | 177 | 14.8 | 203 | 16.0 | 237 | 17.6 |
| Black/African American | 7,318 | 304.0 | 8,577 | 341.1 | 9,930 | 378.2 | 11,624 | 425.6 | 13,362 | 469.9 |
| Hispanic/Latinoc | 2,815 | 140.1 | 3,210 | 151.0 | 3,695 | 164.6 | 4,154 | 175.6 | 4,719 | 189.0 |
| Native Hawaiian/other Pacific Islander | 5 | 22.0 | 5 | 20.4 | 8 | 30.4 | 9 | 31.9 | 13 | 43.0 |
| White | 2,313 | 11.5 | 2,651 | 12.9 | 2,996 | 14.3 | 3,415 | 15.9 | 3,902 | 17.7 |
| Multiple races | 534 | 295.1 | 629 | 329.6 | 755 | 375.4 | 885 | 417.8 | 1,018 | 455.2 |
| Transmission Categoryd | ||||||||||
| Injection drug use | 2,873 | – | 3,427 | – | 4,052 | – | 4,856 | – | 5,731 | – |
| Heterosexual contacte | 9,978 | – | 11,532 | – | 13,232 | – | 15,147 | – | 17,219 | – |
| Otherf | 307 | – | 337 | – | 359 | – | 382 | – | 414 | – |
| Region of residenceg | ||||||||||
| Northeast | 4,854 | 97.7 | 5,639 | 111.2 | 6,494 | 125.4 | 7,411 | 140.1 | 8,383 | 155.0 |
| Midwest | 992 | 17.5 | 1,168 | 20.2 | 1,333 | 22.5 | 1,595 | 26.2 | 1,845 | 29.6 |
| South | 5,831 | 60.2 | 6,785 | 67.8 | 7,894 | 76.2 | 9,167 | 85.7 | 10,568 | 95.6 |
| West | 1,481 | 26.7 | 1,704 | 29.6 | 1,923 | 32.2 | 2,212 | 35.7 | 2,567 | 40.0 |
| Subtotal, female adult aged ≥65 yearsh | 13,158 | 50.9 | 15,296 | 57.5 | 17,644 | 64.3 | 20,385 | 72.1 | 23,363 | 80.2 |
| Both sexes | ||||||||||
| Race/Ethnicity | ||||||||||
| American Indian/Alaska Native | 106 | 45.8 | 125 | 51.0 | 141 | 54.5 | 167 | 61.3 | 209 | 72.8 |
| Asianb | 591 | 32.0 | 699 | 35.3 | 804 | 38.2 | 936 | 41.9 | 1,087 | 45.9 |
| Black/African American | 22,167 | 552.5 | 25,962 | 617.8 | 29,927 | 680.9 | 34,340 | 750.2 | 39,163 | 820.9 |
| Hispanic/Latinoc | 10,463 | 296.7 | 12,093 | 323.5 | 13,830 | 349.6 | 15,765 | 377.4 | 17,904 | 405.2 |
| Native Hawaiian/other Pacific Islander | 31 | 72.9 | 35 | 76.2 | 46 | 93.2 | 51 | 96.2 | 63 | 110.9 |
| White | 23,555 | 65.1 | 27,033 | 72.8 | 30,734 | 80.7 | 34,966 | 89.4 | 39,650 | 98.8 |
| Multiple races | 2,361 | 728.3 | 2,724 | 793.6 | 3,098 | 854.0 | 3,492 | 912.0 | 3,928 | 970.3 |
| Region of residenceg | ||||||||||
| Northeast | 18,364 | 211.4 | 21,051 | 236.7 | 24,098 | 264.4 | 27,181 | 291.1 | 30,551 | 319.3 |
| Midwest | 5,563 | 55.3 | 6,430 | 62.3 | 7,382 | 69.6 | 8,607 | 78.8 | 9,919 | 88.3 |
| South | 22,930 | 132.4 | 26,733 | 149.0 | 30,587 | 164.6 | 35,091 | 182.7 | 40,158 | 202.1 |
| West | 12,527 | 124.0 | 14,586 | 138.7 | 16,660 | 152.6 | 19,003 | 167.8 | 21,569 | 183.5 |
| Subtotal, aged ≥65 yearsh | 59,384 | 128.6 | 68,800 | 144.3 | 78,727 | 159.9 | 89,882 | 177.0 | 102,197 | 194.9 |
| Totalh | 413,424 | 380.4 | 442,686 | 399.9 | 469,644 | 417.7 | 494,509 | 433.6 | 518,568 | 448.6 |
Note. Numbers less than 12, and rates and trends based on these numbers, should be interpreted with caution. Data for the year 2018 are considered preliminary and are based on death data reported to the Centers for Disease Control and Prevention through December 2019.
aRates are per 100,000 population. Rates are not calculated by transmission category because of the lack of denominator data.
bIncludes Asian/Pacific Islander legacy cases.
cHispanics/Latinos can be of any race.
dData have been statistically adjusted to account for missing transmission category; therefore, values may not sum to the column subtotals and total.
eHeterosexual contact with a person known to have, or to be at high risk for, HIV infection.
fIncludes hemophilia, blood transfusion,and risk factor not reported or not identified.
gData are based on address of residence at the end of the specified year (i.e., most recent known address).
hIncludes persons of unknown race/ethnicity.
| 2014 | 2015 | 2016 | 2017 | 2018 | ||||||
|---|---|---|---|---|---|---|---|---|---|---|
| No. | Ratea | No. | Ratea | No. | Ratea | No. | Ratea | No. | Ratea | |
| Aged 50–64 years at year-en | ||||||||||
| Male adult | ||||||||||
| Race/Ethnicity | ||||||||||
| American Indian/Alaska Native | 605 | – | 645 | – | 699 | – | 748 | – | 788 | – |
| Asianb | 2,440 | – | 2,732 | – | 3,015 | – | 3,315 | – | 3,611 | – |
| Black/African American | 90,708 | – | 94,600 | – | 97,882 | – | 100,442 | – | 102,279 | – |
| Hispanic/Latinoc | 55,281 | – | 59,675 | – | 63,835 | – | 67,592 | – | 71,301 | – |
| Native Hawaiian/other Pacific Islander | 168 | – | 185 | – | 194 | – | 213 | – | 227 | – |
| White | 116,098 | – | 121,845 | – | 126,231 | – | 129,233 | – | 131,261 | – |
| Multiple races | 12,685 | – | 13,300 | – | 13,782 | – | 14,126 | – | 14,397 | – |
| Transmission Categoryd | ||||||||||
| Male-to-male sexual contact | 175,306 | – | 187,973 | – | 198,975 | – | 208,308 | – | 216,412 | – |
| Injection drug use | 44,482 | – | 44,020 | – | 43,314 | – | 42,222 | – | 40,883 | – |
| Male-to-male sexual contact and injection drug use | 24,634 | – | 25,727 | – | 26,506 | – | 27,101 | – | 27,301 | – |
| Heterosexual contacte | 32,929 | – | 34,619 | – | 36,181 | – | 37,361 | – | 38,580 | – |
| Otherf | 957 | – | 974 | – | 997 | – | 1,016 | – | 1,019 | – |
| Region of residenceg | ||||||||||
| Northeast | 68,196 | 1,213.2 | 70,395 | 1,244.5 | 72,501 | 1,281.6 | 73,457 | 1,302.8 | 74,164 | 1,322.8 |
| Midwest | 32,107 | 475.6 | 34,002 | 502.8 | 35,783 | 531.3 | 37,155 | 555.3 | 38,098 | 574.1 |
| South | 110,477 | 996.7 | 117,433 | 1,046.1 | 122,849 | 1,085.3 | 127,840 | 1,123.4 | 132,152 | 1,156.6 |
| West | 62,773 | 913.5 | 66,549 | 959.2 | 69,732 | 999.4 | 72,344 | 1,033.9 | 74,444 | 1,062.4 |
| U.S. dependent areas | 4,756 | 1,395.4 | 4,934 | 1,450.9 | 5,107 | 1,506.4 | 5,212 | 1,546.1 | 5,338 | 1,605.1 |
| Subtotal, male adult aged 50–64 yearsh | 278,309 | 907.5 | 293,313 | 948.6 | 305,972 | 986.1 | 316,008 | 1,017.9 | 324,196 | 1,045.5 |
| Female adult | ||||||||||
| Race/Ethnicity | ||||||||||
| American Indian/Alaska Native | 234 | – | 249 | – | 266 | – | 280 | – | 288 | – |
| Asianb | 534 | – | 563 | – | 620 | – | 690 | – | 739 | – |
| Black/African American | 46,532 | – | 49,488 | – | 52,155 | – | 54,388 | – | 56,607 | – |
| Hispanic/Latinoc | 16,683 | – | 17,729 | – | 18,620 | – | 19,397 | – | 20,164 | – |
| Native Hawaiian/other Pacific Islander | 44 | – | 50 | – | 51 | – | 53 | – | 52 | – |
| White | 14,499 | – | 15,324 | – | 16,161 | – | 16,732 | – | 17,328 | – |
| Multiple races | 3,984 | – | 4,199 | – | 4,332 | – | 4,441 | – | 4,517 | – |
| Transmission Categoryd | ||||||||||
| Injection drug use | 25,215 | – | 26,068 | – | 26,662 | – | 26,880 | – | 26,945 | – |
| Heterosexual contacte | 56,813 | – | 61,065 | – | 65,078 | – | 68,650 | – | 72,326 | – |
| Otherf | 597 | – | 587 | – | 582 | – | 566 | – | 542 | – |
| Region of residenceg | ||||||||||
| Northeast | 28,556 | 475.2 | 29,932 | 495.4 | 31,187 | 516.2 | 31,931 | 530.1 | 32,755 | 546.8 |
| Midwest | 7,043 | 100.2 | 7,418 | 105.4 | 7,972 | 113.7 | 8,401 | 120.6 | 8,918 | 129.2 |
| South | 36,775 | 307.4 | 39,412 | 325.4 | 41,559 | 340.5 | 43,688 | 356.3 | 45,572 | 370.5 |
| West | 8,113 | 112.8 | 8,745 | 120.6 | 9,334 | 128.2 | 9,811 | 134.5 | 10,268 | 140.9 |
| U.S. dependent areas | 2,139 | 539.1 | 2,213 | 559.6 | 2,270 | 576.4 | 2,266 | 581.1 | 2,300 | 601.4 |
| Subtotal, female adult aged 50–64 yearsh | 82,626 | 253.6 | 87,720 | 267.1 | 92,322 | 280.4 | 96,097 | 291.8 | 99,813 | 303.7 |
| Both sexes | ||||||||||
| Race/Ethnicity | ||||||||||
| American Indian/Alaska Native | 839 | – | 894 | – | 965 | – | 1,028 | – | 1,076 | – |
| Asianb | 2,974 | – | 3,295 | – | 3,635 | – | 4,005 | – | 4,350 | – |
| Black/African American | 137,240 | – | 144,088 | – | 150,037 | – | 154,830 | – | 158,886 | – |
| Hispanic/Latinoc | 71,964 | – | 77,404 | – | 82,455 | – | 86,989 | – | 91,465 | – |
| Native Hawaiian/other Pacific Islander | 212 | – | 235 | – | 245 | – | 266 | – | 279 | – |
| White | 130,597 | – | 137,169 | – | 142,392 | – | 145,965 | – | 148,589 | – |
| Multiple races | 16,669 | – | 17,499 | – | 18,114 | – | 18,567 | – | 18,914 | – |
| Region of residenceg | ||||||||||
| Northeast | 96,752 | 831.9 | 100,327 | 857.6 | 103,688 | 886.3 | 105,388 | 903.7 | 106,919 | 922.0 |
| Midwest | 39,150 | 284.1 | 41,420 | 300.1 | 43,755 | 318.4 | 45,556 | 333.6 | 47,016 | 347.3 |
| South | 147,252 | 639.0 | 156,845 | 672.1 | 164,408 | 698.9 | 171,528 | 725.5 | 177,724 | 749.0 |
| West | 70,886 | 504.1 | 75,294 | 530.6 | 79,066 | 554.5 | 82,155 | 574.9 | 84,712 | 592.6 |
| U.S. dependent areas | 6,895 | 934.7 | 7,147 | 971.7 | 7,377 | 1,006.6 | 7,478 | 1,028.5 | 7,638 | 1,068.2 |
| Subtotal, adult aged 50–64 yearsh | 360,935 | 570.6 | 381,033 | 597.6 | 398,294 | 622.7 | 412,105 | 644.1 | 424,009 | 663.8 |
| Aged ≥65 years at year-end | ||||||||||
| Males | ||||||||||
| Race/Ethnicity | ||||||||||
| American Indian/Alaska Native | 75 | – | 80 | – | 90 | – | 108 | – | 139 | – |
| Asianb | 475 | – | 549 | – | 631 | – | 738 | – | 856 | – |
| Black/African American | 14,878 | – | 17,418 | – | 20,032 | – | 22,753 | – | 25,841 | – |
| Hispanic/Latinoc | 8,608 | – | 9,972 | – | 11,350 | – | 12,969 | – | 14,666 | – |
| Native Hawaiian/other Pacific Islander | 26 | – | 31 | – | 40 | – | 44 | – | 52 | – |
| White | 21,249 | – | 24,392 | – | 27,749 | – | 31,562 | – | 35,757 | – |
| Multiple races | 1,827 | – | 2,095 | – | 2,344 | – | 2,608 | – | 2,913 | – |
| Transmission Categoryd | ||||||||||
| Male-to-male sexual contact | 28,215 | – | 32,625 | – | 37,356 | – | 42,594 | – | 48,453 | – |
| Injection drug use | 8,453 | – | 9,965 | – | 11,439 | – | 13,085 | – | 14,842 | – |
| Male-to-male sexual contact and injection drug use | 2,545 | – | 2,995 | – | 3,497 | – | 4,088 | – | 4,764 | – |
| Heterosexual contacte | 7,706 | – | 8,720 | – | 9,701 | – | 10,762 | – | 11,891 | – |
| Otherf | 307 | – | 336 | – | 359 | – | 382 | – | 425 | – |
| Region of residenceg | ||||||||||
| Northeast | 13,510 | 363.3 | 15,412 | 403.0 | 17,604 | 447.4 | 19,770 | 488.7 | 22,168 | 532.9 |
| Midwest | 4,571 | 103.7 | 5,262 | 115.9 | 6,049 | 129.1 | 7,012 | 144.8 | 8,074 | 161.5 |
| South | 17,099 | 224.0 | 19,948 | 251.6 | 22,693 | 275.9 | 25,924 | 304.5 | 29,590 | 335.6 |
| West | 11,046 | 242.6 | 12,882 | 271.1 | 14,737 | 298.1 | 16,791 | 327.1 | 19,002 | 356.4 |
| U.S. dependent areas | 1,000 | 351.5 | 1,137 | 390.0 | 1,268 | 425.7 | 1,414 | 466.4 | 1,541 | 501.5 |
| Subtotal, male adult aged ≥65 yearsh | 47,226 | 229.3 | 54,641 | 256.1 | 62,351 | 282.3 | 70,911 | 310.5 | 80,375 | 340.4 |
| Females | ||||||||||
| Race/Ethnicity | ||||||||||
| American Indian/Alaska Native | 31 | – | 45 | – | 51 | – | 59 | – | 70 | – |
| Asianb | 121 | – | 155 | – | 178 | – | 204 | – | 238 | – |
| Black/African American | 7,332 | – | 8,593 | – | 9,946 | – | 11,641 | – | 13,383 | – |
| Hispanic/Latinoc | 3,271 | – | 3,738 | – | 4,272 | – | 4,794 | – | 5,413 | – |
| Native Hawaiian/other Pacific Islander | 5 | – | 5 | – | 8 | – | 9 | – | 13 | – |
| White | 2,315 | – | 2,653 | – | 2,998 | – | 3,416 | – | 3,904 | – |
| Multiple races | 534 | – | 629 | – | 755 | – | 885 | – | 1,019 | – |
| Transmission Categoryd | ||||||||||
| Injection drug use | 2,932 | – | 3,498 | – | 4,131 | – | 4,946 | – | 5,832 | – |
| Heterosexual contacte | 10,386 | – | 12,002 | – | 13,746 | – | 15,711 | – | 17,832 | – |
| Otherf | 313 | – | 343 | – | 364 | – | 387 | – | 418 | – |
| Region of residenceg | ||||||||||
| Northeast | 4,854 | 97.7 | 5,639 | 111.2 | 6,494 | 125.4 | 7,411 | 140.1 | 8,383 | 155.0 |
| Midwest | 992 | 17.5 | 1,168 | 20.2 | 1,333 | 22.5 | 1,595 | 26.2 | 1,845 | 29.6 |
| South | 5,831 | 60.2 | 6,785 | 67.8 | 7,894 | 76.2 | 9,167 | 85.7 | 10,568 | 95.6 |
| West | 1,481 | 26.7 | 1,704 | 29.6 | 1,923 | 32.2 | 2,212 | 35.7 | 2,567 | 40.0 |
| U.S. dependent areas | 473 | 129.1 | 547 | 145.6 | 596 | 154.8 | 659 | 168.0 | 719 | 181.4 |
| Subtotal, female adult aged ≥65 yearsh | 13,631 | 52.0 | 15,843 | 58.7 | 18,240 | 65.6 | 21,044 | 73.4 | 24,082 | 81.6 |
| Both sexes | ||||||||||
| Race/Ethnicity | ||||||||||
| American Indian/Alaska Native | 106 | – | 125 | – | 141 | – | 167 | – | 209 | – |
| Asianb | 596 | – | 704 | – | 809 | – | 942 | – | 1,094 | – |
| Black/African American | 22,210 | – | 26,011 | – | 29,978 | – | 34,394 | – | 39,224 | – |
| Hispanic/Latinoc | 11,879 | – | 13,710 | – | 15,622 | – | 17,763 | – | 20,079 | – |
| Native Hawaiian/other Pacific Islander | 31 | – | 36 | – | 48 | – | 53 | – | 65 | – |
| White | 23,564 | – | 27,045 | – | 30,747 | – | 34,978 | – | 39,661 | – |
| Multiple races | 2,361 | – | 2,724 | – | 3,099 | – | 3,493 | – | 3,932 | – |
| Region of residenceg | ||||||||||
| Northeast | 18,364 | 211.4 | 21,051 | 236.7 | 24,098 | 264.4 | 27,181 | 291.1 | 30,551 | 319.3 |
| Midwest | 5,563 | 55.3 | 6,430 | 62.3 | 7,382 | 69.6 | 8,607 | 78.8 | 9,919 | 88.3 |
| South | 22,930 | 132.4 | 26,733 | 149.0 | 30,587 | 164.6 | 35,091 | 182.7 | 40,158 | 202.1 |
| West | 12,527 | 124.0 | 14,586 | 138.7 | 16,660 | 152.6 | 19,003 | 167.8 | 21,569 | 183.5 |
| U.S. dependent areas | 1,473 | 226.3 | 1,684 | 252.4 | 1,864 | 273.0 | 2,073 | 298.1 | 2,260 | 321.2 |
| Subtotal, aged ≥65 yearsh | 60,857 | 130.0 | 70,484 | 145.8 | 80,591 | 161.5 | 91,955 | 178.6 | 104,457 | 196.6 |
| Totalh | 421,792 | 383.2 | 451,517 | 402.8 | 478,885 | 420.6 | 504,060 | 436.5 | 528,466 | 451.7 |
Note. Numbers less than 12, and rates and trends based on these numbers, should be interpreted with caution. Data for the year 2018 are considered preliminary and are based on death data reported to the Centers for Disease Control and Prevention through December 2019.
aRates are per 100,000 population. Rates are not calculated by transmission category because of the lack of denominator data.
bIncludes Asian/Pacific Islander legacy cases.
cHispanics/Latinos can be of any race.
dData have been statistically adjusted to account for missing transmission category; therefore, values may not sum to the column subtotals and total.
eHeterosexual contact with a person known to have, or to be at high risk for, HIV infection.
fIncludes hemophilia, blood transfusion,and risk factor not reported or not identified.
gData are based on address of residence at the end of the specified year (i.e., most recent known address).
hIncludes persons of unknown race/ethnicity.
| Age at end of year | ||||||||||||||||
|---|---|---|---|---|---|---|---|---|---|---|---|---|---|---|---|---|
| 50–54 | 55–59 | 60–64 | 65–69 | 70–74 | 75–79 | 80–84 | ≥85 | |||||||||
| No. | Ratea | No. | Ratea | No. | Ratea | No. | Ratea | No. | Ratea | No. | Ratea | No. | Ratea | No. | Ratea | |
| Male adult | ||||||||||||||||
| Race/Ethnicity | ||||||||||||||||
| American Indian/Alaska Native | 330 | 458.8 | 290 | 389.7 | 166 | 259.0 | 80 | 161.3 | 34 | 96.2 | 17 | 77.2 | 7 | 56.2 | 1 | 10.5 |
| Asianb | 1,675 | 305.0 | 1,149 | 229.7 | 764 | 172.9 | 463 | 128.1 | 242 | 91.5 | 93 | 51.8 | 36 | 31.3 | 16 | 15.9 |
| Black/African American | 37,566 | 3,096.4 | 37,303 | 3,088.7 | 27,331 | 2,648.6 | 15,301 | 2,006.6 | 6,525 | 1,283.6 | 2,546 | 802.8 | 910 | 482.6 | 519 | 343.7 |
| Hispanic/Latinoc | 28,729 | 1,747.6 | 23,124 | 1,704.8 | 14,261 | 1,393.7 | 7,390 | 1,018.8 | 3,429 | 687.1 | 1,497 | 476.3 | 577 | 287.7 | 292 | 160.6 |
| Native Hawaiian/other Pacific Islander | 96 | 560.7 | 74 | 452.3 | 49 | 368.2 | 30 | 288.4 | 13 | 177.5 | 4 | 93.4 | 3 | 119.4 | 0 | 0.0 |
| White | 46,488 | 696.9 | 50,821 | 686.4 | 33,917 | 480.3 | 20,096 | 331.8 | 9,865 | 203.5 | 3,894 | 118.8 | 1,372 | 66.8 | 521 | 27.9 |
| Multiple races | 5,660 | 5,083.5 | 5,329 | 4,841.2 | 3,405 | 3,649.7 | 1,745 | 2,515.2 | 769 | 1,577.7 | 283 | 935.6 | 89 | 494.2 | 24 | 161.7 |
| Transmission Categoryd | ||||||||||||||||
| Male-to-male sexual contact | 85,721 | – | 79,470 | – | 49,331 | – | 27,286 | – | 13,005 | – | 5,165 | – | 1,833 | – | 731 | – |
| Injection drug use | 10,833 | – | 14,330 | – | 13,822 | – | 8,802 | – | 3,599 | – | 1,302 | – | 424 | – | 245 | – |
| Male-to-male sexual contact and injection drug use | 10,169 | – | 10,302 | – | 6,451 | – | 3,070 | – | 1,133 | – | 339 | – | 83 | – | 41 | – |
| Heterosexual contacte | 13,547 | – | 13,733 | – | 10,137 | – | 5,839 | – | 3,090 | – | 1,478 | – | 630 | – | 319 | – |
| Otherf | 378 | – | 381 | – | 254 | – | 182 | – | 97 | – | 63 | – | 33 | – | 45 | – |
| Region of residenceg | ||||||||||||||||
| Northeast | 26,378 | 1,407.0 | 27,132 | 1,389.0 | 20,654 | 1,161.3 | 12,356 | 865.7 | 5,948 | 548.1 | 2,479 | 342.2 | 891 | 191.1 | 494 | 108.2 |
| Midwest | 14,721 | 685.0 | 14,310 | 615.3 | 9,067 | 419.4 | 4,837 | 274.2 | 2,058 | 158.6 | 825 | 94.4 | 253 | 45.5 | 101 | 19.9 |
| South | 51,280 | 1,321.2 | 48,869 | 1,232.1 | 32,003 | 894.4 | 17,124 | 571.6 | 7,801 | 324.8 | 3,029 | 188.1 | 1,120 | 113.9 | 516 | 62.6 |
| West | 28,269 | 1,191.6 | 27,904 | 1,151.2 | 18,271 | 826.3 | 10,862 | 587.9 | 5,116 | 358.5 | 2,015 | 215.2 | 739 | 126.3 | 270 | 50.4 |
| Subtotal, male adulth | 120,648 | 1,173.9 | 118,215 | 1,108.0 | 79,995 | 822.2 | 45,179 | 562.3 | 20,923 | 336.9 | 8,348 | 201.4 | 3,003 | 115.9 | 1,381 | 59.4 |
| Female adult | ||||||||||||||||
| Race/Ethnicity | ||||||||||||||||
| American Indian/Alaska Native | 109 | 141.1 | 110 | 133.4 | 69 | 93.5 | 46 | 80.4 | 15 | 36.6 | 8 | 30.1 | 1 | 5.9 | 0 | 0.0 |
| Asianb | 289 | 45.6 | 252 | 42.6 | 194 | 35.6 | 134 | 29.0 | 56 | 16.7 | 33 | 14.6 | 5 | 3.3 | 9 | 5.2 |
| Black/African American | 21,900 | 1,588.7 | 20,183 | 1,439.7 | 14,473 | 1,155.7 | 7,773 | 783.5 | 3,311 | 474.8 | 1,387 | 289.2 | 603 | 185.4 | 288 | 82.5 |
| Hispanic/Latinoc | 6,958 | 429.3 | 6,551 | 470.2 | 4,420 | 395.6 | 2,503 | 297.7 | 1,306 | 211.5 | 586 | 137.4 | 221 | 74.9 | 103 | 32.5 |
| Native Hawaiian/other Pacific Islander | 17 | 96.7 | 20 | 116.9 | 13 | 90.6 | 9 | 80.0 | 3 | 38.3 | 0 | 0.0 | 0 | 0.0 | 1 | 31.7 |
| White | 6,503 | 96.3 | 6,483 | 84.6 | 4,335 | 57.8 | 2,193 | 33.2 | 1,028 | 18.9 | 424 | 10.8 | 159 | 5.8 | 98 | 2.9 |
| Multiple races | 1,819 | 1,452.5 | 1,612 | 1,319.4 | 1,085 | 1,043.6 | 642 | 816.3 | 225 | 393.0 | 95 | 252.3 | 39 | 161.3 | 17 | 65.7 |
| Transmission Categoryd | ||||||||||||||||
| Injection drug use | 9,110 | – | 9,989 | – | 7,316 | – | 3,728 | – | 1,318 | – | 455 | – | 144 | – | 86 | – |
| Heterosexual contacte | 28,369 | – | 25,066 | – | 17,122 | – | 9,431 | – | 4,539 | – | 2,013 | – | 848 | – | 389 | – |
| Otherf | 151 | – | 203 | – | 187 | – | 170 | – | 93 | – | 69 | – | 37 | – | 44 | – |
| Region of residenceg | ||||||||||||||||
| Northeast | 11,960 | 604.9 | 12,074 | 580.6 | 8,721 | 451.1 | 4,713 | 292.6 | 2,172 | 168.4 | 929 | 99.1 | 373 | 55.3 | 196 | 21.9 |
| Midwest | 3,650 | 166.9 | 3,211 | 132.7 | 2,057 | 89.6 | 1,106 | 57.3 | 468 | 31.6 | 183 | 16.9 | 65 | 8.4 | 23 | 2.4 |
| South | 18,046 | 444.8 | 16,254 | 382.1 | 11,272 | 282.5 | 6,096 | 176.3 | 2,624 | 93.5 | 1,133 | 57.0 | 481 | 35.9 | 234 | 16.0 |
| West | 3,974 | 166.5 | 3,719 | 147.7 | 2,575 | 108.0 | 1,414 | 68.8 | 686 | 42.5 | 291 | 26.2 | 110 | 14.7 | 66 | 7.4 |
| Subtotal, female adulth | 37,630 | 354.8 | 35,258 | 312.8 | 24,625 | 232.3 | 13,329 | 147.2 | 5,950 | 82.7 | 2,536 | 49.5 | 1,029 | 29.1 | 519 | 12.3 |
| Both sexes | ||||||||||||||||
| Race/Ethnicity | ||||||||||||||||
| American Indian/Alaska Native | 439 | 294.2 | 400 | 255.0 | 235 | 170.4 | 126 | 118.0 | 49 | 64.2 | 25 | 51.4 | 8 | 27.2 | 1 | 3.9 |
| Asianb | 1,964 | 166.0 | 1,401 | 128.4 | 958 | 97.1 | 597 | 72.5 | 298 | 49.7 | 126 | 31.1 | 41 | 15.3 | 25 | 9.2 |
| Black/African American | 59,466 | 2,294.5 | 57,486 | 2,202.9 | 41,804 | 1,830.1 | 23,074 | 1,315.1 | 9,836 | 815.8 | 3,933 | 493.7 | 1,513 | 294.5 | 807 | 161.4 |
| Hispanic/Latinoc | 35,687 | 1,093.1 | 29,675 | 1,079.2 | 18,681 | 872.7 | 9,893 | 631.7 | 4,735 | 424.0 | 2,083 | 281.2 | 798 | 161.0 | 395 | 79.2 |
| Native Hawaiian/other Pacific Islander | 113 | 325.7 | 94 | 280.9 | 62 | 224.2 | 39 | 180.1 | 16 | 105.6 | 4 | 43.8 | 3 | 53.1 | 1 | 19.3 |
| White | 52,991 | 394.7 | 57,304 | 380.3 | 38,252 | 262.8 | 22,289 | 176.0 | 10,893 | 105.9 | 4,318 | 60.0 | 1,531 | 32.1 | 619 | 11.9 |
| Multiple races | 7,479 | 3,161.4 | 6,941 | 2,988.6 | 4,490 | 2,276.1 | 2,387 | 1,612.5 | 994 | 937.8 | 378 | 556.7 | 128 | 303.4 | 41 | 100.7 |
| Region of residenceg | ||||||||||||||||
| Northeast | 38,338 | 995.3 | 39,206 | 972.1 | 29,375 | 791.4 | 17,069 | 561.8 | 8,120 | 341.9 | 3,408 | 205.1 | 1,264 | 110.8 | 690 | 51.1 |
| Midwest | 18,371 | 423.7 | 17,521 | 369.2 | 11,124 | 249.6 | 5,943 | 160.9 | 2,526 | 90.9 | 1,008 | 51.4 | 318 | 23.9 | 124 | 8.4 |
| South | 69,326 | 873.3 | 65,123 | 792.2 | 43,275 | 571.8 | 23,220 | 359.8 | 10,425 | 200.2 | 4,162 | 115.7 | 1,601 | 68.9 | 750 | 32.7 |
| West | 32,243 | 677.5 | 31,623 | 640.0 | 20,846 | 453.7 | 12,276 | 314.6 | 5,802 | 190.7 | 2,306 | 112.6 | 849 | 63.6 | 336 | 23.6 |
| Totalh | 158,278 | 757.9 | 153,473 | 699.5 | 104,620 | 514.6 | 58,508 | 342.4 | 26,873 | 200.5 | 10,884 | 117.4 | 4,032 | 65.8 | 1,900 | 29.0 |
Note. Numbers less than 12, and rates and trends based on these numbers, should be interpreted with caution. Data for the year 2018 are considered preliminary and are based on death data reported to the Centers for Disease Control and Prevention through December 2019.
aRates are per 100,000 population. Rates are not calculated by transmission category because of the lack of denominator data.
bIncludes Asian/Pacific Islander legacy cases.
cHispanics/Latinos can be of any race.
dData have been statistically adjusted to account for missing transmission category; therefore, values may not sum to the column subtotals and total. Heterosexual contact with a person known to have, or to be at high risk for, HIV infection.
eHeterosexual contact with a person known to have, or to be at high risk for, HIV infection.
fIncludes hemophilia, blood transfusion,and risk factor not reported or not identified.
gData are based on address of residence at the end of the specified year (i.e., most recent known address).
hIncludes persons of unknown race/ethnicity.
| Age at end of year | ||||||||||||||||
|---|---|---|---|---|---|---|---|---|---|---|---|---|---|---|---|---|
| 50–54 | 55–59 | 60–64 | 65–69 | 70–74 | 75–79 | 80–84 | ≥85 | |||||||||
| No. | Ratea | No. | Ratea | No. | Ratea | No. | Ratea | No. | Ratea | No. | Ratea | No. | Ratea | No. | Ratea | |
| Male adult | ||||||||||||||||
| Race/Ethnicity | ||||||||||||||||
| American Indian/Alaska Native | 331 | – | 291 | – | 166 | – | 80 | – | 34 | – | 17 | – | 7 | – | 1 | – |
| Asianb | 1,681 | – | 1,164 | – | 766 | – | 465 | – | 244 | – | 95 | – | 36 | – | 16 | – |
| Black/African American | 37,599 | – | 37,328 | – | 27,352 | – | 15,320 | – | 6,540 | – | 2,551 | – | 910 | – | 520 | – |
| Hispanic/Latinoc | 30,717 | – | 24,975 | – | 15,609 | – | 8,156 | – | 3,823 | – | 1,689 | – | 666 | – | 332 | – |
| Native Hawaiian/other Pacific Islander | 99 | – | 78 | – | 50 | – | 32 | – | 13 | – | 4 | – | 3 | – | 0 | – |
| White | 46,502 | – | 50,835 | – | 33,924 | – | 20,100 | – | 9,866 | – | 3,895 | – | 1,373 | – | 523 | – |
| Multiple races | 5,661 | – | 5,331 | – | 3,405 | – | 1,748 | – | 769 | – | 283 | – | 89 | – | 24 | – |
| Transmission Categoryd | ||||||||||||||||
| Male-to-male sexual contact | 86,521 | – | 80,153 | – | 49,738 | – | 27,522 | – | 13,112 | – | 5,221 | – | 1,859 | – | 739 | – |
| Injection drug use | 11,499 | – | 15,017 | – | 14,366 | – | 9,076 | – | 3,734 | – | 1,338 | – | 438 | – | 255 | – |
| Male-to-male sexual contact and injection drug use | 10,304 | – | 10,447 | – | 6,551 | – | 3,141 | – | 1,153 | – | 345 | – | 85 | – | 41 | – |
| Heterosexual contacte | 13,989 | – | 14,128 | – | 10,464 | – | 6,053 | – | 3,237 | – | 1,581 | – | 677 | – | 343 | – |
| Otherf | 382 | – | 382 | – | 255 | – | 183 | – | 99 | – | 63 | – | 34 | – | 46 | – |
| Region of residenceg | ||||||||||||||||
| Northeast | 26,378 | 1,407.0 | 27,132 | 1,389.0 | 20,654 | 1,161.3 | 12,356 | 865.7 | 5,948 | 548.1 | 2,479 | 342.2 | 891 | 191.1 | 494 | 108.2 |
| Midwest | 14,721 | 685.0 | 14,310 | 615.3 | 9,067 | 419.4 | 4,837 | 274.2 | 2,058 | 158.6 | 825 | 94.4 | 253 | 45.5 | 101 | 19.9 |
| South | 51,280 | 1,321.2 | 48,869 | 1,232.1 | 32,003 | 894.4 | 17,124 | 571.6 | 7,801 | 324.8 | 3,029 | 188.1 | 1,120 | 113.9 | 516 | 62.6 |
| West | 28,269 | 1,191.6 | 27,904 | 1,151.2 | 18,271 | 826.3 | 10,862 | 587.9 | 5,116 | 358.5 | 2,015 | 215.2 | 739 | 126.3 | 270 | 50.4 |
| U.S. dependent areas | 2,046 | 1,788.3 | 1,912 | 1,693.8 | 1,380 | 1,311.0 | 796 | 855.3 | 412 | 493.8 | 200 | 338.3 | 90 | 232.5 | 43 | 130.6 |
| Subtotal, male adulth | 122,694 | 1,180.7 | 120,127 | 1,114.1 | 81,375 | 827.4 | 45,975 | 565.6 | 21,335 | 338.9 | 8,548 | 203.3 | 3,093 | 117.6 | 1,424 | 60.4 |
| Female adult | ||||||||||||||||
| Race/Ethnicity | ||||||||||||||||
| American Indian/Alaska Native | 109 | – | 110 | – | 69 | – | 46 | – | 15 | – | 8 | – | 1 | – | 0 | – |
| Asianb | 291 | – | 253 | – | 195 | – | 135 | – | 56 | – | 33 | – | 5 | – | 9 | – |
| Black/African American | 21,923 | – | 20,199 | – | 14,485 | – | 7,782 | – | 3,317 | – | 1,391 | – | 605 | – | 288 | – |
| Hispanic/Latinoc | 7,736 | – | 7,383 | – | 5,045 | – | 2,850 | – | 1,510 | – | 674 | – | 254 | – | 125 | – |
| Native Hawaiian/other Pacific Islander | 18 | – | 21 | – | 13 | – | 9 | – | 3 | – | 0 | – | 0 | – | 1 | – |
| White | 6,505 | – | 6,485 | – | 4,338 | – | 2,194 | – | 1,029 | – | 424 | – | 159 | – | 98 | – |
| Multiple races | 1,820 | – | 1,612 | – | 1,085 | – | 643 | – | 225 | – | 95 | – | 39 | – | 17 | – |
| Transmission Categoryd | ||||||||||||||||
| Injection drug use | 9,294 | – | 10,194 | – | 7,457 | – | 3,793 | – | 1,341 | – | 464 | – | 146 | – | 88 | – |
| Heterosexual contacte | 28,990 | – | 25,712 | – | 17,623 | – | 9,725 | – | 4,726 | – | 2,093 | – | 880 | – | 408 | – |
| Otherf | 152 | – | 203 | – | 187 | – | 170 | – | 94 | – | 71 | – | 37 | – | 45 | – |
| Region of residenceg | ||||||||||||||||
| Northeast | 11,960 | 604.9 | 12,074 | 580.6 | 8,721 | 451.1 | 4,713 | 292.6 | 2,172 | 168.4 | 929 | 99.1 | 373 | 55.3 | 196 | 21.9 |
| Midwest | 3,650 | 166.9 | 3,211 | 132.7 | 2,057 | 89.6 | 1,106 | 57.3 | 468 | 31.6 | 183 | 16.9 | 65 | 8.4 | 23 | 2.4 |
| South | 18,046 | 444.8 | 16,254 | 382.1 | 11,272 | 282.5 | 6,096 | 176.3 | 2,624 | 93.5 | 1,133 | 57.0 | 481 | 35.9 | 234 | 16.0 |
| West | 3,974 | 166.5 | 3,719 | 147.7 | 2,575 | 108.0 | 1,414 | 68.8 | 686 | 42.5 | 291 | 26.2 | 110 | 14.7 | 66 | 7.4 |
| U.S. dependent areas | 807 | 625.0 | 852 | 654.2 | 641 | 520.7 | 359 | 320.9 | 211 | 208.1 | 92 | 123.4 | 35 | 66.6 | 22 | 39.3 |
| Subtotal, female adulth | 38,437 | 358.0 | 36,110 | 316.7 | 25,266 | 235.6 | 13,688 | 149.4 | 6,161 | 84.4 | 2,628 | 50.6 | 1,064 | 29.6 | 541 | 12.7 |
| Both sexes | ||||||||||||||||
| Race/Ethnicity | ||||||||||||||||
| American Indian/Alaska Native | 440 | – | 401 | – | 235 | – | 126 | – | 49 | – | 25 | – | 8 | – | 1 | – |
| Asianb | 1,972 | – | 1,417 | – | 961 | – | 600 | – | 300 | – | 128 | – | 41 | – | 25 | – |
| Black/African American | 59,522 | – | 57,527 | – | 41,837 | – | 23,102 | – | 9,857 | – | 3,942 | – | 1,515 | – | 808 | – |
| Hispanic/Latinoc | 38,453 | – | 32,358 | – | 20,654 | – | 11,006 | – | 5,333 | – | 2,363 | – | 920 | – | 457 | – |
| Native Hawaiian/other Pacific Islander | 117 | – | 99 | – | 63 | – | 41 | – | 16 | – | 4 | – | 3 | – | 1 | – |
| White | 53,007 | – | 57,320 | – | 38,262 | – | 22,294 | – | 10,895 | – | 4,319 | – | 1,532 | – | 621 | – |
| Multiple races | 7,481 | – | 6,943 | – | 4,490 | – | 2,391 | – | 994 | – | 378 | – | 128 | – | 41 | – |
| Region of residenceg | ||||||||||||||||
| Northeast | 38,338 | 995.3 | 39,206 | 972.1 | 29,375 | 791.4 | 17,069 | 561.8 | 8,120 | 341.9 | 3,408 | 205.1 | 1,264 | 110.8 | 690 | 51.1 |
| Midwest | 18,371 | 423.7 | 17,521 | 369.2 | 11,124 | 249.6 | 5,943 | 160.9 | 2,526 | 90.9 | 1,008 | 51.4 | 318 | 23.9 | 124 | 8.4 |
| South | 69,326 | 873.3 | 65,123 | 792.2 | 43,275 | 571.8 | 23,220 | 359.8 | 10,425 | 200.2 | 4,162 | 115.7 | 1,601 | 68.9 | 750 | 32.7 |
| West | 32,243 | 677.5 | 31,623 | 640.0 | 20,846 | 453.7 | 12,276 | 314.6 | 5,802 | 190.7 | 2,306 | 112.6 | 849 | 63.6 | 336 | 23.6 |
| U.S. dependent areas | 2,853 | 1,171.5 | 2,764 | 1,137.0 | 2,021 | 885.0 | 1,155 | 563.6 | 623 | 337.1 | 292 | 218.4 | 125 | 137.0 | 65 | 73.2 |
| Totalh | 161,131 | 762.6 | 156,237 | 704.3 | 106,641 | 518.7 | 59,663 | 345.0 | 27,496 | 202.3 | 11,176 | 118.9 | 4,157 | 66.8 | 1,965 | 29.6 |
Note. Numbers less than 12, and rates and trends based on these numbers, should be interpreted with caution. Data for the year 2018 are considered preliminary and are based on death data reported to the Centers for Disease Control and Prevention through December 2019.
aRates are per 100,000 population. Rates are not calculated by transmission category because of the lack of denominator data.
bIncludes Asian/Pacific Islander legacy cases.
cHispanics/Latinos can be of any race.
dData have been statistically adjusted to account for missing transmission category; therefore, values may not sum to the column subtotals and total. Heterosexual contact with a person known to have, or to be at high risk for, HIV infection.
eHeterosexual contact with a person known to have, or to be at high risk for, HIV infection.
fIncludes hemophilia, blood transfusion,and risk factor not reported or not identified.
gData are based on address of residence at the end of the specified year (i.e., most recent known address).
hIncludes persons of unknown race/ethnicity.
| Area of residence | Aged 50–64 years at year-end 2018 | Aged ≥65 years at year-end 2018 | Total, aged ≥50 years at year-end 2018 | |||
|---|---|---|---|---|---|---|
| No. | Ratea | No. | Ratea | No. | Ratea | |
| Alabama | 4,885 | 503.8 | 1,016 | 122.9 | 5,901 | 328.5 |
| Alaska | 303 | 217.7 | 55 | 63.2 | 358 | 158.3 |
| Arizona | 6,629 | 515.9 | 1,517 | 120.6 | 8,146 | 320.3 |
| Arkansas | 2,109 | 370.7 | 428 | 83.6 | 2,537 | 234.7 |
| California | 55,147 | 757.0 | 14,236 | 251.1 | 69,383 | 535.6 |
| Colorado | 5,432 | 515.8 | 1,553 | 192.1 | 6,985 | 375.3 |
| Connecticut | 5,185 | 671.8 | 1,372 | 223.0 | 6,557 | 472.8 |
| Delaware | 1,546 | 774.2 | 384 | 212.1 | 1,930 | 506.8 |
| District of Columbia | 5,982 | 5,592.3 | 1,614 | 1,892.1 | 7,596 | 3,950.7 |
| Florida | 47,359 | 1,114.6 | 12,265 | 281.4 | 59,624 | 692.7 |
| Georgia | 19,029 | 961.7 | 3,811 | 261.0 | 22,840 | 664.1 |
| Hawaii | 1,153 | 433.7 | 385 | 147.5 | 1,538 | 291.9 |
| Idaho | 512 | 163.5 | 116 | 41.7 | 628 | 106.2 |
| Illinois | 13,552 | 544.9 | 3,088 | 154.9 | 16,640 | 371.4 |
| Indiana | 4,290 | 331.5 | 847 | 80.3 | 5,137 | 218.7 |
| Iowa | 1,059 | 174.6 | 237 | 43.9 | 1,296 | 113.0 |
| Kansas | 1,168 | 215.3 | 244 | 52.8 | 1,412 | 140.6 |
| Kentucky | 2,773 | 312.1 | 542 | 74.2 | 3,315 | 204.7 |
| Louisiana | 7,096 | 793.6 | 1,407 | 195.8 | 8,503 | 527.3 |
| Maine | 797 | 260.1 | 222 | 80.4 | 1,019 | 175.0 |
| Maryland | 13,838 | 1,121.1 | 3,386 | 363.6 | 17,224 | 795.4 |
| Massachusetts | 10,060 | 710.0 | 2,394 | 210.2 | 12,454 | 487.2 |
| Michigan | 6,021 | 291.9 | 1,264 | 73.6 | 7,285 | 192.7 |
| Minnesota | 3,355 | 302.5 | 728 | 81.8 | 4,083 | 204.3 |
| Mississippi | 3,337 | 585.1 | 663 | 139.7 | 4,000 | 382.8 |
| Missouri | 5,002 | 412.9 | 1,012 | 97.9 | 6,014 | 267.9 |
| Montana | 286 | 134.4 | 50 | 25.1 | 336 | 81.6 |
| Nebraska | 847 | 239.7 | 135 | 44.5 | 982 | 149.5 |
| Nevada | 3,787 | 664.1 | 866 | 181.9 | 4,653 | 444.6 |
| New Hampshire | 629 | 201.0 | 117 | 47.6 | 746 | 133.6 |
| New Jersey | 16,394 | 884.8 | 4,573 | 317.9 | 20,967 | 637.0 |
| New Mexico | 1,458 | 368.4 | 390 | 106.5 | 1,848 | 242.5 |
| New York | 56,571 | 1,446.9 | 17,651 | 549.3 | 74,222 | 1,042.0 |
| North Carolina | 12,558 | 620.6 | 2,745 | 162.5 | 15,303 | 412.2 |
| North Dakota | 144 | 106.2 | 29 | 24.9 | 173 | 68.6 |
| Ohio | 8,748 | 370.1 | 1,723 | 86.4 | 10,471 | 240.2 |
| Oklahoma | 2,374 | 329.1 | 450 | 72.6 | 2,824 | 210.6 |
| Oregon | 2,982 | 376.1 | 835 | 113.0 | 3,817 | 249.2 |
| Pennsylvania | 15,694 | 588.9 | 3,878 | 166.0 | 19,572 | 391.4 |
| Rhode Island | 1,235 | 555.3 | 238 | 130.6 | 1,473 | 364.0 |
| South Carolina | 6,985 | 695.3 | 1,621 | 180.1 | 8,606 | 451.9 |
| South Dakota | 237 | 141.8 | 52 | 35.4 | 289 | 92.1 |
| Tennessee | 6,330 | 477.3 | 1,197 | 107.9 | 7,527 | 309.0 |
| Texas | 31,287 | 633.4 | 5,986 | 166.2 | 37,273 | 436.3 |
| Utah | 1,122 | 249.5 | 263 | 75.0 | 1,385 | 173.1 |
| Vermont | 354 | 255.3 | 106 | 87.5 | 460 | 177.0 |
| Virginia | 9,439 | 563.8 | 2,464 | 187.3 | 11,903 | 398.2 |
| Washington | 5,766 | 406.1 | 1,270 | 109.1 | 7,036 | 272.3 |
| West Virginia | 797 | 211.8 | 179 | 49.7 | 976 | 132.6 |
| Wisconsin | 2,593 | 215.0 | 560 | 56.8 | 3,153 | 143.9 |
| Wyoming | 135 | 120.3 | 33 | 34.6 | 168 | 80.9 |
| Subtotal | 416,371 | 659.3 | 102,197 | 194.9 | 518,568 | 448.6 |
| U.S. dependent areas | ||||||
| American Samoa | 2 | 26.2 | 0 | 0.0 | 2 | 18.5 |
| Guam | 41 | 150.7 | 10 | 67.0 | 51 | 121.1 |
| Northern Mariana Islands | 5 | 44.1 | 0 | 0.0 | 5 | 34.6 |
| Puerto Rico | 7,355 | 1,144.6 | 2,157 | 326.2 | 9,512 | 729.6 |
| Republic of Palau | 1 | 26.5 | 1 | 54.7 | 2 | 35.7 |
| U.S. Virgin Islands | 234 | 1,039.9 | 92 | 475.6 | 326 | 779.0 |
| Subtotal | 7,638 | 1,068.2 | 2,260 | 321.2 | 9,898 | 697.7 |
| Total | 424,009 | 663.8 | 104,457 | 196.6 | 528,466 | 451.7 |
Note. Data for the year 2018 are considered preliminary and are based on death data reported to the Centers for Disease Control and Prevention through December 2019.
aRates are per 100,000 population.
| American Indian/Alaska Native | Asiana | Black/African American | Hispanic/Latinob | Native Hawaiian/other Pacific Islander | White | Multiple races | Total | |||||||||
|---|---|---|---|---|---|---|---|---|---|---|---|---|---|---|---|---|
| Area of residence | No. | Ratec | No. | Ratec | No. | Ratec | No. | Ratec | No. | Ratec | No. | Ratec | No. | Ratec | No. | Ratec |
| Alabama | 3 | 27.8 | 12 | 64.2 | 3,392 | 843.5 | 157 | 505.8 | 1 | 177.9 | 1,968 | 149.2 | 327 | 2,289.3 | 5,901 | 328.5 |
| Alaska | 79 | 286.4 | 9 | 62.2 | 49 | 841.1 | 36 | 441.0 | 3 | 188.2 | 162 | 99.9 | 20 | 317.9 | 358 | 158.3 |
| Arizona | 224 | 309.5 | 63 | 92.3 | 819 | 1,004.7 | 1,875 | 413.9 | 5 | 156.0 | 4,898 | 265.6 | 221 | 1,060.8 | 8,146 | 320.3 |
| Arkansas | 2 | 25.6 | 6 | 52.8 | 930 | 695.8 | 120 | 356.4 | 0 | 0.0 | 1,370 | 155.2 | 107 | 989.5 | 2,537 | 234.7 |
| California | 153 | 255.0 | 2,086 | 103.5 | 11,136 | 1,490.0 | 20,500 | 610.7 | 81 | 181.1 | 33,131 | 506.4 | 2,288 | 1,216.7 | 69,383 | 535.6 |
| Colorado | 32 | 300.9 | 38 | 77.8 | 916 | 1,498.5 | 1,145 | 476.4 | 6 | 327.5 | 4,683 | 316.0 | 119 | 708.3 | 6,985 | 375.3 |
| Connecticut | 4 | 150.2 | 38 | 90.9 | 2,152 | 1,944.4 | 2,054 | 1,735.5 | 2 | 534.8 | 2,144 | 194.2 | 162 | 1,819.6 | 6,557 | 472.8 |
| Delaware | 3 | 207.6 | 2 | 18.9 | 1,090 | 1,618.3 | 136 | 901.0 | 0 | 0.0 | 629 | 222.1 | 69 | 2,344.5 | 1,930 | 506.8 |
| District of Columbia | 8 | 1,632.7 | 31 | 595.8 | 5,390 | 4,970.8 | 457 | 3,235.2 | 2 | 2,816.9 | 1,352 | 2,192.6 | 352 | 15,391.3 | 7,596 | 3,950.7 |
| Florida | 34 | 148.3 | 170 | 85.3 | 25,235 | 2,656.2 | 13,242 | 815.5 | 20 | 467.6 | 19,529 | 339.9 | 1,392 | 2,297.3 | 59,624 | 692.7 |
| Georgia | 10 | 108.7 | 62 | 54.2 | 14,486 | 1,545.2 | 1,324 | 854.2 | 7 | 474.9 | 5,721 | 260.6 | 1,223 | 4,627.7 | 22,840 | 664.1 |
| Hawaii | 2 | 195.7 | 220 | 86.2 | 66 | 1,263.2 | 152 | 631.0 | 119 | 295.7 | 858 | 631.8 | 121 | 185.3 | 1,538 | 291.9 |
| Idaho | 8 | 132.9 | 1 | 14.1 | 39 | 1,737.2 | 84 | 236.0 | 1 | 165.0 | 473 | 88.6 | 22 | 373.2 | 628 | 106.2 |
| Illinois | 15 | 211.7 | 160 | 76.4 | 7,096 | 1,261.6 | 2,740 | 641.4 | 5 | 511.2 | 5,673 | 174.8 | 949 | 3,470.5 | 16,640 | 371.4 |
| Indiana | 2 | 32.6 | 49 | 159.2 | 1,568 | 916.2 | 353 | 480.0 | 0 | 0.0 | 2,984 | 145.4 | 181 | 1,259.7 | 5,137 | 218.7 |
| Iowa | 2 | 78.6 | 8 | 56.3 | 200 | 957.2 | 89 | 327.8 | 0 | 0.0 | 946 | 87.9 | 51 | 1,035.7 | 1,296 | 113.0 |
| Kansas | 4 | 57.9 | 9 | 46.5 | 295 | 645.4 | 180 | 325.7 | 0 | 0.0 | 858 | 98.9 | 63 | 670.4 | 1,412 | 140.6 |
| Kentucky | 3 | 76.2 | 8 | 53.7 | 966 | 919.3 | 144 | 587.7 | 0 | 0.0 | 2,067 | 141.6 | 126 | 1,166.8 | 3,315 | 204.7 |
| Louisiana | 10 | 102.0 | 27 | 118.5 | 5,157 | 1,166.3 | 402 | 802.3 | 0 | 0.0 | 2,731 | 253.8 | 173 | 1,541.8 | 8,503 | 527.3 |
| Maine | 3 | 99.2 | 3 | 68.4 | 106 | 3,269.6 | 60 | 1,362.7 | 0 | 0.0 | 821 | 145.9 | 25 | 568.1 | 1,019 | 175.0 |
| Maryland | 11 | 190.7 | 78 | 62.5 | 12,307 | 2,077.1 | 880 | 808.9 | 1 | 104.1 | 2,603 | 198.4 | 1,344 | 6,527.8 | 17,224 | 795.4 |
| Massachusetts | 12 | 267.1 | 173 | 150.0 | 3,615 | 2,580.8 | 2,895 | 1,813.0 | 3 | 366.3 | 5,553 | 262.1 | 202 | 1,198.9 | 12,454 | 487.2 |
| Michigan | 15 | 77.2 | 27 | 34.6 | 3,504 | 829.1 | 377 | 414.4 | 2 | 246.3 | 3,101 | 98.9 | 257 | 811.9 | 7,285 | 192.7 |
| Minnesota | 43 | 285.9 | 47 | 92.9 | 1,261 | 1,955.9 | 321 | 771.3 | 1 | 160.0 | 2,269 | 125.1 | 136 | 1,124.4 | 4,083 | 204.3 |
| Mississippi | 4 | 97.1 | 10 | 114.1 | 2,654 | 811.8 | 103 | 650.9 | 0 | 0.0 | 1,037 | 151.8 | 163 | 2,908.6 | 4,000 | 382.8 |
| Missouri | 4 | 40.8 | 21 | 70.6 | 2,112 | 1,017.7 | 302 | 702.9 | 1 | 69.8 | 3,384 | 175.0 | 188 | 960.9 | 6,014 | 267.9 |
| Montana | 14 | 89.9 | 0 | 0.0 | 10 | 1,132.5 | 13 | 177.6 | 1 | 529.1 | 282 | 74.1 | 16 | 317.3 | 336 | 81.6 |
| Nebraska | 7 | 190.2 | 10 | 112.0 | 225 | 1,057.2 | 116 | 375.4 | 1 | 393.7 | 602 | 102.3 | 20 | 556.9 | 982 | 149.5 |
| Nevada | 25 | 278.6 | 107 | 110.3 | 1,025 | 1,332.4 | 869 | 515.9 | 9 | 178.0 | 2,473 | 366.3 | 144 | 971.3 | 4,653 | 444.6 |
| New Hampshire | 0 | 0.0 | 5 | 54.3 | 79 | 1,892.7 | 86 | 956.6 | 0 | 0.0 | 547 | 103.0 | 28 | 761.9 | 746 | 133.6 |
| New Jersey | 8 | 167.8 | 175 | 68.2 | 9,337 | 2,511.2 | 5,304 | 1,228.3 | 2 | 227.3 | 4,633 | 210.3 | 1,464 | 6,381.3 | 20,967 | 637.0 |
| New Mexico | 89 | 176.2 | 4 | 38.2 | 88 | 706.0 | 748 | 261.6 | 0 | 0.0 | 865 | 218.6 | 53 | 837.4 | 1,848 | 242.5 |
| New York | 26 | 132.3 | 840 | 155.2 | 27,279 | 2,880.7 | 25,484 | 2,676.0 | 9 | 355.5 | 14,877 | 323.2 | 5,464 | 9,554.1 | 74,222 | 1,042.0 |
| North Carolina | 64 | 168.6 | 54 | 77.4 | 9,155 | 1,292.0 | 860 | 619.6 | 3 | 211.6 | 4,529 | 165.9 | 633 | 2,459.9 | 15,303 | 412.2 |
| North Dakota | 10 | 125.4 | 2 | 105.4 | 39 | 1,580.9 | 10 | 335.6 | 0 | 0.0 | 107 | 45.5 | 5 | 324.0 | 173 | 68.6 |
| Ohio | 7 | 74.5 | 31 | 47.6 | 3,978 | 906.8 | 644 | 833.2 | 1 | 92.2 | 5,313 | 142.1 | 411 | 1,398.9 | 10,471 | 240.2 |
| Oklahoma | 134 | 152.1 | 23 | 106.4 | 533 | 658.2 | 227 | 371.0 | 0 | 0.0 | 1,776 | 169.6 | 131 | 321.3 | 2,824 | 210.6 |
| Oregon | 25 | 164.8 | 39 | 72.4 | 231 | 1,118.1 | 376 | 438.9 | 7 | 203.4 | 3,051 | 229.4 | 88 | 390.7 | 3,817 | 249.2 |
| Pennsylvania | 14 | 196.1 | 93 | 80.0 | 8,804 | 2,118.0 | 3,141 | 1,839.9 | 10 | 954.2 | 6,619 | 155.2 | 889 | 3,377.8 | 19,572 | 391.4 |
| Rhode Island | 3 | 214.6 | 17 | 204.8 | 341 | 2,016.3 | 360 | 1,148.4 | 1 | 549.5 | 718 | 209.0 | 33 | 1,106.6 | 1,473 | 364.0 |
| South Carolina | 7 | 99.5 | 16 | 68.7 | 5,631 | 1,280.6 | 324 | 693.0 | 1 | 167.2 | 2,402 | 174.6 | 219 | 1,857.8 | 8,606 | 451.9 |
| South Dakota | 34 | 236.2 | 2 | 84.0 | 54 | 2,231.4 | 13 | 289.0 | 0 | 0.0 | 178 | 61.8 | 8 | 365.5 | 289 | 92.1 |
| Tennessee | 2 | 24.9 | 23 | 75.9 | 3,719 | 1,135.3 | 266 | 523.1 | 2 | 238.4 | 3,266 | 163.3 | 247 | 1,374.4 | 7,527 | 309.0 |
| Texas | 21 | 62.1 | 277 | 75.1 | 12,096 | 1,296.6 | 10,733 | 455.4 | 7 | 121.8 | 12,557 | 262.6 | 1,576 | 2,534.4 | 37,273 | 436.3 |
| Utah | 13 | 189.8 | 19 | 103.3 | 113 | 1,869.9 | 221 | 325.2 | 3 | 56.1 | 982 | 142.3 | 31 | 586.6 | 1,385 | 173.1 |
| Vermont | 0 | 0.0 | 1 | 37.8 | 36 | 2,412.9 | 33 | 1,382.5 | 0 | 0.0 | 368 | 147.2 | 22 | 900.5 | 460 | 177.0 |
| Virginia | 7 | 79.5 | 125 | 77.6 | 6,395 | 1,214.6 | 807 | 573.4 | 1 | 62.6 | 4,085 | 192.5 | 456 | 1,560.8 | 11,903 | 398.2 |
| Washington | 64 | 222.0 | 159 | 82.5 | 1,006 | 1,343.6 | 754 | 534.4 | 14 | 124.5 | 4,564 | 217.9 | 467 | 1,131.5 | 7,036 | 272.3 |
| West Virginia | 1 | 54.8 | 3 | 69.0 | 209 | 1,022.0 | 42 | 721.8 | 0 | 0.0 | 657 | 94.1 | 61 | 1,171.1 | 976 | 132.6 |
| Wisconsin | 13 | 86.9 | 26 | 87.5 | 986 | 1,142.0 | 361 | 603.7 | 0 | 0.0 | 1,679 | 84.4 | 87 | 822.5 | 3,153 | 143.9 |
| Wyoming | 5 | 166.4 | 1 | 69.5 | 9 | 546.1 | 27 | 232.2 | 0 | 0.0 | 122 | 64.9 | 4 | 232.4 | 168 | 80.9 |
| Subtotal | 1,283 | 175.5 | 5,410 | 96.1 | 197,919 | 1,614.8 | 101,947 | 810.8 | 332 | 217.5 | 188,197 | 226.3 | 22,838 | 2,132.5 | 518,568 | 448.6 |
| U.S. dependent areasd | ||||||||||||||||
| American Samoa | 0 | – | 0 | – | 0 | – | 0 | – | 0 | – | 0 | – | 2 | – | 2 | 18.5 |
| Guam | 0 | – | 31 | – | 2 | – | 2 | – | 7 | – | 6 | – | 3 | – | 51 | 121.1 |
| Northern Mariana Islands | 1 | – | 0 | – | 0 | – | 0 | – | 2 | – | 2 | – | 0 | – | 5 | 34.6 |
| Puerto Rico | 1 | – | 1 | – | 5 | – | 9,483 | – | 1 | – | 20 | – | 1 | – | 9,512 | 729.6 |
| Republic of Palau | 0 | – | 0 | – | 0 | – | 0 | – | 2 | – | 0 | – | 0 | – | 2 | 35.7 |
| U.S. Virgin Islands | 0 | – | 2 | – | 184 | – | 112 | – | 0 | – | 25 | – | 2 | – | 326 | 779.0 |
| Subtotal | 2 | – | 34 | – | 191 | – | 9,597 | – | 12 | – | 53 | – | 8 | – | 9,898 | 697.7 |
| Total | 1,285 | – | 5,444 | – | 198,110 | – | 111,544 | – | 344 | – | 188,250 | – | 22,846 | – | 528,466 | 451.7 |
Note. Data for the year 2018 are considered preliminary and are based on death data reported to the Centers for Disease Control and Prevention through December 2019.
aIncludes Asian/Pacific Islander legacy cases.
bHispanics/Latinos can be of any race.
cRates are per 100,000 population.
dRates by race/ethnicity are not provided because U.S. census information is limited for U.S. dependent areas.
| Metropolitan Statistical Area (population ≥ 500,000) | Metropolitan Areas (population of 50,000-499,999) | Nonmetropolitan areas | ||||
|---|---|---|---|---|---|---|
| No. | Ratea | No. | Ratea | No. | Ratea | |
| Aged 50–64 years at year-end 2018 | ||||||
| Male adult | ||||||
| Race/ethnicity | ||||||
| American Indian/Alaska Native | 448 | 546.3 | 123 | 281.5 | 186 | 219.5 |
| Asianb | 3,236 | 240.3 | 200 | 183.5 | 57 | 160.8 |
| Black/African American | 81,568 | 3,122.9 | 9,715 | 1,944.8 | 5,887 | 1,724.6 |
| Hispanic/Latinoc | 57,825 | 1,775.2 | 4,472 | 896.2 | 2,209 | 827.0 |
| Native Hawaiian/other Pacific Islander | 170 | 488.7 | 27 | 397.1 | 10 | 191.9 |
| White | 99,838 | 764.4 | 16,086 | 385.6 | 9,018 | 231.1 |
| Multiple races | 11,406 | 5,225.3 | 1,358 | 2,633.8 | 786 | 1,751.8 |
| Transmission categoryd | ||||||
| Male-to-male sexual contact | 173,998 | – | 20,611 | – | 11,027 | – |
| Injection drug use | 30,356 | – | 3,992 | – | 2,570 | – |
| Male-to-male sexual contact and injection drug use | 20,601 | – | 3,130 | – | 1,962 | – |
| Heterosexual contacte | 29,091 | – | 4,135 | – | 2,506 | – |
| Otherf | 706 | – | 133 | – | 99 | – |
| Subtotal, male adult ≥50 yearsg | 254,752 | 1,235.9 | 32,000 | 594.6 | 18,164 | 388.0 |
| Female adult | ||||||
| Race/ethnicity | ||||||
| American Indian/Alaska Native | 151 | 163.7 | 56 | 116.1 | 70 | 75.2 |
| Asianb | 629 | 39.8 | 70 | 49.6 | 14 | 29.4 |
| Black/African American | 46,115 | 1,480.8 | 5,262 | 941.0 | 2,672 | 743.6 |
| Hispanic/Latinoc | 15,840 | 466.2 | 1,138 | 228.8 | 405 | 171.5 |
| Native Hawaiian/other Pacific Islander | 36 | 96.8 | 6 | 87.3 | 6 | 120.4 |
| White | 11,609 | 86.1 | 2,928 | 66.2 | 1,765 | 44.1 |
| Multiple races | 3,510 | 1,432.5 | 450 | 777.2 | 265 | 547.0 |
| Transmission categoryd | ||||||
| Injection drug use | 21,301 | – | 2,497 | – | 1,261 | – |
| Heterosexual contacte | 56,250 | – | 7,364 | – | 3,900 | – |
| Otherf | 420 | – | 55 | – | 47 | – |
| Subtotal, female adult aged ≥50 yearsg | 77,971 | 355.1 | 9,916 | 172.9 | 5,208 | 108.8 |
| Both Sexes | ||||||
| Race/ethnicity | ||||||
| American Indian/Alaska Native | 599 | 343.8 | 179 | 194.7 | 256 | 144.0 |
| Asianb | 3,865 | 132.0 | 270 | 108.0 | 71 | 85.4 |
| Black/African American | 127,683 | 2,229.8 | 14,977 | 1,414.6 | 8,559 | 1,221.5 |
| Hispanic/Latinoc | 73,665 | 1,106.8 | 5,610 | 563.1 | 2,614 | 519.3 |
| Native Hawaiian/other Pacific Islander | 206 | 286.3 | 33 | 241.3 | 16 | 157.0 |
| White | 111,447 | 419.7 | 19,014 | 221.2 | 10,783 | 136.5 |
| Multiple races | 14,916 | 3,219.4 | 1,808 | 1,651.7 | 1,051 | 1,126.3 |
| Subtotal, aged 50–64 years of ageg | 332,723 | 781.6 | 41,916 | 377.1 | 23,372 | 246.8 |
| Aged ≥65 years at year-end 2018 | ||||||
| Male adult | ||||||
| Race/ethnicity | ||||||
| American Indian/Alaska Native | 71 | 146.3 | 28 | 102.3 | 33 | 62.2 |
| Asianb | 766 | 82.8 | 51 | 72.1 | 9 | 34.7 |
| Black/African American | 21,147 | 1,476.1 | 2,241 | 785.8 | 1,234 | 588.4 |
| Hispanic/Latinoc | 11,683 | 764.4 | 788 | 313.3 | 440 | 311.9 |
| Native Hawaiian/other Pacific Islander | 38 | 197.8 | 2 | 48.6 | 7 | 217.3 |
| White | 27,486 | 259.1 | 4,353 | 113.2 | 2,290 | 62.8 |
| Multiple races | 2,370 | 2,107.1 | 246 | 773.5 | 135 | 365.5 |
| Transmission categoryd | ||||||
| Male-to-male sexual contact | 38,813 | – | 4,759 | – | 2,490 | – |
| Injection drug use | 11,872 | – | 1,193 | – | 702 | – |
| Male-to-male sexual contact and injection drug use | 3,672 | – | 488 | – | 306 | – |
| Heterosexual contacte | 9,019 | – | 1,216 | – | 627 | – |
| Otherf | 300 | – | 65 | – | 31 | – |
| Subtotal, male adult aged ≥65 yearsg | 63,676 | 434.0 | 7,720 | 171.0 | 4,156 | 100.9 |
| Females | ||||||
| Race/ethnicity | ||||||
| American Indian/Alaska Native | 41 | 68.6 | 9 | 27.5 | 18 | 27.4 |
| Asianb | 214 | 17.8 | 15 | 14.4 | 2 | 5.2 |
| Black/African American | 10,990 | 509.4 | 1,198 | 302.7 | 617 | 212.6 |
| Hispanic/Latinoc | 4,262 | 208.6 | 249 | 82.8 | 84 | 54.9 |
| Native Hawaiian/other Pacific Islander | 10 | 44.8 | 2 | 45.8 | 1 | 28.3 |
| White | 2,738 | 20.8 | 565 | 12.2 | 408 | 9.6 |
| Multiple races | 824 | 575.2 | 83 | 213.6 | 45 | 108.4 |
| Transmission categoryd | ||||||
| Injection drug use | 4,838 | – | 400 | – | 242 | – |
| Heterosexual contacte | 13,955 | – | 1,675 | – | 906 | – |
| Otherf | 315 | – | 49 | – | 30 | – |
| Subtotal, female adult aged ≥65 yearsg | 19,108 | 101.8 | 2,123 | 38.5 | 1,177 | 24.3 |
| Both Sexes | ||||||
| Race/ethnicity | ||||||
| American Indian/Alaska Native | 112 | 103.4 | 37 | 61.6 | 51 | 43.0 |
| Asianb | 980 | 46.0 | 66 | 37.7 | 11 | 17.1 |
| Black/African American | 32,137 | 895.2 | 3,439 | 505.0 | 1,851 | 370.3 |
| Hispanic/Latinoc | 15,945 | 446.4 | 1,037 | 187.8 | 524 | 178.2 |
| Native Hawaiian/other Pacific Islander | 48 | 115.5 | 4 | 47.2 | 8 | 118.3 |
| White | 30,224 | 127.3 | 4,918 | 58.0 | 2,698 | 34.2 |
| Multiple races | 3,194 | 1,248.9 | 329 | 465.6 | 180 | 229.5 |
| Subtotal, aged ≥65 years of ageg | 82,784 | 247.6 | 9,843 | 98.1 | 5,333 | 59.5 |
| Total, aged ≥50 years of age at end of yearg | ||||||
| Males | ||||||
| Age at end of year 2018 (yr) | ||||||
| 50–54 | 96,560 | 1,363.8 | 11,993 | 689.8 | 6,881 | 471.7 |
| 55–59 | 94,417 | 1,316.0 | 11,904 | 636.9 | 6,699 | 412.1 |
| 60–64 | 63,775 | 1,003.1 | 8,103 | 456.7 | 4,584 | 286.9 |
| 65–69 | 36,399 | 713.9 | 4,398 | 286.1 | 2,449 | 175.1 |
| 70–74 | 16,787 | 431.0 | 2,145 | 176.6 | 1,104 | 100.2 |
| 75–79 | 6,815 | 265.3 | 815 | 99.8 | 399 | 52.6 |
| 80–84 | 2,501 | 155.5 | 258 | 50.7 | 150 | 31.7 |
| ≥85 | 1,174 | 78.2 | 104 | 23.7 | 54 | 14.0 |
| Race/ethnicity | ||||||
| American Indian/Alaska Native | 519 | 397.6 | 151 | 212.5 | 219 | 159.0 |
| Asianb | 4,002 | 176.2 | 251 | 139.6 | 66 | 107.5 |
| Black/African American | 102,715 | 2,539.6 | 11,956 | 1,523.6 | 7,121 | 1,292.2 |
| Hispanic/Latinoc | 69,508 | 1,452.4 | 5,260 | 700.9 | 2,649 | 649.0 |
| Native Hawaiian/other Pacific Islander | 208 | 385.2 | 29 | 265.7 | 17 | 201.6 |
| White | 127,324 | 537.9 | 20,439 | 254.9 | 11,308 | 149.8 |
| Multiple races | 13,776 | 4,164.9 | 1,604 | 1,924.1 | 921 | 1,125.8 |
| Transmission categoryd | ||||||
| Male-to-male sexual contact | 212,811 | – | 25,369 | – | 13,517 | – |
| Injection drug use | 42,228 | – | 5,185 | – | 3,272 | – |
| Male-to-male sexual contact and injection drug use |
24,273 | – | 3,617 | – | 2,268 | – |
| Heterosexual contacte | 38,110 | – | 5,351 | – | 3,133 | – |
| Otherf | 1,006 | – | 197 | – | 130 | – |
| Subtotal, male adultg | 318,428 | 902.4 | 39,720 | 401.3 | 22,320 | 253.7 |
| Females | ||||||
| Age at end of year 2018 (yr) | ||||||
| 50–54 | 29,882 | 405.9 | 3,914 | 217.9 | 2,099 | 144.8 |
| 55–59 | 28,268 | 371.5 | 3,544 | 178.0 | 1,850 | 110.8 |
| 60–64 | 19,821 | 283.7 | 2,458 | 126.3 | 1,259 | 75.5 |
| 65–69 | 10,828 | 184.6 | 1,240 | 72.4 | 681 | 46.2 |
| 70–74 | 4,863 | 105.1 | 540 | 39.3 | 316 | 26.5 |
| 75–79 | 2,127 | 65.2 | 207 | 21.1 | 115 | 13.1 |
| 80–84 | 849 | 37.6 | 85 | 12.6 | 53 | 8.7 |
| ≥85 | 441 | 16.0 | 51 | 6.6 | 12 | 1.7 |
| Race/ethnicity | ||||||
| American Indian/Alaska Native | 192 | 126.3 | 65 | 80.3 | 88 | 55.4 |
| Asianb | 843 | 30.3 | 85 | 34.6 | 16 | 18.6 |
| Black/African American | 57,105 | 1,083.3 | 6,460 | 676.5 | 3,289 | 506.4 |
| Hispanic/Latinoc | 20,102 | 369.4 | 1,387 | 173.8 | 489 | 125.7 |
| Native Hawaiian/other Pacific Islander | 46 | 77.3 | 8 | 71.2 | 7 | 82.2 |
| White | 14,347 | 53.9 | 3,493 | 38.5 | 2,173 | 26.3 |
| Multiple races | 4,334 | 1,116.2 | 533 | 550.8 | 310 | 344.7 |
| Transmission categoryd | ||||||
| Injection drug use | 26,139 | – | 2,897 | – | 1,502 | – |
| Heterosexual contacte | 70,205 | – | 9,038 | – | 4,806 | – |
| Otherf | 735 | – | 104 | – | 76 | – |
| Subtotal, female adultg | 97,079 | 238.4 | 12,039 | 107.0 | 6,385 | 66.3 |
| Both sexes | ||||||
| Age at end of year 2018 (yr) | ||||||
| 50–54 | 126,442 | 875.6 | 15,907 | 450.0 | 8,980 | 308.8 |
| 55–59 | 122,685 | 829.8 | 15,448 | 400.2 | 8,549 | 259.4 |
| 60–64 | 83,596 | 626.4 | 10,561 | 283.8 | 5,843 | 178.9 |
| 65–69 | 47,227 | 430.7 | 5,638 | 173.4 | 3,130 | 109.0 |
| 70–74 | 21,650 | 254.1 | 2,685 | 103.7 | 1,420 | 61.8 |
| 75–79 | 8,942 | 153.3 | 1,022 | 56.8 | 514 | 31.4 |
| 80–84 | 3,350 | 86.7 | 343 | 29.0 | 203 | 18.8 |
| ≥85 | 1,615 | 37.9 | 155 | 12.8 | 66 | 6.1 |
| Race/ethnicity | ||||||
| American Indian/Alaska Native | 711 | 251.6 | 216 | 142.1 | 307 | 103.6 |
| Asianb | 4,845 | 95.8 | 336 | 79.0 | 82 | 55.7 |
| Black/African American | 159,820 | 1,715.5 | 18,416 | 1,058.6 | 10,410 | 867.1 |
| Hispanic/Latinoc | 89,610 | 876.2 | 6,647 | 429.2 | 3,138 | 393.6 |
| Native Hawaiian/other Pacific Islander | 254 | 223.8 | 37 | 167.0 | 24 | 141.6 |
| White | 141,671 | 281.7 | 23,932 | 140.1 | 13,481 | 85.3 |
| Multiple races | 18,110 | 2,518.6 | 2,137 | 1,186.4 | 1,231 | 716.7 |
| Totalg | 415,507 | 546.7 | 51,759 | 244.8 | 28,705 | 155.7 |
Note. Numbers less than 12, and rates and trends based on these numbers, should be interpreted with caution. Data for the year 2018 are considered preliminary and are based on death data reported to the Centers for Disease Control and Prevention through December 2019.
aRates are per 100,000 population. Rates are not calculated by transmission category because of the lack of denominator data.
bIncludes Asian/Pacific Islander legacy cases.
cHispanics/Latinos can be of any race.
dData have been statistically adjusted to account for missing transmission category; therefore, values may not sum to the column subtotals and total.
eHeterosexual contact with a person known to have, or to be at high risk for, HIV infection.
f Includes hemophilia, blood transfusion,and risk factor not reported or not identified.
gIncludes persons of unknown race/ethnicity.
| 2014 | 2015 | 2016 | 2017 | 2018 | ||||||
|---|---|---|---|---|---|---|---|---|---|---|
| No. | Ratea | No. | Ratea | No. | Ratea | No. | Ratea | No. | Ratea | |
| Gender | ||||||||||
| Male | 8,013 | – | 8,208 | – | 8,746 | – | 8,900 | – | 8,568 | – |
| Female | 2,475 | – | 2,412 | – | 2,550 | – | 2,640 | – | 2,562 | – |
| Transgender male-to-femaleb | 30 | – | 43 | – | 53 | – | 41 | – | 54 | – |
| Transgender female-to-maleb | 2 | – | 1 | – | 0 | – | 3 | – | 1 | – |
| Additional gender identityc | 0 | – | 1 | – | 0 | – | 1 | – | 1 | – |
| Age at death (yr) | ||||||||||
| 50–54 | 2,959 | 13.1 | 2,945 | 13.2 | 2,847 | 13.1 | 2,734 | 12.8 | 2,482 | 11.9 |
| 55–59 | 2,905 | 13.5 | 2,841 | 13.1 | 2,999 | 13.7 | 2,970 | 13.5 | 2,777 | 12.7 |
| 60–64 | 2,202 | 11.9 | 2,156 | 11.3 | 2,418 | 12.4 | 2,493 | 12.5 | 2,422 | 11.9 |
| 65–69 | 1,225 | 8.0 | 1,319 | 8.2 | 1,570 | 9.3 | 1,670 | 9.9 | 1,682 | 9.8 |
| 70–74 | 658 | 5.9 | 756 | 6.6 | 808 | 6.8 | 863 | 6.7 | 919 | 6.9 |
| 75–79 | 336 | 4.2 | 386 | 4.8 | 391 | 4.7 | 488 | 5.6 | 534 | 5.8 |
| 80–84 | 160 | 2.8 | 181 | 3.1 | 207 | 3.5 | 229 | 3.8 | 247 | 4.0 |
| ≥85 | 75 | 1.2 | 81 | 1.3 | 109 | 1.7 | 138 | 2.1 | 123 | 1.9 |
| Race/ethnicity | ||||||||||
| American Indian/Alaska Native | 37 | 5.6 | 35 | 5.1 | 26 | 3.7 | 26 | 3.6 | 24 | 3.3 |
| Asiand | 25 | 0.5 | 38 | 0.8 | 55 | 1.1 | 52 | 1.0 | 52 | 0.9 |
| Black/African American | 4,664 | 41.6 | 4,665 | 40.5 | 4,889 | 41.5 | 4,963 | 41.3 | 4,712 | 38.4 |
| Hispanic/Latinoe | 1,621 | 15.5 | 1,533 | 13.9 | 1,747 | 15.2 | 1,801 | 15.0 | 1,847 | 14.7 |
| Native Hawaiian/other Pacific Islander | 6 | 4.7 | 4 | 3.0 | 7 | 5.0 | 5 | 3.4 | 6 | 3.9 |
| White | 3,504 | 4.4 | 3,691 | 4.5 | 3,932 | 4.8 | 4,000 | 4.8 | 3,790 | 4.6 |
| Multiple races | 659 | 70.2 | 696 | 71.5 | 690 | 68.6 | 736 | 70.9 | 755 | 70.5 |
| Transmission Categoryf | ||||||||||
| Male adultg | ||||||||||
| Male-to-male sexual contact | 4,002 | – | 4,181 | – | 4,564 | – | 4,728 | – | 4,546 | – |
| Injection drug use | 1,988 | – | 1,878 | – | 1,948 | – | 1,872 | – | 1,819 | – |
| Male-to-male sexual contact and injection drug use | 876 | – | 958 | – | 960 | – | 979 | – | 1,015 | – |
| Heterosexual contacth | 1,141 | – | 1,185 | – | 1,281 | – | 1,317 | – | 1,200 | – |
| Otheri | 37 | – | 49 | – | 46 | – | 46 | – | 43 | – |
| Subtotal | 8,043 | 15.9 | 8,252 | 16.0 | 8,799 | 16.8 | 8,942 | 16.8 | 8,622 | 16.0 |
| Female adultg | ||||||||||
| Injection drug use | 985 | – | 942 | – | 975 | – | 975 | – | 920 | – |
| Heterosexual contacth | 1,472 | – | 1,452 | – | 1,552 | – | 1,647 | – | 1,624 | – |
| Otheri | 21 | – | 19 | – | 23 | – | 21 | – | 20 | – |
| Subtotal | 2,477 | 4.3 | 2,413 | 4.1 | 2,550 | 4.3 | 2,643 | 4.3 | 2,564 | 4.2 |
| Region of residencej | ||||||||||
| Northeast | ||||||||||
| Midwest | 2,727 | 13.4 | 2,708 | 13.2 | 2,843 | 13.7 | 2,883 | 13.7 | 2,740 | 12.9 |
| South | 1,156 | 4.8 | 1,200 | 5.0 | 1,254 | 5.1 | 1,246 | 5.1 | 1,357 | 5.5 |
| West | 4,949 | 12.3 | 4,988 | 12.1 | 5,351 | 12.7 | 5,494 | 12.8 | 5,057 | 11.6 |
| Totalk | 10,520 | 9.7 | 10,665 | 9.6 | 11,349 | 10.1 | 11,585 | 10.2 | 11,186 | 9.7 |
Note. Deaths of persons with a diagnosis of HIV infection may be due to any cause. Data for the year 2018 are considered preliminary and are based on death data reported to the Centers for Disease Control and Prevention through December 2019. Numbers less than 12, and rates and trends based on these numbers, should be interpreted with caution.
aRates are per 100,000 population. Rates are not calculated by gender or transmission category because of the lack of denominator data.
b“Transgender male-to-female” includes individuals who were assigned “male” sex at birth but have ever identified as “female” gender. “Transgender female-to-male” includes individuals who were assigned “female” sex at birth but have ever identified as “male” gender.
cAdditional gender identity examples include “bigender,” “gender queer,” and “two-spirit.”
dIncludes Asian/Pacific Islander legacy cases.
eHispanics/Latinos can be of any race.
fData have been statistically adjusted to account for missing transmission category; therefore, values may not sum to the column subtotals and total.
gData presented based on sex at birth and include transgender persons.
hHeterosexual contact with a person known to have, or to be at high risk for, HIV infection.
iIncludes hemophilia, blood transfusion, and risk factor not reported or not identified.
jData are based on residence at death. When information on residence at death was not available, state at death (where a person’s death occurred) was used.
kIncludes persons of unknown race/ethnicity.
| 2014 | 2015 | 2016 | 2017 | 2018 | ||||||
|---|---|---|---|---|---|---|---|---|---|---|
| No. | Ratea | No. | Ratea | No. | Ratea | No. | Ratea | No. | Ratea | |
| Gender | ||||||||||
| Male | 8,253 | – | 8,408 | – | 8,964 | – | 9,103 | – | 8,761 | – |
| Female | 2,561 | – | 2,478 | – | 2,613 | – | 2,718 | – | 2,608 | – |
| Transgender male-to-femaleb | 30 | – | 43 | – | 53 | – | 41 | – | 54 | – |
| Transgender female-to-maleb | 2 | – | 1 | – | 0 | – | 3 | – | 1 | – |
| Additional gender identityc | 0 | – | 1 | – | 0 | – | 1 | – | 1 | – |
| Age at death (yr) | ||||||||||
| 50–54 | 3,056 | 13.4 | 3,040 | 13.5 | 2,918 | 13.2 | 2,808 | 13.0 | 2,531 | 12.0 |
| 55–59 | 2,992 | 13.8 | 2,906 | 13.2 | 3,074 | 13.8 | 3,051 | 13.7 | 2,842 | 12.8 |
| 60–64 | 2,262 | 12.1 | 2,203 | 11.4 | 2,471 | 12.6 | 2,535 | 12.6 | 2,468 | 12.0 |
| 65–69 | 1,267 | 8.2 | 1,347 | 8.3 | 1,607 | 9.4 | 1,713 | 10.1 | 1,711 | 9.9 |
| 70–74 | 674 | 6.0 | 767 | 6.6 | 833 | 7.0 | 878 | 6.7 | 942 | 6.9 |
| 75–79 | 346 | 4.3 | 401 | 4.9 | 401 | 4.7 | 501 | 5.7 | 551 | 5.9 |
| 80–84 | 172 | 3.0 | 185 | 3.2 | 212 | 3.6 | 237 | 3.9 | 253 | 4.1 |
| ≥85 | 77 | 1.2 | 82 | 1.3 | 114 | 1.8 | 143 | 2.2 | 127 | 1.9 |
| Race/ethnicity | ||||||||||
| American Indian/Alaska Native | 37 | – | 35 | – | 26 | – | 26 | – | 24 | – |
| Asiand | 27 | – | 38 | – | 55 | – | 52 | – | 52 | – |
| Black/African American | 4,671 | – | 4,669 | – | 4,896 | – | 4,967 | – | 4,712 | – |
| Hispanic/Latinoe | 1,938 | – | 1,794 | – | 2,019 | – | 2,077 | – | 2,084 | – |
| Native Hawaiian/other Pacific Islander | 6 | – | 5 | – | 8 | – | 5 | – | 6 | – |
| White | 3,504 | – | 3,691 | – | 3,932 | – | 4,001 | – | 3,791 | – |
| Multiple races | 659 | – | 696 | – | 691 | – | 736 | – | 756 | – |
| Transmission Categoryf | ||||||||||
| Male adultg | ||||||||||
| Male-to-male sexual contact | 4,055 | – | 4,230 | – | 4,610 | – | 4,771 | – | 4,602 | – |
| Injection drug use | 2,088 | – | 1,967 | – | 2,032 | – | 1,962 | – | 1,890 | – |
| Male-to-male sexual contact and injection drug use | 892 | – | 975 | – | 983 | – | 995 | – | 1,028 | – |
| Heterosexual contacth | 1,211 | – | 1,230 | – | 1,347 | – | 1,370 | – | 1,253 | – |
| Otheri | 38 | – | 49 | – | 46 | – | 47 | – | 43 | – |
| Subtotal | 8,283 | 16.2 | 8,452 | 16.2 | 9,017 | 17.0 | 9,145 | 17.0 | 8,815 | 16.1 |
| Female adultg | ||||||||||
| Injection drug use | 1,008 | – | 955 | – | 999 | – | 996 | – | 936 | – |
| Heterosexual contacth | 1,534 | – | 1,505 | – | 1,591 | – | 1,704 | – | 1,654 | – |
| Otheri | 21 | – | 19 | – | 24 | – | 21 | – | 20 | – |
| Subtotal | 2,563 | 4.4 | 2,479 | 4.1 | 2,613 | 4.3 | 2,721 | 4.4 | 2,610 | 4.2 |
| Region of residencej | ||||||||||
| Northeast | ||||||||||
| Midwest | 2,727 | 13.4 | 2,708 | 13.2 | 2,843 | 13.7 | 2,883 | 13.7 | 2,740 | 12.9 |
| South | 1,156 | 4.8 | 1,200 | 5.0 | 1,254 | 5.1 | 1,246 | 5.1 | 1,357 | 5.5 |
| West | 4,949 | 12.3 | 4,988 | 12.1 | 5,351 | 12.7 | 5,494 | 12.8 | 5,057 | 11.6 |
| U.S. dependent areas | 1,688 | 7.0 | 1,769 | 7.2 | 1,901 | 7.6 | 1,962 | 7.7 | 2,032 | 7.8 |
| Totalk | 10,846 | 9.9 | 10,931 | 9.8 | 11,630 | 10.2 | 11,866 | 10.3 | 11,425 | 9.8 |
Note. Deaths of persons with a diagnosis of HIV infection may be due to any cause. Data for the year 2018 are considered preliminary and are based on death data reported to the Centers for Disease Control and Prevention through December 2019. Numbers less than 12, and rates and trends based on these numbers, should be interpreted with caution.
aRates are per 100,000 population. Rates are not calculated by gender or transmission category because of the lack of denominator data.
b“Transgender male-to-female” includes individuals who were assigned “male” sex at birth but have ever identified as “female” gender. “Transgender female-to-male” includes individuals who were assigned “female” sex at birth but have ever identified as “male” gender.
cAdditional gender identity examples include “bigender,” “gender queer,” and “two-spirit.”
dIncludes Asian/Pacific Islander legacy cases.
eHispanics/Latinos can be of any race.
fData have been statistically adjusted to account for missing transmission category; therefore, values may not sum to the column subtotals and total.
gData presented based on sex at birth and include transgender persons.
hHeterosexual contact with a person known to have, or to be at high risk for, HIV infection.
iIncludes hemophilia, blood transfusion, and risk factor not reported or not identified.
jData are based on residence at death. When information on residence at death was not available, state at death (where a person’s death occurred) was used.
kIncludes persons of unknown race/ethnicity.
| 2014 | 2015 | 2016 | 2017 | 2018 | ||||||
|---|---|---|---|---|---|---|---|---|---|---|
| No. | Ratea | No. | Ratea | No. | Ratea | No. | Ratea | No. | Ratea | |
| Male adult | ||||||||||
| Age at death (yr) | ||||||||||
| 50–54 | 2,221 | 20.1 | 2,231 | 20.4 | 2,137 | 19.9 | 2,044 | 19.5 | 1,843 | 17.9 |
| 55–59 | 2,191 | 21.0 | 2,183 | 20.7 | 2,338 | 21.9 | 2,249 | 21.1 | 2,147 | 20.1 |
| 60–64 | 1,711 | 19.3 | 1,672 | 18.4 | 1,851 | 19.9 | 1,937 | 20.3 | 1,826 | 18.8 |
| 65–69 | 961 | 13.3 | 1,058 | 14.0 | 1,259 | 15.9 | 1,319 | 16.7 | 1,340 | 16.7 |
| 70–74 | 526 | 10.3 | 592 | 11.2 | 649 | 11.9 | 715 | 12.0 | 748 | 12.0 |
| 75–79 | 256 | 7.3 | 309 | 8.6 | 308 | 8.3 | 393 | 10.1 | 435 | 10.5 |
| 80–84 | 124 | 5.2 | 144 | 6.0 | 172 | 7.0 | 183 | 7.3 | 193 | 7.5 |
| ≥85 | 53 | 2.5 | 63 | 2.9 | 85 | 3.8 | 102 | 4.5 | 90 | 3.9 |
| Race/Ethnicity | ||||||||||
| American Indian/Alaska Native | 23 | 7.4 | 27 | 8.5 | 23 | 7.1 | 19 | 5.7 | 14 | 4.1 |
| Asianb | 18 | 0.8 | 33 | 1.5 | 48 | 2.1 | 43 | 1.8 | 45 | 1.8 |
| Black/African American | 3,186 | 64.7 | 3,227 | 63.8 | 3,397 | 65.6 | 3,454 | 65.4 | 3,250 | 60.4 |
| Hispanic/Latinoc | 1,268 | 25.8 | 1,215 | 23.5 | 1,348 | 24.8 | 1,397 | 24.6 | 1,453 | 24.4 |
| Native Hawaiian/other Pacific Islander | 5 | 8.1 | 4 | 6.2 | 4 | 5.9 | 4 | 5.7 | 6 | 8.2 |
| White | 3,057 | 8.1 | 3,205 | 8.4 | 3,448 | 8.9 | 3,461 | 8.9 | 3,279 | 8.4 |
| Multiple races | 484 | 111.1 | 539 | 119.3 | 528 | 113.2 | 563 | 117.0 | 575 | 115.9 |
| Region of residenced | ||||||||||
| Northeast | 1,962 | 21.0 | 1,971 | 20.8 | 2,059 | 21.5 | 2,059 | 21.3 | 1,959 | 20.1 |
| Midwest | 954 | 8.6 | 967 | 8.6 | 1,018 | 8.9 | 1,012 | 8.8 | 1,111 | 9.5 |
| South | 3,652 | 19.5 | 3,770 | 19.7 | 4,048 | 20.7 | 4,139 | 20.8 | 3,784 | 18.7 |
| West | 1,475 | 12.9 | 1,544 | 13.2 | 1,674 | 14.0 | 1,732 | 14.3 | 1,768 | 14.3 |
| Subtotal, male adulte | 8,043 | 15.9 | 8,252 | 16.0 | 8,799 | 16.8 | 8,942 | 16.8 | 8,622 | 16.0 |
| Female adult | ||||||||||
| Age at death (yr) | ||||||||||
| 50–54 | 738 | 6.4 | 714 | 6.3 | 710 | 6.4 | 690 | 6.4 | 639 | 6.0 |
| 55–59 | 714 | 6.5 | 658 | 5.9 | 661 | 5.9 | 721 | 6.4 | 630 | 5.6 |
| 60–64 | 491 | 5.1 | 484 | 4.9 | 567 | 5.6 | 556 | 5.3 | 596 | 5.6 |
| 65–69 | 264 | 3.3 | 261 | 3.1 | 311 | 3.5 | 351 | 3.9 | 342 | 3.8 |
| 70–74 | 132 | 2.2 | 164 | 2.7 | 159 | 2.5 | 148 | 2.1 | 171 | 2.4 |
| 75–79 | 80 | 1.8 | 77 | 1.7 | 83 | 1.8 | 95 | 2.0 | 99 | 1.9 |
| 80–84 | 36 | 1.1 | 37 | 1.1 | 35 | 1.0 | 46 | 1.3 | 54 | 1.5 |
| ≥85 | 22 | 0.5 | 18 | 0.4 | 24 | 0.6 | 36 | 0.9 | 33 | 0.8 |
| Race/Ethnicity | ||||||||||
| American Indian/Alaska Native | 14 | 4.0 | 8 | 2.2 | 3 | 0.8 | 7 | 1.8 | 10 | 2.6 |
| Asianb | 7 | 0.3 | 5 | 0.2 | 7 | 0.2 | 9 | 0.3 | 7 | 0.2 |
| Black/African American | 1,478 | 23.5 | 1,438 | 22.3 | 1,492 | 22.6 | 1,509 | 22.4 | 1,462 | 21.3 |
| Hispanic/Latinoc | 353 | 6.4 | 318 | 5.5 | 399 | 6.6 | 404 | 6.4 | 394 | 5.9 |
| Native Hawaiian/other Pacific Islander | 1 | 1.5 | 0 | 0.0 | 3 | 4.1 | 1 | 1.3 | 0 | 0.0 |
| White | 447 | 1.0 | 486 | 1.1 | 484 | 1.1 | 539 | 1.2 | 511 | 1.2 |
| Multiple races | 175 | 34.8 | 157 | 30.1 | 162 | 30.0 | 173 | 31.1 | 180 | 31.3 |
| Region of residenced | ||||||||||
| Northeast | 765 | 7.0 | 737 | 6.6 | 784 | 7.0 | 824 | 7.3 | 781 | 6.9 |
| Midwest | 202 | 1.6 | 233 | 1.8 | 236 | 1.8 | 234 | 1.8 | 246 | 1.9 |
| South | 1,297 | 6.0 | 1,218 | 5.5 | 1,303 | 5.8 | 1,355 | 5.9 | 1,273 | 5.4 |
| West | 213 | 1.7 | 225 | 1.7 | 227 | 1.7 | 230 | 1.7 | 264 | 1.9 |
| Subtotal, female adulte | 2,477 | 4.3 | 2,413 | 4.1 | 2,550 | 4.3 | 2,643 | 4.3 | 2,564 | 4.2 |
| Totale | 10,520 | 9.7 | 10,665 | 9.6 | 11,349 | 10.1 | 11,585 | 10.2 | 11,186 | 9.7 |
Note. Deaths of persons with a diagnosis of HIV infection may be due to any cause. Data for the year 2018 are considered preliminary and are based on death data reported to the Centers for Disease Control and Prevention through December 2019. Numbers less than 12, and rates and trends based on these numbers, should be interpreted with caution.
aRates are per 100,000 population.
bIncludes Asian/Pacific Islander legacy cases.
cHispanics/Latinos can be of any race.
dData are based on residence at death. When information on residence at death was not available, state at death (where a person’s death occurred) was used.
eIncludes persons of unknown race/ethnicity.
| 2014 | 2015 | 2016 | 2017 | 2018 | ||||||
|---|---|---|---|---|---|---|---|---|---|---|
| No. | Ratea | No. | Ratea | No. | Ratea | No. | Ratea | No. | Ratea | |
| Male adult | ||||||||||
| Age at death (yr) | ||||||||||
| 50–54 | 2,282 | 20.4 | 2,303 | 20.8 | 2,192 | 20.2 | 2,100 | 19.8 | 1,879 | 18.1 |
| 55–59 | 2,261 | 21.5 | 2,229 | 20.9 | 2,395 | 22.2 | 2,306 | 21.4 | 2,199 | 20.4 |
| 60–64 | 1,759 | 19.6 | 1,710 | 18.6 | 1,895 | 20.1 | 1,966 | 20.4 | 1,865 | 19.0 |
| 65–69 | 995 | 13.6 | 1,078 | 14.0 | 1,285 | 16.0 | 1,352 | 16.9 | 1,364 | 16.8 |
| 70–74 | 536 | 10.4 | 600 | 11.2 | 670 | 12.1 | 726 | 12.1 | 768 | 12.2 |
| 75–79 | 264 | 7.4 | 321 | 8.8 | 316 | 8.4 | 402 | 10.2 | 449 | 10.7 |
| 80–84 | 132 | 5.5 | 147 | 6.0 | 176 | 7.1 | 189 | 7.4 | 197 | 7.5 |
| ≥85 | 54 | 2.5 | 64 | 2.9 | 88 | 3.9 | 104 | 4.5 | 94 | 4.0 |
| Race/Ethnicity | ||||||||||
| American Indian/Alaska Native | 23 | – | 27 | – | 23 | – | 19 | – | 14 | – |
| Asianb | 20 | – | 33 | – | 48 | – | 43 | – | 45 | – |
| Black/African American | 3,190 | – | 3,229 | – | 3,402 | – | 3,458 | – | 3,250 | – |
| Hispanic/Latinoc | 1,502 | – | 1,412 | – | 1,559 | – | 1,595 | – | 1,644 | – |
| Native Hawaiian/other Pacific Islander | 5 | – | 5 | – | 5 | – | 4 | – | 6 | – |
| White | 3,057 | – | 3,205 | – | 3,448 | – | 3,462 | – | 3,280 | – |
| Multiple races | 484 | – | 539 | – | 529 | – | 563 | – | 576 | – |
| Region of residenced | ||||||||||
| Northeast | 1,962 | 21.0 | 1,971 | 20.8 | 2,059 | 21.5 | 2,059 | 21.3 | 1,959 | 20.1 |
| Midwest | 954 | 8.6 | 967 | 8.6 | 1,018 | 8.9 | 1,012 | 8.8 | 1,111 | 9.5 |
| South | 3,652 | 19.5 | 3,770 | 19.7 | 4,048 | 20.7 | 4,139 | 20.8 | 3,784 | 18.7 |
| West | 1,475 | 12.9 | 1,544 | 13.2 | 1,674 | 14.0 | 1,732 | 14.3 | 1,768 | 14.3 |
| U.S. dependent areas | 240 | 38.4 | 200 | 31.7 | 218 | 34.2 | 203 | 31.7 | 193 | 30.2 |
| Subtotal, male adulte | 8,283 | 16.2 | 8,452 | 16.2 | 9,017 | 17.0 | 9,145 | 17.0 | 8,815 | 16.1 |
| Females | ||||||||||
| Age at death (yr) | ||||||||||
| 50–54 | 774 | 6.7 | 737 | 6.4 | 726 | 6.5 | 708 | 6.4 | 652 | 6.1 |
| 55–59 | 731 | 6.5 | 677 | 6.0 | 679 | 5.9 | 745 | 6.5 | 643 | 5.6 |
| 60–64 | 503 | 5.1 | 493 | 4.9 | 576 | 5.6 | 569 | 5.4 | 603 | 5.6 |
| 65–69 | 272 | 3.3 | 269 | 3.1 | 322 | 3.6 | 361 | 4.0 | 347 | 3.8 |
| 70–74 | 138 | 2.3 | 167 | 2.7 | 163 | 2.5 | 152 | 2.2 | 174 | 2.4 |
| 75–79 | 82 | 1.8 | 80 | 1.7 | 85 | 1.8 | 99 | 2.0 | 102 | 2.0 |
| 80–84 | 40 | 1.2 | 38 | 1.1 | 36 | 1.0 | 48 | 1.4 | 56 | 1.6 |
| ≥85 | 23 | 0.6 | 18 | 0.4 | 26 | 0.6 | 39 | 0.9 | 33 | 0.8 |
| Race/Ethnicity | ||||||||||
| American Indian/Alaska Native | 14 | – | 8 | – | 3 | – | 7 | – | 10 | – |
| Asianb | 7 | – | 5 | – | 7 | – | 9 | – | 7 | – |
| Black/African American | 1,481 | – | 1,440 | – | 1,494 | – | 1,509 | – | 1,462 | – |
| Hispanic/Latinoc | 436 | – | 382 | – | 460 | – | 482 | – | 440 | – |
| Native Hawaiian/other Pacific Islander | 1 | – | 0 | – | 3 | – | 1 | – | 0 | – |
| White | 447 | – | 486 | – | 484 | – | 539 | – | 511 | – |
| Multiple races | 175 | – | 157 | – | 162 | – | 173 | – | 180 | – |
| Region of residenced | ||||||||||
| Northeast | 765 | 7.0 | 737 | 6.6 | 784 | 7.0 | 824 | 7.3 | 781 | 6.9 |
| Midwest | 202 | 1.6 | 233 | 1.8 | 236 | 1.8 | 234 | 1.8 | 246 | 1.9 |
| South | 1,297 | 6.0 | 1,218 | 5.5 | 1,303 | 5.8 | 1,355 | 5.9 | 1,273 | 5.4 |
| West | 213 | 1.7 | 225 | 1.7 | 227 | 1.7 | 230 | 1.7 | 264 | 1.9 |
| U.S. dependent areas | 86 | 11.3 | 66 | 8.6 | 63 | 8.1 | 78 | 10.0 | 46 | 5.9 |
| Subtotal, female adulte | 2,563 | 4.4 | 2,479 | 4.1 | 2,613 | 4.3 | 2,721 | 4.4 | 2,610 | 4.2 |
| Totale | 10,846 | 9.9 | 10,931 | 9.8 | 11,630 | 10.2 | 11,866 | 10.3 | 11,425 | 9.8 |
Note. Deaths of persons with a diagnosis of HIV infection may be due to any cause. Data for the year 2018 are considered preliminary and are based on death data reported to the Centers for Disease Control and Prevention through December 2019. Numbers less than 12, and rates and trends based on these numbers, should be interpreted with caution.
aRates are per 100,000 population. Rates by race/ethnicity are not provided because U.S. census information for U.S. dependent areas is limited.
bIncludes Asian/Pacific Islander legacy cases.
cHispanics/Latinos can be of any race.
dData are based on residence at death. When information on residence at death was not available, state at death (where a person’s death occurred) was used.
eIncludes persons of unknown race/ethnicity.
| 2014 | 2015 | 2016 | 2017 | 2018 | ||||||
|---|---|---|---|---|---|---|---|---|---|---|
| No. | Ratea | No. | Ratea | No. | Ratea | No. | Ratea | No. | Ratea | |
| Aged 50–64 years at death | ||||||||||
| Male adult | ||||||||||
| Race/Ethnicity | ||||||||||
| American Indian/Alaska Native | 20 | 9.7 | 22 | 10.6 | 18 | 8.6 | 16 | 7.6 | 13 | 6.2 |
| Asianb | 14 | 1.0 | 25 | 1.8 | 24 | 1.7 | 32 | 2.2 | 29 | 1.9 |
| Black/African American | 2,433 | 73.3 | 2,386 | 70.8 | 2,465 | 72.3 | 2,410 | 70.2 | 2,195 | 63.6 |
| Hispanic/Latinoc | 1,000 | 29.5 | 931 | 26.2 | 1,022 | 27.5 | 998 | 25.8 | 1,002 | 24.9 |
| Native Hawaiian/other Pacific Islander | 5 | 11.9 | 3 | 6.9 | 4 | 9.0 | 2 | 4.4 | 5 | 10.7 |
| White | 2,285 | 10.5 | 2,302 | 10.6 | 2,407 | 11.1 | 2,359 | 11.0 | 2,174 | 10.3 |
| Multiple races | 365 | 124.8 | 415 | 138.7 | 384 | 125.9 | 412 | 132.9 | 398 | 126.5 |
| Transmission Categoryd | ||||||||||
| Male-to-male sexual contact | 2,999 | – | 3,073 | – | 3,273 | – | 3,303 | – | 3,044 | – |
| Injection drug use | 1,579 | – | 1,408 | – | 1,420 | – | 1,315 | – | 1,206 | – |
| Male-to-male sexual contact and injection drug use | 775 | – | 799 | – | 793 | – | 776 | – | 808 | – |
| Heterosexual contacte | 745 | – | 773 | – | 819 | – | 805 | – | 729 | – |
| Otherf | 25 | – | 33 | – | 22 | – | 32 | – | 29 | – |
| Region of residenceg | ||||||||||
| Notheast | 1,440 | 25.6 | 1,365 | 24.1 | 1,440 | 25.5 | 1,352 | 24.0 | 1,260 | 22.5 |
| Midwest | 745 | 11.0 | 719 | 10.6 | 763 | 11.3 | 751 | 11.2 | 794 | 12.0 |
| South | 2,822 | 25.5 | 2,878 | 25.6 | 2,926 | 25.9 | 2,938 | 25.8 | 2,600 | 22.8 |
| West | 1,116 | 16.2 | 1,124 | 16.2 | 1,197 | 17.2 | 1,189 | 17.0 | 1,162 | 16.6 |
| Subtotal, male aged 50–64 yearsh | 6,123 | 20.2 | 6,086 | 19.9 | 6,326 | 20.6 | 6,230 | 20.3 | 5,816 | 19.0 |
| Female adult | ||||||||||
| Race/Ethnicity | ||||||||||
| American Indian/Alaska Native | 11 | 4.8 | 6 | 2.6 | 3 | 1.3 | 5 | 2.1 | 8 | 3.4 |
| Asianb | 5 | 0.3 | 4 | 0.2 | 5 | 0.3 | 7 | 0.4 | 4 | 0.2 |
| Black/African American | 1,171 | 30.1 | 1,111 | 28.2 | 1,117 | 28.0 | 1,134 | 28.3 | 1,064 | 26.4 |
| Hispanic/Latinoc | 255 | 7.2 | 229 | 6.2 | 302 | 7.9 | 288 | 7.2 | 276 | 6.7 |
| Native Hawaiian/other Pacific Islander | 1 | 2.3 | 0 | 0.0 | 3 | 6.4 | 1 | 2.1 | 0 | 0.0 |
| White | 364 | 1.6 | 375 | 1.7 | 370 | 1.7 | 400 | 1.8 | 388 | 1.8 |
| Multiple races | 135 | 41.9 | 131 | 39.6 | 138 | 40.8 | 131 | 37.9 | 125 | 35.6 |
| Transmission Categoryd | ||||||||||
| Injection drug use | 839 | – | 792 | – | 792 | – | 795 | – | 730 | – |
| Heterosexual contacte | 1,095 | – | 1,055 | – | 1,135 | – | 1,165 | – | 1,125 | – |
| Otherf | 9 | – | 9 | – | 11 | – | 7 | – | 11 | – |
| Region of residenceg | ||||||||||
| Notheast | 592 | 9.9 | 564 | 9.3 | 589 | 9.7 | 587 | 9.7 | 548 | 9.1 |
| Midwest | 167 | 2.4 | 191 | 2.7 | 183 | 2.6 | 183 | 2.6 | 189 | 2.7 |
| South | 1,016 | 8.5 | 941 | 7.8 | 1,003 | 8.2 | 1,026 | 8.4 | 936 | 7.6 |
| West | 168 | 2.3 | 160 | 2.2 | 163 | 2.2 | 171 | 2.3 | 192 | 2.6 |
| Subtotal, female aged 50–64 yearsh | 1,943 | 6.0 | 1,856 | 5.7 | 1,938 | 6.0 | 1,967 | 6.0 | 1,865 | 5.7 |
| Both sexes | ||||||||||
| Race/Ethnicity | ||||||||||
| American Indian/Alaska Native | 31 | 7.2 | 28 | 6.4 | 21 | 4.8 | 21 | 4.7 | 21 | 4.7 |
| Asianb | 19 | 0.6 | 29 | 1.0 | 29 | 0.9 | 39 | 1.2 | 33 | 1.0 |
| Black/African American | 3,604 | 50.0 | 3,497 | 47.8 | 3,582 | 48.4 | 3,544 | 47.6 | 3,259 | 43.5 |
| Hispanic/Latinoc | 1,255 | 18.1 | 1,160 | 16.0 | 1,324 | 17.5 | 1,286 | 16.4 | 1,278 | 15.7 |
| Native Hawaiian/other Pacific Islander | 6 | 7.0 | 3 | 3.4 | 7 | 7.7 | 3 | 3.2 | 5 | 5.2 |
| White | 2,649 | 6.0 | 2,677 | 6.0 | 2,777 | 6.3 | 2,759 | 6.3 | 2,562 | 6.0 |
| Multiple races | 500 | 81.4 | 546 | 86.6 | 522 | 81.1 | 543 | 82.9 | 523 | 78.5 |
| Region of residenceg | ||||||||||
| Notheast | 2,032 | 17.5 | 1,929 | 16.5 | 2,029 | 17.3 | 1,939 | 16.6 | 1,808 | 15.6 |
| Midwest | 912 | 6.6 | 910 | 6.6 | 946 | 6.9 | 934 | 6.8 | 983 | 7.3 |
| South | 3,838 | 16.7 | 3,819 | 16.4 | 3,929 | 16.7 | 3,964 | 16.8 | 3,536 | 14.9 |
| West | 1,284 | 9.1 | 1,284 | 9.0 | 1,360 | 9.5 | 1,360 | 9.5 | 1,354 | 9.5 |
| Subtotal, aged 50–64 yearsh | 8,066 | 12.9 | 7,942 | 12.6 | 8,264 | 13.1 | 8,197 | 13.0 | 7,681 | 12.2 |
| Aged ≥65 years at death | ||||||||||
| Male adult | ||||||||||
| Race/Ethnicity | ||||||||||
| American Indian/Alaska Native | 3 | 2.9 | 5 | 4.5 | 5 | 4.3 | 3 | 2.4 | 1 | 0.8 |
| Asianb | 4 | 0.5 | 8 | 0.9 | 24 | 2.6 | 11 | 1.1 | 16 | 1.6 |
| Black/African American | 753 | 46.9 | 841 | 49.8 | 932 | 52.7 | 1,044 | 56.6 | 1,055 | 54.7 |
| Hispanic/Latinoc | 268 | 17.7 | 284 | 17.6 | 326 | 19.0 | 399 | 22.0 | 451 | 23.5 |
| Native Hawaiian/other Pacific Islander | 0 | 0.0 | 1 | 4.7 | 0 | 0.0 | 2 | 8.1 | 1 | 3.8 |
| White | 772 | 4.8 | 903 | 5.4 | 1,041 | 6.1 | 1,102 | 6.3 | 1,105 | 6.1 |
| Multiple races | 119 | 83.1 | 124 | 81.3 | 144 | 89.1 | 151 | 88.3 | 177 | 97.7 |
| Transmission Categoryd | ||||||||||
| Male-to-male sexual contact | 1,003 | – | 1,108 | – | 1,292 | – | 1,426 | – | 1,502 | – |
| Injection drug use | 409 | – | 470 | – | 528 | – | 556 | – | 613 | – |
| Male-to-male sexual contact and injection drug use | 100 | – | 160 | – | 167 | – | 203 | – | 207 | – |
| Heterosexual contacte | 396 | – | 412 | – | 462 | – | 512 | – | 470 | – |
| Otherf | 12 | – | 16 | – | 24 | – | 15 | – | 14 | – |
| Region of residenceg | ||||||||||
| Notheast | 522 | 14.0 | 606 | 15.8 | 619 | 15.7 | 707 | 17.5 | 699 | 16.8 |
| Midwest | 209 | 4.7 | 248 | 5.5 | 255 | 5.4 | 261 | 5.4 | 317 | 6.3 |
| South | 830 | 10.9 | 892 | 11.3 | 1,122 | 13.6 | 1,201 | 14.1 | 1,184 | 13.4 |
| West | 359 | 7.9 | 420 | 8.8 | 477 | 9.7 | 543 | 10.6 | 606 | 11.4 |
| Subtotal, male aged ≥65 yearsh | 1,920 | 9.5 | 2,166 | 10.3 | 2,473 | 11.4 | 2,712 | 12.0 | 2,806 | 12.0 |
| Female adult | ||||||||||
| Race/Ethnicity | ||||||||||
| American Indian/Alaska Native | 3 | 2.4 | 2 | 1.5 | 0 | 0.0 | 2 | 1.3 | 2 | 1.3 |
| Asianb | 2 | 0.2 | 1 | 0.1 | 2 | 0.2 | 2 | 0.2 | 3 | 0.2 |
| Black/African American | 307 | 12.8 | 327 | 13.0 | 375 | 14.3 | 375 | 13.7 | 398 | 14.0 |
| Hispanic/Latinoc | 98 | 4.9 | 89 | 4.2 | 97 | 4.3 | 116 | 4.9 | 118 | 4.7 |
| Native Hawaiian/other Pacific Islander | 0 | 0.0 | 0 | 0.0 | 0 | 0.0 | 0 | 0.0 | 0 | 0.0 |
| White | 83 | 0.4 | 111 | 0.5 | 114 | 0.5 | 139 | 0.6 | 123 | 0.6 |
| Multiple races | 40 | 22.1 | 26 | 13.6 | 24 | 11.9 | 42 | 19.8 | 55 | 24.6 |
| Transmission Categoryd | ||||||||||
| Injection drug use | 146 | – | 150 | – | 183 | – | 180 | – | 191 | – |
| Heterosexual contacte | 376 | – | 397 | – | 417 | – | 482 | – | 499 | – |
| Otherf | 12 | – | 10 | – | 12 | – | 14 | – | 9 | – |
| Region of residenceg | ||||||||||
| Notheast | 173 | 3.5 | 173 | 3.4 | 195 | 3.8 | 237 | 4.5 | 233 | 4.3 |
| Midwest | 35 | 0.6 | 42 | 0.7 | 53 | 0.9 | 51 | 0.8 | 57 | 0.9 |
| South | 281 | 2.9 | 277 | 2.8 | 300 | 2.9 | 329 | 3.1 | 337 | 3.0 |
| West | 45 | 0.8 | 65 | 1.1 | 64 | 1.1 | 59 | 1.0 | 72 | 1.1 |
| Subtotal, female aged ≥65 yearsh | 534 | 2.1 | 557 | 2.1 | 612 | 2.2 | 676 | 2.4 | 699 | 2.4 |
| Both sexes | ||||||||||
| Race/Ethnicity | ||||||||||
| American Indian/Alaska Native | 6 | 2.6 | 7 | 2.9 | 5 | 1.9 | 5 | 1.8 | 3 | 1.0 |
| Asianb | 6 | 0.3 | 9 | 0.5 | 26 | 1.2 | 13 | 0.6 | 19 | 0.8 |
| Black/African American | 1,060 | 26.4 | 1,168 | 27.8 | 1,307 | 29.7 | 1,419 | 31.0 | 1,453 | 30.5 |
| Hispanic/Latinoc | 366 | 10.4 | 373 | 10.0 | 423 | 10.7 | 515 | 12.3 | 569 | 12.9 |
| Native Hawaiian/other Pacific Islander | 0 | 0.0 | 1 | 2.2 | 0 | 0.0 | 2 | 3.8 | 1 | 1.8 |
| White | 855 | 2.4 | 1,014 | 2.7 | 1,155 | 3.0 | 1,241 | 3.2 | 1,228 | 3.1 |
| Multiple races | 159 | 49.0 | 150 | 43.7 | 168 | 46.3 | 193 | 50.4 | 232 | 57.3 |
| Region of residenceg | ||||||||||
| Notheast | 695 | 8.0 | 779 | 8.8 | 814 | 8.9 | 944 | 10.1 | 932 | 9.7 |
| Midwest | 244 | 2.4 | 290 | 2.8 | 308 | 2.9 | 312 | 2.9 | 374 | 3.3 |
| South | 1,111 | 6.4 | 1,169 | 6.5 | 1,422 | 7.7 | 1,530 | 8.0 | 1,521 | 7.7 |
| West | 404 | 4.0 | 485 | 4.6 | 541 | 5.0 | 602 | 5.3 | 678 | 5.8 |
| Subtotal, aged ≥65 yearsh | 2,454 | 5.3 | 2,723 | 5.7 | 3,085 | 6.3 | 3,388 | 6.7 | 3,505 | 6.7 |
| Totalh | 10,520 | 9.7 | 10,665 | 9.6 | 11,349 | 10.1 | 11,585 | 10.2 | 11,186 | 9.7 |
Note. Deaths of persons with a diagnosis of HIV infection may be due to any cause. Data for the year 2018 are considered preliminary and are based on death data reported to the Centers for Disease Control and Prevention through December 2019. Numbers less than 12, and rates and trends based on these numbers, should be interpreted with caution.
aRates are per 100,000 population. Rates are not calculated by transmission category because of the lack of denominator data.
bIncludes Asian/Pacific Islander legacy cases.
cHispanics/Latinos can be of any race.
dData have been statistically adjusted to account for missing transmission category; therefore, values may not sum to the column subtotals and total.
eHeterosexual contact with a person known to have, or to be at high risk for, HIV infection.
fIncludes hemophilia, blood transfusion,and risk factor not reported or not identified.
gData are based on residence at death. When information on residence at death was not available, state at death (where a person’s death occurred) was used.
hIncludes persons of unknown race/ethnicity.
| 2014 | 2015 | 2016 | 2017 | 2018 | ||||||
|---|---|---|---|---|---|---|---|---|---|---|
| No. | Ratea | No. | Ratea | No. | Ratea | No. | Ratea | No. | Ratea | |
| Aged 50–64 years at death | ||||||||||
| Male adult | ||||||||||
| Race/Ethnicity | ||||||||||
| American Indian/Alaska Native | 20 | – | 22 | – | 18 | – | 16 | – | 13 | – |
| Asianb | 15 | – | 25 | – | 24 | – | 32 | – | 29 | – |
| Black/African American | 2,434 | – | 2,388 | – | 2,468 | – | 2,413 | – | 2,195 | – |
| Hispanic/Latinoc | 1,177 | – | 1,084 | – | 1,173 | – | 1,137 | – | 1,128 | – |
| Native Hawaiian/other Pacific Islander | 5 | – | 4 | – | 5 | – | 2 | – | 5 | – |
| White | 2,285 | – | 2,302 | – | 2,407 | – | 2,359 | – | 2,174 | – |
| Multiple races | 365 | – | 415 | – | 385 | – | 412 | – | 399 | – |
| Transmission Categoryd | ||||||||||
| Male-to-male sexual contact | 3,035 | – | 3,115 | – | 3,302 | – | 3,330 | – | 3,082 | – |
| Injection drug use | 1,668 | – | 1,482 | – | 1,487 | – | 1,390 | – | 1,261 | – |
| Male-to-male sexual contact and injection drug use | 789 | – | 813 | – | 813 | – | 790 | – | 817 | – |
| Heterosexual contacte | 784 | – | 799 | – | 858 | – | 831 | – | 754 | – |
| Otherf | 26 | – | 33 | – | 22 | – | 32 | – | 29 | – |
| Region of residenceg | ||||||||||
| Northeast | 1,440 | 25.6 | 1,365 | 24.1 | 1,440 | 25.5 | 1,352 | 24.0 | 1,260 | 22.5 |
| Midwest | 745 | 11.0 | 719 | 10.6 | 763 | 11.3 | 751 | 11.2 | 794 | 12.0 |
| South | 2,822 | 25.5 | 2,878 | 25.6 | 2,926 | 25.9 | 2,938 | 25.8 | 2,600 | 22.8 |
| West | 1,116 | 16.2 | 1,124 | 16.2 | 1,197 | 17.2 | 1,189 | 17.0 | 1,162 | 16.6 |
| U.S. dependent areas | 179 | 52.5 | 156 | 45.9 | 156 | 46.0 | 142 | 42.1 | 127 | 38.2 |
| Subtotal, male aged 50–64 yearsh | 6,302 | 20.5 | 6,242 | 20.2 | 6,482 | 20.9 | 6,372 | 20.5 | 5,943 | 19.2 |
| Female adult | ||||||||||
| Race/Ethnicity | ||||||||||
| American Indian/Alaska Native | 11 | – | 6 | – | 3 | – | 5 | – | 8 | – |
| Asianb | 5 | – | 4 | – | 5 | – | 7 | – | 4 | – |
| Black/African American | 1,173 | – | 1,111 | – | 1,119 | – | 1,134 | – | 1,064 | – |
| Hispanic/Latinoc | 318 | – | 280 | – | 343 | – | 343 | – | 309 | – |
| Native Hawaiian/other Pacific Islander | 1 | – | 0 | – | 3 | – | 1 | – | 0 | – |
| White | 364 | – | 375 | – | 370 | – | 400 | – | 388 | – |
| Multiple races | 135 | – | 131 | – | 138 | – | 131 | – | 125 | – |
| Transmission Categoryd | ||||||||||
| Injection drug use | 860 | – | 803 | – | 814 | – | 811 | – | 743 | – |
| Heterosexual contacte | 1,139 | – | 1,095 | – | 1,157 | – | 1,204 | – | 1,145 | – |
| Otherf | 9 | – | 9 | – | 11 | – | 7 | – | 11 | – |
| Region of residenceg | ||||||||||
| Northeast | 592 | 9.9 | 564 | 9.3 | 589 | 9.7 | 587 | 9.7 | 548 | 9.1 |
| Midwest | 167 | 2.4 | 191 | 2.7 | 183 | 2.6 | 183 | 2.6 | 189 | 2.7 |
| South | 1,016 | 8.5 | 941 | 7.8 | 1,003 | 8.2 | 1,026 | 8.4 | 936 | 7.6 |
| West | 168 | 2.3 | 160 | 2.2 | 163 | 2.2 | 171 | 2.3 | 192 | 2.6 |
| U.S. dependent areas | 65 | 16.4 | 51 | 12.9 | 43 | 10.9 | 55 | 14.1 | 33 | 8.6 |
| Subtotal, female aged 50–64 yearsh | 2,008 | 6.2 | 1,907 | 5.8 | 1,981 | 6.0 | 2,022 | 6.1 | 1,898 | 5.8 |
| Both sexes | ||||||||||
| Race/Ethnicity | ||||||||||
| American Indian/Alaska Native | 31 | – | 28 | – | 21 | – | 21 | – | 21 | – |
| Asianb | 20 | – | 29 | – | 29 | – | 39 | – | 33 | – |
| Black/African American | 3,607 | – | 3,499 | – | 3,587 | – | 3,547 | – | 3,259 | – |
| Hispanic/Latinoc | 1,495 | – | 1,364 | – | 1,516 | – | 1,480 | – | 1,437 | – |
| Native Hawaiian/other Pacific Islander | 6 | – | 4 | – | 8 | – | 3 | – | 5 | – |
| White | 2,649 | – | 2,677 | – | 2,777 | – | 2,759 | – | 2,562 | – |
| Multiple races | 500 | – | 546 | – | 523 | – | 543 | – | 524 | – |
| Region of residenceg | ||||||||||
| Northeast | 2,032 | 17.5 | 1,929 | 16.5 | 2,029 | 17.3 | 1,939 | 16.6 | 1,808 | 15.6 |
| Midwest | 912 | 6.6 | 910 | 6.6 | 946 | 6.9 | 934 | 6.8 | 983 | 7.3 |
| South | 3,838 | 16.7 | 3,819 | 16.4 | 3,929 | 16.7 | 3,964 | 16.8 | 3,536 | 14.9 |
| West | 1,284 | 9.1 | 1,284 | 9.0 | 1,360 | 9.5 | 1,360 | 9.5 | 1,354 | 9.5 |
| U.S. dependent areas | 244 | 33.1 | 207 | 28.1 | 199 | 27.2 | 197 | 27.1 | 160 | 22.4 |
| Subtotal, aged 50–64 yearsh | 8,310 | 13.1 | 8,149 | 12.8 | 8,463 | 13.2 | 8,394 | 13.1 | 7,841 | 12.3 |
| Aged ≥65 years at death | ||||||||||
| Male adult | ||||||||||
| Race/Ethnicity | ||||||||||
| American Indian/Alaska Native | 3 | – | 5 | – | 5 | – | 3 | – | 1 | – |
| Asianb | 5 | – | 8 | – | 24 | – | 11 | – | 16 | – |
| Black/African American | 756 | – | 841 | – | 934 | – | 1,045 | – | 1,055 | – |
| Hispanic/Latinoc | 325 | – | 328 | – | 386 | – | 458 | – | 516 | – |
| Native Hawaiian/other Pacific Islander | 0 | – | 1 | – | 0 | – | 2 | – | 1 | – |
| White | 772 | – | 903 | – | 1,041 | – | 1,103 | – | 1,106 | – |
| Multiple races | 119 | – | 124 | – | 144 | – | 151 | – | 177 | – |
| Transmission Categoryd | ||||||||||
| Male-to-male sexual contact | 1,020 | – | 1,115 | – | 1,308 | – | 1,441 | – | 1,520 | – |
| Injection drug use | 420 | – | 485 | – | 545 | – | 572 | – | 629 | – |
| Male-to-male sexual contact and injection drug use | 103 | – | 163 | – | 169 | – | 205 | – | 211 | – |
| Heterosexual contacte | 427 | – | 431 | – | 489 | – | 539 | – | 499 | – |
| Otherf | 12 | – | 16 | – | 24 | – | 15 | – | 14 | – |
| Region of residenceg | ||||||||||
| Northeast | 522 | 14.0 | 606 | 15.8 | 619 | 15.7 | 707 | 17.5 | 699 | 16.8 |
| Midwest | 209 | 4.7 | 248 | 5.5 | 255 | 5.4 | 261 | 5.4 | 317 | 6.3 |
| South | 830 | 10.9 | 892 | 11.3 | 1,122 | 13.6 | 1,201 | 14.1 | 1,184 | 13.4 |
| West | 359 | 7.9 | 420 | 8.8 | 477 | 9.7 | 543 | 10.6 | 606 | 11.4 |
| U.S. dependent areas | 61 | 21.4 | 44 | 15.1 | 62 | 20.8 | 61 | 20.1 | 66 | 21.5 |
| Subtotal, male aged ≥65 yearsh | 1,981 | 9.6 | 2,210 | 10.4 | 2,535 | 11.5 | 2,773 | 12.1 | 2,872 | 12.2 |
| Female adult | ||||||||||
| Race/Ethnicity | ||||||||||
| American Indian/Alaska Native | 3 | – | 2 | – | 0 | – | 2 | – | 2 | – |
| Asianb | 2 | – | 1 | – | 2 | – | 2 | – | 3 | – |
| Black/African American | 308 | – | 329 | – | 375 | – | 375 | – | 398 | – |
| Hispanic/Latinoc | 118 | – | 102 | – | 117 | – | 139 | – | 131 | – |
| Native Hawaiian/other Pacific Islander | 0 | – | 0 | – | 0 | – | 0 | – | 0 | – |
| White | 83 | – | 111 | – | 114 | – | 139 | – | 123 | – |
| Multiple races | 40 | – | 26 | – | 24 | – | 42 | – | 55 | – |
| Transmission Categoryd | ||||||||||
| Injection drug use | 148 | – | 152 | – | 185 | – | 184 | – | 194 | – |
| Heterosexual contacte | 395 | – | 410 | – | 434 | – | 501 | – | 509 | – |
| Otherf | 12 | – | 10 | – | 13 | – | 14 | – | 9 | – |
| Region of residenceg | ||||||||||
| Northeast | 173 | 3.5 | 173 | 3.4 | 195 | 3.8 | 237 | 4.5 | 233 | 4.3 |
| Midwest | 35 | 0.6 | 42 | 0.7 | 53 | 0.9 | 51 | 0.8 | 57 | 0.9 |
| South | 281 | 2.9 | 277 | 2.8 | 300 | 2.9 | 329 | 3.1 | 337 | 3.0 |
| West | 45 | 0.8 | 65 | 1.1 | 64 | 1.1 | 59 | 1.0 | 72 | 1.1 |
| U.S. dependent areas | 21 | 5.7 | 15 | 4.0 | 20 | 5.2 | 23 | 5.9 | 13 | 3.3 |
| Subtotal, female aged ≥65 yearsh | 555 | 2.1 | 572 | 2.1 | 632 | 2.3 | 699 | 2.4 | 712 | 2.4 |
| Both sexes | ||||||||||
| Race/Ethnicity | ||||||||||
| American Indian/Alaska Native | 6 | – | 7 | – | 5 | – | 5 | – | 3 | – |
| Asianb | 7 | – | 9 | – | 26 | – | 13 | – | 19 | – |
| Black/African American | 1,064 | – | 1,170 | – | 1,309 | – | 1,420 | – | 1,453 | – |
| Hispanic/Latinoc | 443 | – | 430 | – | 503 | – | 597 | – | 647 | – |
| Native Hawaiian/other Pacific Islander | 0 | – | 1 | – | 0 | – | 2 | – | 1 | – |
| White | 855 | – | 1,014 | – | 1,155 | – | 1,242 | – | 1,229 | – |
| Multiple races | 159 | – | 150 | – | 168 | – | 193 | – | 232 | – |
| Region of residenceg | ||||||||||
| Northeast | 695 | 8.0 | 779 | 8.8 | 814 | 8.9 | 944 | 10.1 | 932 | 9.7 |
| Midwest | 244 | 2.4 | 290 | 2.8 | 308 | 2.9 | 312 | 2.9 | 374 | 3.3 |
| South | 1,111 | 6.4 | 1,169 | 6.5 | 1,422 | 7.7 | 1,530 | 8.0 | 1,521 | 7.7 |
| West | 404 | 4.0 | 485 | 4.6 | 541 | 5.0 | 602 | 5.3 | 678 | 5.8 |
| U.S. dependent areas | 82 | 12.6 | 59 | 8.8 | 82 | 12.0 | 84 | 12.1 | 79 | 11.2 |
| Subtotal, aged ≥65 yearsh | 2,536 | 5.4 | 2,782 | 5.8 | 3,167 | 6.3 | 3,472 | 6.7 | 3,584 | 6.7 |
| Totalh | 10,846 | 9.9 | 10,931 | 9.8 | 11,630 | 10.2 | 11,866 | 10.3 | 11,425 | 9.8 |
Note. Deaths of persons with a diagnosis of HIV infection may be due to any cause. Data for the year 2018 are considered preliminary and are based on death data reported to the Centers for Disease Control and Prevention through December 2019. Numbers less than 12, and rates and trends based on these numbers, should be interpreted with caution.
aRates are per 100,000 population. Rates are not calculated by transmission category because of the lack of denominator data.
bIncludes Asian/Pacific Islander legacy cases.
cHispanics/Latinos can be of any race.
dData have been statistically adjusted to account for missing transmission category; therefore, values may not sum to the column subtotals and total.
eHeterosexual contact with a person known to have, or to be at high risk for, HIV infection.
fIncludes hemophilia, blood transfusion,and risk factor not reported or not identified.
gData are based on residence at death. When information on residence at death was not available, state at death (where a person’s death occurred) was used.
hIncludes persons of unknown race/ethnicity.
50–54
| Aged 50–54 Years of Age at Diagnosis | ||||||||||
|---|---|---|---|---|---|---|---|---|---|---|
| 2014 | 2015 | 2016 | 2017 | 2018 | ||||||
| No. | Ratea | No. | Ratea | No. | Ratea | No. | Ratea | No. | Ratea | |
| Male adult | ||||||||||
| Race/Ethnicity | ||||||||||
| American Indian/Alaska Native | 9 | 11.4 | 12 | 15.4 | 7 | 9.2 | 8 | 10.8 | 4 | 5.6 |
| Asianb | 4 | 0.8 | 14 | 2.7 | 12 | 2.2 | 18 | 3.3 | 13 | 2.4 |
| Black/African American | 774 | 60.7 | 782 | 61.7 | 745 | 59.3 | 676 | 54.7 | 670 | 55.2 |
| Hispanic/Latinoc | 443 | 30.4 | 377 | 25.0 | 392 | 25.2 | 370 | 23.1 | 336 | 20.4 |
| Native Hawaiian/other Pacific Islander | 1 | 6.0 | 1 | 5.9 | 1 | 5.9 | 1 | 5.9 | 2 | 11.7 |
| White | 861 | 11.3 | 895 | 12.1 | 844 | 11.8 | 828 | 12.0 | 690 | 10.3 |
| Multiple races | 129 | 112.8 | 149 | 130.6 | 136 | 120.4 | 143 | 127.6 | 128 | 115.0 |
| Transmission Categoryd | ||||||||||
| Male-to-male sexual contact | 1,183 | – | 1,238 | – | 1,199 | – | 1,226 | – | 1,051 | – |
| Injection drug use | 456 | – | 375 | – | 371 | – | 305 | – | 275 | – |
| Male-to-male sexual contact and injection drug use | 315 | – | 330 | – | 273 | – | 254 | – | 286 | – |
| Heterosexual contacte | 254 | – | 277 | – | 286 | – | 241 | – | 218 | – |
| Otherf | 13 | – | 12 | – | 8 | – | 19 | – | 13 | – |
| Region of residenceg | ||||||||||
| Northeast | 471 | 23.0 | 415 | 20.5 | 403 | 20.4 | 403 | 20.9 | 339 | 18.1 |
| Midwest | 281 | 11.6 | 272 | 11.5 | 289 | 12.6 | 250 | 11.3 | 262 | 12.2 |
| South | 1,051 | 25.8 | 1,106 | 27.2 | 1,028 | 25.6 | 985 | 25.0 | 853 | 22.0 |
| West | 418 | 16.7 | 438 | 17.6 | 417 | 17.1 | 406 | 16.9 | 389 | 16.4 |
| Subtotal, Male adulth | 2,221 | 20.1 | 2,231 | 20.4 | 2,137 | 19.9 | 2,044 | 19.5 | 1,843 | 17.9 |
| Female adult | ||||||||||
| Race/Ethnicity | ||||||||||
| American Indian/Alaska Native | 4 | 4.7 | 1 | 1.2 | 1 | 1.2 | 2 | 2.5 | 6 | 7.8 |
| Asianb | 1 | 0.2 | 2 | 0.3 | 3 | 0.5 | 2 | 0.3 | 1 | 0.2 |
| Black/African American | 431 | 29.8 | 414 | 28.8 | 387 | 27.2 | 392 | 28.0 | 359 | 26.0 |
| Hispanic/Latinoc | 104 | 7.1 | 102 | 6.8 | 120 | 7.8 | 91 | 5.7 | 88 | 5.4 |
| Native Hawaiian/other Pacific Islander | 1 | 5.8 | 0 | 0.0 | 0 | 0.0 | 1 | 5.7 | 0 | 0.0 |
| White | 142 | 1.8 | 149 | 2.0 | 137 | 1.9 | 155 | 2.2 | 132 | 2.0 |
| Multiple races | 54 | 42.8 | 46 | 36.3 | 62 | 49.1 | 46 | 36.7 | 53 | 42.3 |
| Transmission Categoryd | ||||||||||
| Injection drug use | 307 | – | 295 | – | 278 | – | 268 | – | 236 | – |
| Heterosexual contacte | 427 | – | 416 | – | 430 | – | 420 | – | 400 | – |
| Otherf | 4 | – | 3 | – | 2 | – | 2 | – | 3 | – |
| Region of residenceg | ||||||||||
| Northeast | 215 | 10.0 | 225 | 10.6 | 207 | 9.9 | 196 | 9.6 | 187 | 9.5 |
| Midwest | 54 | 2.2 | 56 | 2.3 | 73 | 3.1 | 65 | 2.9 | 64 | 2.9 |
| South | 407 | 9.5 | 376 | 8.8 | 375 | 8.9 | 372 | 9.0 | 326 | 8.0 |
| West | 62 | 2.4 | 57 | 2.3 | 55 | 2.2 | 57 | 2.3 | 62 | 2.6 |
| Subtotal, Female adulth | 738 | 6.4 | 714 | 6.3 | 710 | 6.4 | 690 | 6.4 | 639 | 6.0 |
| Both sexes | ||||||||||
| Race/Ethnicity | ||||||||||
| American Indian/Alaska Native | 13 | 7.9 | 13 | 8.0 | 8 | 5.1 | 10 | 6.5 | 10 | 6.7 |
| Asianb | 5 | 0.5 | 16 | 1.4 | 15 | 1.3 | 20 | 1.7 | 14 | 1.2 |
| Black/African American | 1,205 | 44.3 | 1,196 | 44.2 | 1,132 | 42.2 | 1,068 | 40.5 | 1,029 | 39.7 |
| Hispanic/Latinoc | 547 | 18.8 | 479 | 15.9 | 512 | 16.5 | 461 | 14.5 | 424 | 13.0 |
| Native Hawaiian/other Pacific Islander | 2 | 5.9 | 1 | 2.9 | 1 | 2.9 | 2 | 5.8 | 2 | 5.8 |
| White | 1,003 | 6.5 | 1,044 | 7.0 | 981 | 6.8 | 983 | 7.1 | 822 | 6.1 |
| Multiple races | 183 | 76.1 | 195 | 81.0 | 198 | 82.8 | 189 | 79.6 | 181 | 76.5 |
| Region of residenceg | ||||||||||
| Northeast | 686 | 16.3 | 640 | 15.4 | 610 | 15.0 | 599 | 15.1 | 526 | 13.7 |
| Midwest | 335 | 6.8 | 328 | 6.9 | 362 | 7.8 | 315 | 7.0 | 326 | 7.5 |
| South | 1,458 | 17.4 | 1,482 | 17.8 | 1,403 | 17.1 | 1,357 | 16.8 | 1,179 | 14.9 |
| West | 480 | 9.5 | 495 | 9.9 | 472 | 9.6 | 463 | 9.6 | 451 | 9.5 |
| Totalh | 2,959 | 13.1 | 2,945 | 13.2 | 2,847 | 13.1 | 2,734 | 12.8 | 2,482 | 11.9 |
55–59
| Aged 55–59 Years of Age at Diagnosis | ||||||||||
|---|---|---|---|---|---|---|---|---|---|---|
| 2014 | 2015 | 2016 | 2017 | 2018 | ||||||
| No. | Ratea | No. | Ratea | No. | Ratea | No. | Ratea | No. | Ratea | |
| Male adult | ||||||||||
| Race/Ethnicity | ||||||||||
| American Indian/Alaska Native | 10 | 14.2 | 8 | 11.1 | 5 | 6.8 | 4 | 5.4 | 6 | 8.1 |
| Asianb | 5 | 1.1 | 7 | 1.5 | 8 | 1.7 | 7 | 1.4 | 9 | 1.8 |
| Black/African American | 904 | 78.4 | 871 | 73.7 | 937 | 78.3 | 884 | 73.5 | 780 | 64.6 |
| Hispanic/Latinoc | 324 | 28.8 | 308 | 26.0 | 392 | 31.6 | 357 | 27.5 | 366 | 27.0 |
| Native Hawaiian/other Pacific Islander | 4 | 28.2 | 2 | 13.4 | 2 | 12.8 | 0 | 0.0 | 1 | 6.1 |
| White | 808 | 10.8 | 839 | 11.1 | 852 | 11.3 | 843 | 11.2 | 834 | 11.3 |
| Multiple races | 135 | 133.8 | 147 | 141.3 | 141 | 132 | 153 | 140.9 | 151 | 137.2 |
| Transmission Categoryd | ||||||||||
| Male-to-male sexual contact | 1,029 | – | 1,091 | – | 1,197 | – | 1,162 | – | 1,133 | – |
| Injection drug use | 616 | – | 538 | – | 528 | – | 489 | – | 452 | – |
| Male-to-male sexual contact and injection drug use | 283 | – | 273 | – | 312 | – | 291 | – | 293 | – |
| Heterosexual contacte | 255 | – | 271 | – | 295 | – | 301 | – | 257 | – |
| Otherf | 8 | – | 11 | – | 7 | – | 7 | – | 13 | – |
| Region of residenceg | ||||||||||
| Northeast | 544 | 27.9 | 509 | 25.9 | 542 | 27.4 | 481 | 24.5 | 480 | 24.6 |
| Midwest | 258 | 11.0 | 254 | 10.8 | 270 | 11.4 | 272 | 11.6 | 283 | 12.2 |
| South | 993 | 26.3 | 1,035 | 26.9 | 1,092 | 27.9 | 1,068 | 27.1 | 962 | 24.3 |
| West | 396 | 16.9 | 385 | 16.1 | 434 | 18.0 | 428 | 17.7 | 422 | 17.4 |
| Subtotal, Male adulth | 2,191 | 21.0 | 2,183 | 20.7 | 2,338 | 21.9 | 2,249 | 21.1 | 2,147 | 20.1 |
| Female adult | ||||||||||
| Race/Ethnicity | ||||||||||
| American Indian/Alaska Native | 6 | 7.6 | 3 | 3.7 | 1 | 1.2 | 3 | 3.6 | 2 | 2.4 |
| Asianb | 3 | 0.6 | 1 | 0.2 | 2 | 0.4 | 1 | 0.2 | 2 | 0.3 |
| Black/African American | 449 | 33.5 | 398 | 29.0 | 372 | 26.8 | 415 | 29.8 | 345 | 24.6 |
| Hispanic/Latinoc | 90 | 7.6 | 73 | 5.9 | 100 | 7.8 | 110 | 8.2 | 109 | 7.8 |
| Native Hawaiian/other Pacific Islander | 0 | 0.0 | 0 | 0.0 | 1 | 6.2 | 0 | 0.0 | 0 | 0.0 |
| White | 123 | 1.6 | 135 | 1.7 | 140 | 1.8 | 144 | 1.9 | 140 | 1.8 |
| Multiple races | 43 | 39.0 | 48 | 42.0 | 45 | 38.4 | 48 | 40.0 | 32 | 26.2 |
| Transmission Categoryd | ||||||||||
| Injection drug use | 326 | – | 294 | – | 272 | – | 305 | – | 246 | – |
| Heterosexual contacte | 386 | – | 361 | – | 384 | – | 412 | – | 379 | – |
| Otherf | 2 | – | 3 | – | 6 | – | 4 | – | 5 | – |
| Region of residenceg | ||||||||||
| Northeast | 228 | 11.0 | 205 | 9.8 | 201 | 9.6 | 215 | 10.3 | 198 | 9.5 |
| Midwest | 62 | 2.5 | 75 | 3.1 | 56 | 2.3 | 73 | 3.0 | 66 | 2.7 |
| South | 368 | 9.0 | 314 | 7.6 | 353 | 8.4 | 367 | 8.7 | 304 | 7.1 |
| West | 56 | 2.3 | 64 | 2.6 | 51 | 2.0 | 66 | 2.6 | 62 | 2.5 |
| Subtotal, Female adulth | 714 | 6.5 | 658 | 5.9 | 661 | 5.9 | 721 | 6.4 | 630 | 5.6 |
| Both sexes | ||||||||||
| Race/Ethnicity | ||||||||||
| American Indian/Alaska Native | 16 | 10.7 | 11 | 7.2 | 6 | 3.9 | 7 | 4.5 | 8 | 5.1 |
| Asianb | 8 | 0.8 | 8 | 0.8 | 10 | 1.0 | 8 | 0.8 | 11 | 1.0 |
| Black/African American | 1,353 | 54.2 | 1,269 | 49.7 | 1,309 | 50.6 | 1,299 | 50.0 | 1,125 | 43.1 |
| Hispanic/Latinoc | 414 | 18.0 | 381 | 15.7 | 492 | 19.5 | 467 | 17.7 | 475 | 17.3 |
| Native Hawaiian/other Pacific Islander | 4 | 13.8 | 2 | 6.6 | 3 | 9.5 | 0 | 0.0 | 1 | 3.0 |
| White | 931 | 6.1 | 974 | 6.3 | 992 | 6.4 | 987 | 6.5 | 974 | 6.5 |
| Multiple races | 178 | 84.3 | 195 | 89.4 | 186 | 83.0 | 201 | 88.0 | 183 | 78.8 |
| Region of residenceg | ||||||||||
| Northeast | 772 | 19.2 | 714 | 17.6 | 743 | 18.2 | 696 | 17.1 | 678 | 16.8 |
| Midwest | 320 | 6.7 | 329 | 6.8 | 326 | 6.7 | 345 | 7.2 | 349 | 7.4 |
| South | 1,361 | 17.3 | 1,349 | 16.9 | 1,445 | 17.8 | 1,435 | 17.6 | 1,266 | 15.4 |
| West | 452 | 9.4 | 449 | 9.2 | 485 | 9.8 | 494 | 10.0 | 484 | 9.8 |
| Totalh | 2,905 | 13.5 | 2,841 | 13.1 | 2,999 | 13.7 | 2,970 | 13.5 | 2,777 | 12.7 |
60–64
| Aged 60–64 Years of Age at Diagnosis | ||||||||||
|---|---|---|---|---|---|---|---|---|---|---|
| 2014 | 2015 | 2016 | 2017 | 2018 | ||||||
| No. | Ratea | No. | Ratea | No. | Ratea | No. | Ratea | No. | Ratea | |
| Male adult | ||||||||||
| Race/Ethnicity | ||||||||||
| American Indian/Alaska Native | 1 | 1.8 | 2 | 3.4 | 6 | 10.1 | 4 | 6.4 | 3 | 4.7 |
| Asianb | 5 | 1.3 | 4 | 1.0 | 4 | 1.0 | 7 | 1.6 | 7 | 1.6 |
| Black/African American | 755 | 84.9 | 733 | 79.4 | 783 | 81.9 | 850 | 85.2 | 745 | 72.2 |
| Hispanic/Latinoc | 233 | 28.7 | 246 | 28.5 | 238 | 26.0 | 271 | 27.9 | 300 | 29.3 |
| Native Hawaiian/other Pacific Islander | 0 | 0.0 | 0 | 0.0 | 1 | 8.3 | 1 | 7.9 | 2 | 15.0 |
| White | 616 | 9.3 | 568 | 8.4 | 711 | 10.4 | 688 | 9.9 | 650 | 9.2 |
| Multiple races | 101 | 130.9 | 119 | 146.6 | 107 | 125.6 | 116 | 129.6 | 119 | 127.6 |
| Transmission Categoryd | ||||||||||
| Male-to-male sexual contact | 787 | – | 744 | – | 876 | – | 915 | – | 861 | – |
| Injection drug use | 507 | – | 496 | – | 521 | – | 522 | – | 479 | – |
| Male-to-male sexual contact and injection drug use | 177 | – | 197 | – | 208 | – | 231 | – | 228 | – |
| Heterosexual contacte | 236 | – | 225 | – | 239 | – | 263 | – | 254 | – |
| Otherf | 4 | – | 11 | – | 7 | – | 6 | – | 4 | – |
| Region of residenceg | ||||||||||
| Northeast | 425 | 26.1 | 441 | 26.4 | 495 | 29 | 468 | 26.8 | 441 | 24.8 |
| Midwest | 206 | 10.3 | 193 | 9.5 | 204 | 9.8 | 229 | 10.8 | 249 | 11.5 |
| South | 778 | 24.1 | 737 | 22.3 | 806 | 23.7 | 885 | 25.3 | 785 | 21.9 |
| West | 302 | 15.0 | 301 | 14.5 | 346 | 16.3 | 355 | 16.3 | 351 | 15.9 |
| Subtotal, Male adulth | 1,711 | 19.3 | 1,672 | 18.4 | 1,851 | 19.9 | 1,937 | 20.3 | 1,826 | 18.8 |
| Female adult | ||||||||||
| Race/Ethnicity | ||||||||||
| American Indian/Alaska Native | 1 | 1.6 | 2 | 3.0 | 1 | 1.5 | 0 | 0.0 | 0 | 0.0 |
| Asianb | 1 | 0.2 | 1 | 0.2 | 0 | 0.0 | 4 | 0.8 | 1 | 0.2 |
| Black/African American | 291 | 26.5 | 299 | 26.4 | 358 | 30.6 | 327 | 26.9 | 360 | 28.7 |
| Hispanic/Latinoc | 61 | 6.8 | 54 | 5.7 | 82 | 8.1 | 87 | 8.2 | 79 | 7.1 |
| Native Hawaiian/other Pacific Islander | 0 | 0.0 | 0 | 0.0 | 2 | 15.4 | 0 | 0.0 | 0 | 0.0 |
| White | 99 | 1.4 | 91 | 1.3 | 93 | 1.3 | 101 | 1.4 | 116 | 1.5 |
| Multiple races | 38 | 44.4 | 37 | 41.1 | 31 | 32.7 | 37 | 37.0 | 40 | 38.5 |
| Transmission Categoryd | ||||||||||
| Injection drug use | 206 | – | 203 | – | 243 | – | 222 | – | 248 | – |
| Heterosexual contacte | 282 | – | 278 | – | 321 | – | 333 | – | 345 | – |
| Otherf | 3 | – | 3 | – | 3 | – | 2 | – | 3 | – |
| Region of residenceg | ||||||||||
| Northeast | 149 | 8.4 | 134 | 7.4 | 181 | 9.8 | 176 | 9.3 | 163 | 8.4 |
| Midwest | 51 | 2.4 | 60 | 2.8 | 54 | 2.4 | 45 | 2.0 | 59 | 2.6 |
| South | 241 | 6.7 | 251 | 6.8 | 275 | 7.2 | 287 | 7.3 | 306 | 7.7 |
| West | 50 | 2.3 | 39 | 1.7 | 57 | 2.5 | 48 | 2.0 | 68 | 2.9 |
| Subtotal, Female adulth | 491 | 5.1 | 484 | 4.9 | 567 | 5.6 | 556 | 5.3 | 596 | 5.6 |
| Both sexes | ||||||||||
| Race/Ethnicity | ||||||||||
| American Indian/Alaska Native | 2 | 1.7 | 4 | 3.2 | 7 | 5.4 | 4 | 3.0 | 3 | 2.2 |
| Asianb | 6 | 0.7 | 5 | 0.6 | 4 | 0.4 | 11 | 1.2 | 8 | 0.8 |
| Black/African American | 1,046 | 52.7 | 1,032 | 50.2 | 1,141 | 53.6 | 1,177 | 53.2 | 1,105 | 48.4 |
| Hispanic/Latinoc | 294 | 17.1 | 300 | 16.5 | 320 | 16.6 | 358 | 17.6 | 379 | 17.7 |
| Native Hawaiian/other Pacific Islander | 0 | 0.0 | 0 | 0.0 | 3 | 12.0 | 1 | 3.8 | 2 | 7.2 |
| White | 715 | 5.2 | 659 | 4.7 | 804 | 5.7 | 789 | 5.5 | 766 | 5.3 |
| Multiple races | 139 | 85.4 | 156 | 91.1 | 138 | 76.6 | 153 | 80.8 | 159 | 80.6 |
| Region of residenceg | ||||||||||
| Northeast | 574 | 16.9 | 575 | 16.5 | 676 | 19.0 | 644 | 17.7 | 604 | 16.3 |
| Midwest | 257 | 6.3 | 253 | 6.0 | 258 | 6.0 | 274 | 6.3 | 308 | 6.9 |
| South | 1,019 | 14.9 | 988 | 14.1 | 1,081 | 15.0 | 1,172 | 15.8 | 1,091 | 14.4 |
| West | 352 | 8.4 | 340 | 7.9 | 403 | 9.1 | 403 | 8.9 | 419 | 9.1 |
| Totalh | 2,202 | 11.9 | 2,156 | 11.3 | 2,418 | 12.4 | 2,493 | 12.5 | 2,422 | 11.9 |
65–69
| Aged 65–69 Years of Age at Diagnosis | ||||||||||
|---|---|---|---|---|---|---|---|---|---|---|
| 2014 | 2015 | 2016 | 2017 | 2018 | ||||||
| No. | Ratea | No. | Ratea | No. | Ratea | No. | Ratea | No. | Ratea | |
| Male adult | ||||||||||
| Race/Ethnicity | ||||||||||
| American Indian/Alaska Native | 3 | 7.0 | 2 | 4.4 | 1 | 2.1 | 2 | 4.1 | 0 | 0.0 |
| Asianb | 2 | 0.7 | 6 | 1.9 | 10 | 3.0 | 4 | 1.1 | 6 | 1.7 |
| Black/African American | 384 | 60.8 | 422 | 62.5 | 528 | 73.3 | 557 | 75.3 | 566 | 74.2 |
| Hispanic/Latinoc | 118 | 20.4 | 141 | 22.8 | 149 | 22.6 | 187 | 27.1 | 210 | 29.0 |
| Native Hawaiian/other Pacific Islander | 0 | 0.0 | 0 | 0.0 | 0 | 0.0 | 1 | 10.1 | 0 | 0.0 |
| White | 390 | 6.9 | 430 | 7.3 | 486 | 8.0 | 493 | 8.2 | 460 | 7.6 |
| Multiple races | 64 | 112.9 | 57 | 93.8 | 84 | 129.8 | 75 | 112.9 | 98 | 141.3 |
| Transmission Categoryd | ||||||||||
| Male-to-male sexual contact | 494 | – | 521 | – | 603 | – | 624 | – | 664 | – |
| Injection drug use | 237 | – | 281 | – | 338 | – | 335 | – | 357 | – |
| Male-to-male sexual contact and injection drug use | 71 | – | 97 | – | 109 | – | 129 | – | 120 | – |
| Heterosexual contacte | 156 | – | 155 | – | 202 | – | 225 | – | 195 | – |
| Otherf | 4 | – | 4 | – | 8 | – | 7 | – | 4 | – |
| Region of residenceg | ||||||||||
| Northeast | 256 | 19.7 | 315 | 23.2 | 312 | 22.0 | 349 | 24.8 | 347 | 24.3 |
| Midwest | 105 | 6.8 | 133 | 8.1 | 140 | 8.1 | 131 | 7.6 | 149 | 8.4 |
| South | 420 | 15.3 | 410 | 14.3 | 575 | 19.3 | 611 | 20.6 | 585 | 19.5 |
| West | 180 | 11.0 | 200 | 11.6 | 232 | 12.8 | 228 | 12.6 | 259 | 14.0 |
| Subtotal, Male adulth | 961 | 13.3 | 1,058 | 14.0 | 1,259 | 15.9 | 1,319 | 16.7 | 1,340 | 16.7 |
| Female adult | ||||||||||
| Race/Ethnicity | ||||||||||
| American Indian/Alaska Native | 2 | 4.2 | 1 | 2.0 | 0 | 0.0 | 2 | 3.6 | 1 | 1.7 |
| Asianb | 1 | 0.3 | 0 | 0.0 | 2 | 0.5 | 0 | 0.0 | 1 | 0.2 |
| Black/African American | 159 | 19.5 | 159 | 18.3 | 195 | 20.9 | 209 | 21.7 | 195 | 19.7 |
| Hispanic/Latinoc | 36 | 5.3 | 35 | 4.8 | 42 | 5.5 | 57 | 7.1 | 50 | 5.9 |
| Native Hawaiian/other Pacific Islander | 0 | 0.0 | 0 | 0.0 | 0 | 0.0 | 0 | 0.0 | 0 | 0.0 |
| White | 42 | 0.7 | 54 | 0.9 | 57 | 0.9 | 65 | 1.0 | 57 | 0.9 |
| Multiple races | 24 | 37.2 | 12 | 17.4 | 15 | 20.5 | 18 | 24.0 | 38 | 48.3 |
| Transmission Categoryd | ||||||||||
| Injection drug use | 93 | – | 82 | – | 113 | – | 119 | – | 108 | – |
| Heterosexual contacte | 166 | – | 175 | – | 193 | – | 228 | – | 231 | – |
| Otherf | 5 | – | 4 | – | 5 | – | 4 | – | 3 | – |
| Region of residenceg | ||||||||||
| Northeast | 77 | 5.2 | 70 | 4.5 | 96 | 6.0 | 111 | 7.0 | 115 | 7.1 |
| Midwest | 20 | 1.2 | 24 | 1.3 | 31 | 1.6 | 28 | 1.5 | 29 | 1.5 |
| South | 142 | 4.6 | 143 | 4.4 | 151 | 4.4 | 178 | 5.2 | 161 | 4.7 |
| West | 25 | 1.4 | 24 | 1.3 | 33 | 1.7 | 34 | 1.7 | 37 | 1.8 |
| Subtotal, Female adulth | 264 | 3.3 | 261 | 3.1 | 311 | 3.5 | 351 | 3.9 | 342 | 3.8 |
| Both sexes | ||||||||||
| Race/Ethnicity | ||||||||||
| American Indian/Alaska Native | 5 | 5.6 | 3 | 3.1 | 1 | 1.0 | 4 | 3.9 | 1 | 0.9 |
| Asianb | 3 | 0.5 | 6 | 0.8 | 12 | 1.6 | 4 | 0.5 | 7 | 0.8 |
| Black/African American | 543 | 37.5 | 581 | 37.6 | 723 | 43.8 | 766 | 45.0 | 761 | 43.4 |
| Hispanic/Latinoc | 154 | 12.2 | 176 | 13.1 | 191 | 13.4 | 244 | 16.4 | 260 | 16.6 |
| Native Hawaiian/other Pacific Islander | 0 | 0.0 | 0 | 0.0 | 0 | 0.0 | 1 | 4.9 | 0 | 0.0 |
| White | 432 | 3.7 | 484 | 4.0 | 543 | 4.3 | 558 | 4.4 | 517 | 4.1 |
| Multiple races | 88 | 72.6 | 69 | 53.3 | 99 | 71.7 | 93 | 65.7 | 136 | 91.9 |
| Region of residenceg | ||||||||||
| Northeast | 333 | 12.0 | 385 | 13.3 | 408 | 13.5 | 460 | 15.3 | 462 | 15.2 |
| Midwest | 125 | 3.8 | 157 | 4.6 | 171 | 4.7 | 159 | 4.4 | 178 | 4.8 |
| South | 562 | 9.6 | 553 | 9.1 | 726 | 11.4 | 789 | 12.4 | 746 | 11.6 |
| West | 205 | 6.0 | 224 | 6.2 | 265 | 7.0 | 262 | 6.9 | 296 | 7.6 |
| Totalh | 1,225 | 8.0 | 1,319 | 8.2 | 1,570 | 9.3 | 1,670 | 9.9 | 1,682 | 9.8 |
70–74
| Aged 70–74 Years of Age at Diagnosis | ||||||||||
|---|---|---|---|---|---|---|---|---|---|---|
| 2014 | 2015 | 2016 | 2017 | 2018 | ||||||
| No. | Ratea | No. | Ratea | No. | Ratea | No. | Ratea | No. | Ratea | |
| Male adult | ||||||||||
| Race/Ethnicity | ||||||||||
| American Indian/Alaska Native | 0 | 0.0 | 2 | 6.9 | 1 | 3.3 | 1 | 3.0 | 0 | 0.0 |
| Asianb | 0 | 0.0 | 1 | 0.5 | 6 | 2.6 | 2 | 0.8 | 6 | 2.3 |
| Black/African American | 202 | 49.1 | 230 | 53.8 | 238 | 53.7 | 266 | 55.7 | 264 | 51.9 |
| Hispanic/Latinoc | 73 | 19.4 | 66 | 16.5 | 85 | 19.9 | 95 | 20.5 | 121 | 24.2 |
| Native Hawaiian/other Pacific Islander | 0 | 0.0 | 0 | 0.0 | 0 | 0.0 | 1 | 14.8 | 0 | 0.0 |
| White | 224 | 5.6 | 262 | 6.3 | 294 | 6.9 | 311 | 6.7 | 315 | 6.5 |
| Multiple races | 27 | 73.3 | 31 | 79.5 | 25 | 60.7 | 39 | 85.7 | 42 | 86.2 |
| Transmission Categoryd | ||||||||||
| Male-to-male sexual contact | 290 | – | 322 | – | 358 | – | 404 | – | 422 | – |
| Injection drug use | 100 | – | 110 | – | 111 | – | 127 | – | 150 | – |
| Male-to-male sexual contact and injection drug use | 20 | – | 41 | – | 41 | – | 45 | – | 47 | – |
| Heterosexual contacte | 114 | – | 116 | – | 135 | – | 135 | – | 125 | – |
| Otherf | 3 | – | 3 | – | 5 | – | 4 | – | 4 | – |
| Region of residenceg | ||||||||||
| Northeast | 134 | 14.8 | 142 | 15.2 | 156 | 16.2 | 185 | 17.7 | 182 | 16.8 |
| Midwest | 60 | 5.5 | 69 | 6.2 | 65 | 5.7 | 69 | 5.6 | 88 | 6.8 |
| South | 228 | 11.6 | 263 | 12.9 | 306 | 14.5 | 301 | 13.1 | 306 | 12.7 |
| West | 104 | 9.2 | 118 | 9.9 | 122 | 9.9 | 160 | 11.8 | 172 | 12.1 |
| Subtotal, Male adulth | 526 | 10.3 | 592 | 11.2 | 649 | 11.9 | 715 | 12.0 | 748 | 12.0 |
| Female adult | ||||||||||
| Race/Ethnicity | ||||||||||
| American Indian/Alaska Native | 0 | 0.0 | 0 | 0.0 | 0 | 0.0 | 0 | 0.0 | 0 | 0.0 |
| Asianb | 0 | 0.0 | 1 | 0.4 | 0 | 0.0 | 0 | 0.0 | 2 | 0.6 |
| Black/African American | 73 | 12.7 | 99 | 16.7 | 97 | 15.8 | 76 | 11.6 | 103 | 14.8 |
| Hispanic/Latinoc | 28 | 5.8 | 24 | 4.7 | 27 | 5.0 | 27 | 4.7 | 30 | 4.9 |
| Native Hawaiian/other Pacific Islander | 0 | 0.0 | 0 | 0.0 | 0 | 0.0 | 0 | 0.0 | 0 | 0.0 |
| White | 22 | 0.5 | 33 | 0.7 | 32 | 0.7 | 34 | 0.6 | 29 | 0.5 |
| Multiple races | 8 | 18.2 | 6 | 12.9 | 3 | 6.2 | 11 | 20.5 | 7 | 12.2 |
| Transmission Categoryd | ||||||||||
| Injection drug use | 31 | – | 48 | – | 46 | – | 34 | – | 53 | – |
| Heterosexual contacte | 99 | – | 115 | – | 111 | – | 110 | – | 117 | – |
| Otherf | 2 | – | 1 | – | 2 | – | 5 | – | 2 | – |
| Region of residenceg | ||||||||||
| Northeast | 41 | 3.7 | 52 | 4.6 | 48 | 4.2 | 58 | 4.7 | 66 | 5.1 |
| Midwest | 9 | 0.7 | 13 | 1.0 | 9 | 0.7 | 10 | 0.7 | 12 | 0.8 |
| South | 69 | 3.0 | 76 | 3.2 | 81 | 3.3 | 73 | 2.7 | 82 | 2.9 |
| West | 13 | 1.0 | 23 | 1.7 | 21 | 1.5 | 7 | 0.5 | 11 | 0.7 |
| Subtotal, Female adulth | 132 | 2.2 | 164 | 2.7 | 159 | 2.5 | 148 | 2.1 | 171 | 2.4 |
| Both sexes | ||||||||||
| Race/Ethnicity | ||||||||||
| American Indian/Alaska Native | 0 | 0.0 | 2 | 3.2 | 1 | 1.5 | 1 | 1.4 | 0 | 0.0 |
| Asianb | 0 | 0.0 | 2 | 0.4 | 6 | 1.2 | 2 | 0.4 | 8 | 1.3 |
| Black/African American | 275 | 27.9 | 329 | 32.2 | 335 | 31.7 | 342 | 30.2 | 367 | 30.4 |
| Hispanic/Latinoc | 101 | 11.8 | 90 | 9.9 | 112 | 11.6 | 122 | 11.7 | 151 | 13.5 |
| Native Hawaiian/other Pacific Islander | 0 | 0.0 | 0 | 0.0 | 0 | 0.0 | 1 | 7.2 | 0 | 0.0 |
| White | 246 | 2.9 | 295 | 3.3 | 326 | 3.6 | 345 | 3.5 | 344 | 3.3 |
| Multiple races | 35 | 43.3 | 37 | 43.3 | 28 | 31.2 | 50 | 50.4 | 49 | 46.2 |
| Region of residenceg | ||||||||||
| Northeast | 175 | 8.7 | 194 | 9.4 | 204 | 9.6 | 243 | 10.6 | 248 | 10.4 |
| Midwest | 69 | 2.9 | 82 | 3.4 | 74 | 3.0 | 79 | 3.0 | 100 | 3.6 |
| South | 297 | 7.0 | 339 | 7.6 | 387 | 8.5 | 374 | 7.5 | 388 | 7.4 |
| West | 117 | 4.8 | 141 | 5.5 | 143 | 5.4 | 167 | 5.8 | 183 | 6,0 |
| Totalh | 658 | 5.9 | 756 | 6.6 | 808 | 6.8 | 863 | 6.7 | 919 | 6.9 |
75–79
| Aged 75–79 Years of Age at Diagnosis | ||||||||||
|---|---|---|---|---|---|---|---|---|---|---|
| 2014 | 2015 | 2016 | 2017 | 2018 | ||||||
| No. | Ratea | No. | Ratea | No. | Ratea | No. | Ratea | No. | Ratea | |
| Male adult | ||||||||||
| Race/Ethnicity | ||||||||||
| American Indian/Alaska Native | 0 | 0.0 | 0 | 0.0 | 2 | 10.3 | 0 | 0.0 | 1 | 4.5 |
| Asianb | 1 | 0.7 | 1 | 0.7 | 5 | 3.1 | 3 | 1.8 | 2 | 1.1 |
| Black/African American | 107 | 39.5 | 121 | 43.1 | 101 | 34.9 | 132 | 43.8 | 136 | 42.9 |
| Hispanic/Latinoc | 42 | 16.3 | 44 | 16.3 | 45 | 15.9 | 67 | 22.6 | 72 | 22.9 |
| Native Hawaiian/other Pacific Islander | 0 | 0.0 | 0 | 0.0 | 0 | 0.0 | 0 | 0.0 | 0 | 0.0 |
| White | 91 | 3.3 | 120 | 4.2 | 132 | 4.5 | 167 | 5.4 | 203 | 6.2 |
| Multiple races | 15 | 63.5 | 23 | 91.7 | 23 | 86.9 | 24 | 85.1 | 21 | 69.4 |
| Transmission Categoryd | ||||||||||
| Male-to-male sexual contact | 130 | – | 165 | – | 168 | – | 236 | – | 253 | – |
| Injection drug use | 44 | – | 46 | – | 52 | – | 59 | – | 67 | – |
| Male-to-male sexual contact and injection drug use | 7 | – | 15 | – | 9 | – | 19 | – | 34 | – |
| Heterosexual contacte | 72 | – | 79 | – | 75 | – | 79 | – | 79 | – |
| Otherf | 2 | – | 4 | – | 5 | – | 1 | – | 2 | – |
| Region of residenceg | ||||||||||
| Northeast | 70 | 11.1 | 85 | 13.3 | 83 | 12.7 | 98 | 14.4 | 101 | 13.9 |
| Midwest | 33 | 4.3 | 25 | 3.2 | 32 | 4.0 | 37 | 4.5 | 51 | 5.8 |
| South | 110 | 8.2 | 138 | 10.0 | 128 | 8.9 | 165 | 10.9 | 179 | 11.1 |
| West | 43 | 5.5 | 61 | 7.6 | 65 | 7.8 | 93 | 10.6 | 104 | 11.1 |
| Subtotal, Male adulth | 256 | 7.3 | 309 | 8.6 | 308 | 8.3 | 393 | 10.1 | 435 | 10.5 |
| Female adult | ||||||||||
| Race/Ethnicity | ||||||||||
| American Indian/Alaska Native | 0 | 0.0 | 0 | 0.0 | 0 | 0.0 | 0 | 0.0 | 0 | 0.0 |
| Asianb | 1 | 0.6 | 0 | 0.0 | 0 | 0.0 | 0 | 0.0 | 0 | 0.0 |
| Black/African American | 45 | 10.9 | 43 | 10.1 | 49 | 11.1 | 49 | 10.7 | 53 | 11.1 |
| Hispanic/Latinoc | 17 | 4.8 | 20 | 5.4 | 19 | 4.9 | 21 | 5.2 | 24 | 5.6 |
| Native Hawaiian/other Pacific Islander | 0 | 0.0 | 0 | 0.0 | 0 | 0.0 | 0 | 0.0 | 0 | 0.0 |
| White | 11 | 0.3 | 8 | 0.2 | 12 | 0.3 | 18 | 0.5 | 17 | 0.4 |
| Multiple races | 6 | 20.2 | 6 | 19.2 | 3 | 9.1 | 7 | 20.1 | 5 | 13.3 |
| Transmission Categoryd | ||||||||||
| Injection drug use | 11 | – | 13 | – | 15 | – | 21 | – | 16 | – |
| Heterosexual contacte | 67 | – | 62 | – | 67 | – | 71 | – | 81 | – |
| Otherf | 2 | – | 1 | – | 1 | – | 3 | – | 1 | – |
| Region of residenceg | ||||||||||
| Northeast | 29 | 3.5 | 30 | 3.6 | 26 | 3.0 | 37 | 4.2 | 25 | 2.7 |
| Midwest | 3 | 0.3 | 3 | 0.3 | 8 | 0.8 | 6 | 0.6 | 11 | 1.0 |
| South | 44 | 2.6 | 36 | 2.1 | 41 | 2.3 | 41 | 2.2 | 47 | 2.4 |
| West | 4 | 0.4 | 8 | 0.8 | 8 | 0.8 | 11 | 1.1 | 16 | 1.4 |
| Subtotal, Female adulth | 80 | 1.8 | 77 | 1.7 | 83 | 1.8 | 95 | 2.0 | 99 | 1.9 |
| Both sexes | ||||||||||
| Race/Ethnicity | ||||||||||
| American Indian/Alaska Native | 0 | 0.0 | 0 | 0.0 | 2 | 4.6 | 0 | 0.0 | 1 | 2.1 |
| Asianb | 2 | 0.6 | 1 | 0.3 | 5 | 1.4 | 3 | 0.8 | 2 | 0.5 |
| Black/African American | 152 | 22.2 | 164 | 23.2 | 150 | 20.5 | 181 | 23.9 | 189 | 23.7 |
| Hispanic/Latinoc | 59 | 9.6 | 64 | 10.0 | 64 | 9.6 | 88 | 12.6 | 96 | 13.0 |
| Native Hawaiian/other Pacific Islander | 0 | 0.0 | 0 | 0.0 | 0 | 0.0 | 0 | 0.0 | 0 | 0.0 |
| White | 102 | 1.6 | 128 | 2.0 | 144 | 2.2 | 185 | 2.7 | 220 | 3.1 |
| Multiple races | 21 | 39.4 | 29 | 51.6 | 26 | 43.7 | 31 | 49.1 | 26 | 38.3 |
| Region of residenceg | ||||||||||
| Northeast | 99 | 6.8 | 115 | 7.8 | 109 | 7.2 | 135 | 8.6 | 126 | 7.6 |
| Midwest | 36 | 2.1 | 28 | 1.6 | 40 | 2.2 | 43 | 2.3 | 62 | 3.2 |
| South | 154 | 5.1 | 174 | 5.6 | 169 | 5.2 | 206 | 6.1 | 226 | 6.3 |
| West | 47 | 2.8 | 69 | 3.9 | 73 | 4.0 | 104 | 5.4 | 120 | 5.9 |
| Totalh | 336 | 4.2 | 386 | 4.8 | 391 | 4.7 | 488 | 5.6 | 534 | 5.8 |
80–84
| Aged 80–84 Years of Age at Diagnosis | ||||||||||
|---|---|---|---|---|---|---|---|---|---|---|
| 2014 | 2015 | 2016 | 2017 | 2018 | ||||||
| No. | Ratea | No. | Ratea | No. | Ratea | No. | Ratea | No. | Ratea | |
| Male adult | ||||||||||
| Race/Ethnicity | ||||||||||
| American Indian/Alaska Native | 0 | 0.0 | 0 | 0.0 | 1 | 9.1 | 0 | 0.0 | 0 | 0.0 |
| Asianb | 1 | 1.1 | 0 | 0.0 | 2 | 2.0 | 1 | 0.9 | 2 | 1.7 |
| Black/African American | 40 | 24.6 | 45 | 26.7 | 41 | 23.3 | 58 | 31.8 | 69 | 36.6 |
| Hispanic/Latinoc | 23 | 13.9 | 22 | 12.7 | 32 | 17.7 | 31 | 16.3 | 30 | 15.0 |
| Native Hawaiian/other Pacific Islander | 0 | 0.0 | 1 | 49.1 | 0 | 0.0 | 0 | 0.0 | 0 | 0.0 |
| White | 51 | 2.6 | 66 | 3.4 | 88 | 4.5 | 84 | 4.2 | 84 | 4.1 |
| Multiple races | 9 | 62.5 | 10 | 66.0 | 8 | 49.8 | 9 | 53.1 | 8 | 44.4 |
| Transmission Categoryd | ||||||||||
| Male-to-male sexual contact | 64 | – | 72 | – | 111 | – | 104 | – | 105 | – |
| Injection drug use | 17 | – | 19 | – | 20 | – | 21 | – | 30 | – |
| Male-to-male sexual contact and injection drug use | 3 | – | 6 | – | 7 | – | 9 | – | 6 | – |
| Heterosexual contacte | 40 | – | 43 | – | 31 | – | 47 | – | 52 | – |
| Otherf | 1 | – | 4 | – | 4 | – | 2 | – | 1 | – |
| Region of residenceg | ||||||||||
| Northeast | 41 | 9.1 | 46 | 10.2 | 43 | 9.5 | 50 | 10.9 | 45 | 9.7 |
| Midwest | 7 | 1.3 | 14 | 2.7 | 12 | 2.3 | 14 | 2.6 | 20 | 3.6 |
| South | 51 | 5.8 | 57 | 6.4 | 79 | 8.6 | 80 | 8.5 | 83 | 8.4 |
| West | 25 | 4.7 | 27 | 5.0 | 38 | 6.9 | 39 | 6.9 | 45 | 7.7 |
| Subtotal, Male adulth | 124 | 5.2 | 144 | 6.0 | 172 | 7.0 | 183 | 7.3 | 193 | 7.5 |
| Female adult | ||||||||||
| Race/Ethnicity | ||||||||||
| American Indian/Alaska Native | 1 | 7.3 | 0 | 0.0 | 0 | 0.0 | 0 | 0.0 | 0 | 0.0 |
| Asianb | 0 | 0.0 | 0 | 0.0 | 0 | 0.0 | 1 | 0.7 | 0 | 0.0 |
| Black/African American | 22 | 7.5 | 18 | 6.0 | 21 | 6.8 | 26 | 8.2 | 32 | 9.8 |
| Hispanic/Latinoc | 8 | 3.2 | 7 | 2.7 | 6 | 2.2 | 7 | 2.5 | 7 | 2.4 |
| Native Hawaiian/other Pacific Islander | 0 | 0.0 | 0 | 0.0 | 0 | 0.0 | 0 | 0.0 | 0 | 0.0 |
| White | 4 | 0.1 | 10 | 0.4 | 5 | 0.2 | 9 | 0.3 | 12 | 0.4 |
| Multiple races | 1 | 4.8 | 2 | 9.3 | 3 | 13.4 | 3 | 12.9 | 3 | 12.4 |
| Transmission Categoryd | ||||||||||
| Injection drug use | 6 | – | 5 | – | 4 | – | 5 | – | 7 | – |
| Heterosexual contacte | 28 | – | 29 | – | 30 | – | 40 | – | 46 | – |
| Otherf | 1 | – | 3 | – | 1 | – | 1 | – | 1 | – |
| Region of residenceg | ||||||||||
| Northeast | 19 | 2.8 | 13 | 1.9 | 15 | 2.3 | 17 | 2.6 | 14 | 2.1 |
| Midwest | 1 | 0.1 | 1 | 0.1 | 3 | 0.4 | 3 | 0.4 | 2 | 0.3 |
| South | 15 | 1.2 | 15 | 1.2 | 16 | 1.3 | 23 | 1.8 | 32 | 2.4 |
| West | 1 | 0.1 | 8 | 1.1 | 1 | 0.1 | 3 | 0.4 | 6 | 0.8 |
| Subtotal, Female adulth | 36 | 1.1 | 37 | 1.1 | 35 | 1.0 | 46 | 1.3 | 54 | 1.5 |
| Both sexes | ||||||||||
| Race/Ethnicity | ||||||||||
| American Indian/Alaska Native | 1 | 4.3 | 0 | 0.0 | 1 | 3.8 | 0 | 0.0 | 0 | 0.0 |
| Asianb | 1 | 0.5 | 0 | 0.0 | 2 | 0.8 | 2 | 0.8 | 2 | 0.7 |
| Black/African American | 62 | 13.6 | 63 | 13.5 | 62 | 12.8 | 84 | 16.8 | 101 | 19.7 |
| Hispanic/Latinoc | 31 | 7.5 | 29 | 6.7 | 38 | 8.4 | 38 | 8.1 | 37 | 7.5 |
| Native Hawaiian/other Pacific Islander | 0 | 0.0 | 1 | 21.7 | 0 | 0.0 | 0 | 0.0 | 0 | 0.0 |
| White | 55 | 1.2 | 76 | 1.7 | 93 | 2.0 | 93 | 2.0 | 96 | 2.0 |
| Multiple races | 10 | 28.4 | 12 | 32.7 | 11 | 28.6 | 12 | 29.9 | 11 | 26.1 |
| Region of residenceg | ||||||||||
| Northeast | 60 | 5.3 | 59 | 5.3 | 58 | 5.2 | 67 | 6.0 | 59 | 5.2 |
| Midwest | 8 | 0.6 | 15 | 1.2 | 15 | 1.2 | 17 | 1.3 | 22 | 1.7 |
| South | 66 | 3.1 | 72 | 3.3 | 95 | 4.3 | 103 | 4.6 | 115 | 5 |
| West | 26 | 2.1 | 35 | 2.8 | 39 | 3.1 | 42 | 3.3 | 51 | 3.8 |
| Totalh | 160 | 2.8 | 181 | 3.1 | 207 | 3.5 | 229 | 3.8 | 247 | 4.0 |
85+
| Aged 85+ Years of Age at Diagnosis | ||||||||||
|---|---|---|---|---|---|---|---|---|---|---|
| 2014 | 2015 | 2016 | 2017 | 2018 | ||||||
| No. | Ratea | No. | Ratea | No. | Ratea | No. | Ratea | No. | Ratea | |
| Male adult | ||||||||||
| Race/Ethnicity | ||||||||||
| American Indian/Alaska Native | 0 | 0.0 | 1 | 13.0 | 0 | 0.0 | 0 | 0.0 | 0 | 0.0 |
| Asianb | 0 | 0.0 | 0 | 0.0 | 1 | 1.2 | 1 | 1.1 | 0 | 0.0 |
| Black/African American | 20 | 15.5 | 23 | 17.0 | 24 | 17.1 | 31 | 21.4 | 20 | 13.2 |
| Hispanic/Latinoc | 12 | 8.7 | 11 | 7.3 | 15 | 9.3 | 19 | 11.0 | 18 | 9.9 |
| Native Hawaiian/other Pacific Islander | 0 | 0.0 | 0 | 0.0 | 0 | 0.0 | 0 | 0.0 | 1 | 49.3 |
| White | 16 | 0.9 | 25 | 1.4 | 41 | 2.3 | 47 | 2.5 | 43 | 2.3 |
| Multiple races | 4 | 34.3 | 3 | 24.1 | 4 | 30.3 | 4 | 28.5 | 8 | 53.9 |
| Transmission Categoryd | ||||||||||
| Male-to-male sexual contact | 25 | – | 27 | – | 53 | – | 59 | – | 58 | – |
| Injection drug use | 11 | – | 14 | – | 8 | – | 14 | – | 9 | – |
| Male-to-male sexual contact and injection drug use | 1 | – | 1 | – | 2 | – | 2 | – | 1 | – |
| Heterosexual contacte | 15 | – | 19 | – | 19 | – | 27 | – | 19 | – |
| Otherf | 1 | – | 2 | – | 4 | – | 1 | – | 3 | – |
| Region of residenceg | ||||||||||
| Northeast | 21 | 4.9 | 18 | 4.1 | 25 | 5.6 | 25 | 5.5 | 24 | 5.3 |
| Midwest | 4 | 0.8 | 7 | 1.4 | 6 | 1.2 | 10 | 2.0 | 9 | 1.8 |
| South | 21 | 2.9 | 24 | 3.2 | 34 | 4.4 | 44 | 5.5 | 31 | 3.8 |
| West | 7 | 1.5 | 14 | 2.8 | 20 | 3.9 | 23 | 4.4 | 26 | 4.8 |
| Subtotal, Male adulth | 53 | 2.5 | 63 | 2.9 | 85 | 3.8 | 102 | 4.5 | 90 | 3.9 |
| Female adult | ||||||||||
| Race/Ethnicity | ||||||||||
| American Indian/Alaska Native | 0 | 0.0 | 1 | 7.3 | 0 | 0.0 | 0 | 0.0 | 1 | 6.1 |
| Asianb | 0 | 0.0 | 0 | 0.0 | 0 | 0.0 | 1 | 0.6 | 0 | 0.0 |
| Black/African American | 8 | 2.6 | 8 | 2.5 | 13 | 3.9 | 15 | 4.4 | 15 | 4.3 |
| Hispanic/Latinoc | 9 | 3.7 | 3 | 1.1 | 3 | 1.1 | 4 | 1.3 | 7 | 2.2 |
| Native Hawaiian/other Pacific Islander | 0 | 0.0 | 0 | 0.0 | 0 | 0.0 | 0 | 0.0 | 0 | 0.0 |
| White | 4 | 0.1 | 6 | 0.2 | 8 | 0.2 | 13 | 0.4 | 8 | 0.2 |
| Multiple races | 1 | 4.6 | 0 | 0.0 | 0 | 0.0 | 3 | 12.1 | 2 | 7.7 |
| Transmission Categoryd | ||||||||||
| Injection drug use | 4 | – | 2 | – | 4 | – | 1 | – | 7 | – |
| Heterosexual contacte | 16 | – | 15 | – | 16 | – | 34 | – | 24 | – |
| Otherf | 2 | – | 2 | – | 4 | – | 1 | – | 2 | – |
| Region of residenceg | ||||||||||
| Northeast | 7 | 0.8 | 8 | 0.9 | 10 | 1.1 | 14 | 1.6 | 13 | 1.5 |
| Midwest | 2 | 0.2 | 1 | 0.1 | 2 | 0.2 | 4 | 0.4 | 3 | 0.3 |
| South | 11 | 0.8 | 7 | 0.5 | 11 | 0.8 | 14 | 1.0 | 15 | 1.0 |
| West | 2 | 0.2 | 2 | 0.2 | 1 | 0.1 | 4 | 0.5 | 2 | 0.2 |
| Subtotal, Female adulth | 22 | 0.5 | 18 | 0.4 | 24 | 0.6 | 36 | 0.9 | 33 | 0.8 |
| Both sexes | ||||||||||
| Race/Ethnicity | ||||||||||
| American Indian/Alaska Native | 0 | 0.0 | 2 | 9.4 | 0 | 0.0 | 0 | 0.0 | 1 | 3.9 |
| Asianb | 0 | 0.0 | 0 | 0.0 | 1 | 0.4 | 2 | 0.8 | 0 | 0.0 |
| Black/African American | 28 | 6.3 | 31 | 6.8 | 37 | 7.8 | 46 | 9.5 | 35 | 7.0 |
| Hispanic/Latinoc | 21 | 5.5 | 14 | 3.4 | 18 | 4.0 | 23 | 4.9 | 25 | 5.0 |
| Native Hawaiian/other Pacific Islander | 0 | 0.0 | 0 | 0.0 | 0 | 0.0 | 0 | 0.0 | 1 | 19.3 |
| White | 20 | 0.4 | 31 | 0.6 | 49 | 0.9 | 60 | 1.2 | 51 | 1.0 |
| Multiple races | 5 | 14.9 | 3 | 8.5 | 4 | 10.8 | 7 | 18.0 | 10 | 24.5 |
| Region of residenceg | ||||||||||
| Northeast | 28 | 2.1 | 26 | 2.0 | 35 | 2.6 | 39 | 2.9 | 37 | 2.7 |
| Midwest | 6 | 0.4 | 8 | 0.6 | 8 | 0.5 | 14 | 1.0 | 12 | 0.8 |
| South | 32 | 1.5 | 31 | 1.4 | 45 | 2.0 | 58 | 2.6 | 46 | 2.0 |
| West | 9 | 0.7 | 16 | 1.2 | 21 | 1.5 | 27 | 1.9 | 28 | 2.0 |
| Totalh | 75 | 1.2 | 81 | 1.3 | 109 | 1.7 | 138 | 2.1 | 123 | 1.9 |
Note. Deaths of persons with a diagnosis of HIV infection may be due to any cause. Data for the year 2018 are considered preliminary and are based on death data reported to the Centers for Disease Control and Prevention through December 2019. Numbers less than 12, and rates and trends based on these numbers, should be interpreted with caution.
aRates are per 100,000 population. Rates are not calculated by transmission category because of the lack of denominator data.
bIncludes Asian/Pacific Islander legacy cases.
cHispanics/Latinos can be of any race.
dData have been statistically adjusted to account for missing transmission category; therefore, values may not sum to the column subtotals and total.
eHeterosexual contact with a person known to have, or to be at high risk for, HIV infection.
fIncludes hemophilia, blood transfusion, and risk factor not reported or not identified.
gData are based on residence at death. When information on residence at death was not available, state at death (where a person’s death occurred) was used.
hIncludes persons of unknown race/ethnicity.
50–54
| Aged 50–54 Years of Age at Diagnosis | ||||||||||
|---|---|---|---|---|---|---|---|---|---|---|
| 2014 | 2015 | 2016 | 2017 | 2018 | ||||||
| No. | Ratea | No. | Ratea | No. | Ratea | No. | Ratea | No. | Ratea | |
| Male adult | ||||||||||
| Race/Ethnicity | ||||||||||
| American Indian/Alaska Native | 9 | – | 12 | – | 7 | – | 8 | – | 4 | – |
| Asianb | 4 | – | 14 | – | 12 | – | 18 | – | 13 | – |
| Black/African American | 775 | – | 784 | – | 745 | – | 676 | – | 670 | – |
| Hispanic/Latinoc | 503 | – | 446 | – | 446 | – | 426 | – | 372 | – |
| Native Hawaiian/other Pacific Islander | 1 | – | 2 | – | 1 | – | 1 | – | 2 | – |
| White | 861 | – | 895 | – | 844 | – | 828 | – | 690 | – |
| Multiple races | 129 | – | 149 | – | 137 | – | 143 | – | 128 | – |
| Transmission Categoryd | ||||||||||
| Male-to-male sexual contact | 1,195 | – | 1,259 | – | 1,213 | – | 1,237 | – | 1,064 | – |
| Injection drug use | 488 | – | 406 | – | 394 | – | 338 | – | 287 | – |
| Male-to-male sexual contact and injection drug use | 322 | – | 337 | – | 281 | – | 259 | – | 289 | – |
| Heterosexual contacte | 264 | – | 290 | – | 296 | – | 248 | – | 226 | – |
| Otherf | 13 | – | 12 | – | 8 | – | 19 | – | 13 | – |
| Region of residenceg | ||||||||||
| Northeast | 471 | 23.0 | 415 | 20.5 | 403 | 20.4 | 403 | 20.9 | 339 | 18.1 |
| Midwest | 281 | 11.6 | 272 | 11.5 | 289 | 12.6 | 250 | 11.3 | 262 | 12.2 |
| South | 1,051 | 25.8 | 1,106 | 27.2 | 1,028 | 25.6 | 985 | 25.0 | 853 | 22.0 |
| West | 418 | 16.7 | 438 | 17.6 | 417 | 17.1 | 406 | 16.9 | 389 | 16.4 |
| U.S. dependent areas | 61 | 49.9 | 72 | 59.4 | 55 | 45.8 | 56 | 47.4 | 36 | 31.5 |
| Subtotal, male adulth | 2,282 | 20.4 | 2,303 | 20.8 | 2,192 | 20.2 | 2,100 | 19.8 | 1,879 | 18.1 |
| Female adult | ||||||||||
| Race/Ethnicity | ||||||||||
| American Indian/Alaska Native | 4 | – | 1 | – | 1 | – | 2 | – | 6 | – |
| Asianb | 1 | – | 2 | – | 3 | – | 2 | – | 1 | – |
| Black/African American | 431 | – | 414 | – | 387 | – | 392 | – | 359 | – |
| Hispanic/Latinoc | 140 | – | 125 | – | 136 | – | 109 | – | 101 | – |
| Native Hawaiian/other Pacific Islander | 1 | – | 0 | – | 0 | – | 1 | – | 0 | – |
| White | 142 | – | 149 | – | 137 | – | 155 | – | 132 | – |
| Multiple races | 54 | – | 46 | – | 62 | – | 46 | – | 53 | – |
| Transmission Categoryd | ||||||||||
| Injection drug use | 320 | – | 301 | – | 284 | – | 274 | – | 240 | – |
| Heterosexual contacte | 450 | – | 433 | – | 440 | – | 432 | – | 409 | – |
| Otherf | 4 | – | 3 | – | 2 | – | 2 | – | 3 | – |
| Region of residenceg | ||||||||||
| Northeast | 215 | 10.0 | 225 | 10.6 | 207 | 9.9 | 196 | 9.6 | 187 | 9.5 |
| Midwest | 54 | 2.2 | 56 | 2.3 | 73 | 3.1 | 65 | 2.9 | 64 | 2.9 |
| South | 407 | 9.5 | 376 | 8.8 | 375 | 8.9 | 372 | 9.0 | 326 | 8.0 |
| West | 62 | 2.4 | 57 | 2.3 | 55 | 2.2 | 57 | 2.3 | 62 | 2.6 |
| U.S. dependent areas | 36 | 25.7 | 23 | 16.6 | 16 | 11.7 | 18 | 13.4 | 13 | 10.1 |
| Subtotal, female adulth | 774 | 6.7 | 737 | 6.4 | 726 | 6.5 | 708 | 6.4 | 652 | 6.1 |
| Both sexes | ||||||||||
| Race/Ethnicity | ||||||||||
| American Indian/Alaska Native | 13 | – | 13 | – | 8 | – | 10 | – | 10 | – |
| Asianb | 5 | – | 16 | – | 15 | – | 20 | – | 14 | – |
| Black/African American | 1,206 | – | 1,198 | – | 1,132 | – | 1,068 | – | 1,029 | – |
| Hispanic/Latinoc | 643 | – | 571 | – | 582 | – | 535 | – | 473 | – |
| Native Hawaiian/other Pacific Islander | 2 | – | 2 | – | 1 | – | 2 | – | 2 | – |
| White | 1,003 | – | 1,044 | – | 981 | – | 983 | – | 822 | – |
| Multiple races | 183 | – | 195 | – | 199 | – | 189 | – | 181 | – |
| Region of residenceg | ||||||||||
| Northeast | 686 | 16.3 | 640 | 15.4 | 610 | 15.0 | 599 | 15.1 | 526 | 13.7 |
| Midwest | 335 | 6.8 | 328 | 6.9 | 362 | 7.8 | 315 | 7.0 | 326 | 7.5 |
| South | 1,458 | 17.4 | 1,482 | 17.8 | 1,403 | 17.1 | 1,357 | 16.8 | 1,179 | 14.9 |
| West | 480 | 9.5 | 495 | 9.9 | 472 | 9.6 | 463 | 9.6 | 451 | 9.5 |
| U.S. dependent areas | 97 | 37.0 | 95 | 36.5 | 71 | 27.6 | 74 | 29.3 | 49 | 20.1 |
| Totalh | 3,056 | 13.4 | 3,040 | 13.5 | 2,918 | 13.2 | 2,808 | 13.0 | 2,531 | 12.0 |
55–59
| Aged 55–59 Years of Age at Diagnosis | ||||||||||
|---|---|---|---|---|---|---|---|---|---|---|
| 2014 | 2015 | 2016 | 2017 | 2018 | ||||||
| No. | Ratea | No. | Ratea | No. | Ratea | No. | Ratea | No. | Ratea | |
| Male adult | ||||||||||
| Race/Ethnicity | ||||||||||
| American Indian/Alaska Native | 10 | – | 8 | – | 5 | – | 4 | – | 6 | – |
| Asianb | 6 | – | 7 | – | 8 | – | 7 | – | 9 | – |
| Black/African American | 904 | – | 871 | – | 939 | – | 886 | – | 780 | – |
| Hispanic/Latinoc | 393 | – | 354 | – | 446 | – | 412 | – | 417 | – |
| Native Hawaiian/other Pacific Islander | 4 | – | 2 | – | 3 | – | 0 | – | 1 | – |
| White | 808 | – | 839 | – | 852 | – | 843 | – | 834 | – |
| Multiple races | 135 | – | 147 | – | 141 | – | 153 | – | 152 | – |
| Transmission Categoryd | ||||||||||
| Male-to-male sexual contact | 1,041 | – | 1,100 | – | 1,207 | – | 1,171 | – | 1,149 | – |
| Injection drug use | 654 | – | 564 | – | 554 | – | 517 | – | 475 | – |
| Male-to-male sexual contact and injection drug use | 290 | – | 276 | – | 319 | – | 297 | – | 296 | – |
| Heterosexual contacte | 268 | – | 279 | – | 309 | – | 314 | – | 266 | – |
| Otherf | 9 | – | 11 | – | 7 | – | 7 | – | 13 | – |
| Region of residenceg | ||||||||||
| Northeast | 544 | 27.9 | 509 | 25.9 | 542 | 27.4 | 481 | 24.5 | 480 | 24.6 |
| Midwest | 258 | 11.0 | 254 | 10.8 | 270 | 11.4 | 272 | 11.6 | 283 | 12.2 |
| South | 993 | 26.3 | 1,035 | 26.9 | 1,092 | 27.9 | 1,068 | 27.1 | 962 | 24.3 |
| West | 396 | 16.9 | 385 | 16.1 | 434 | 18.0 | 428 | 17.7 | 422 | 17.4 |
| U.S. dependent areas | 70 | 61.0 | 46 | 40.0 | 57 | 49.8 | 57 | 50.1 | 52 | 46.1 |
| Subtotal, male adulth | 2,261 | 21.5 | 2,229 | 20.9 | 2,395 | 22.2 | 2,306 | 21.4 | 2,199 | 20.4 |
| Female adult | ||||||||||
| Race/Ethnicity | ||||||||||
| American Indian/Alaska Native | 6 | – | 3 | – | 1 | – | 3 | – | 2 | – |
| Asianb | 3 | – | 1 | – | 2 | – | 1 | – | 2 | – |
| Black/African American | 450 | – | 398 | – | 373 | – | 415 | – | 345 | – |
| Hispanic/Latinoc | 106 | – | 92 | – | 117 | – | 134 | – | 122 | – |
| Native Hawaiian/other Pacific Islander | 0 | – | 0 | – | 1 | – | 0 | – | 0 | – |
| White | 123 | – | 135 | – | 140 | – | 144 | – | 140 | – |
| Multiple races | 43 | – | 48 | – | 45 | – | 48 | – | 32 | – |
| Transmission Categoryd | ||||||||||
| Injection drug use | 331 | – | 298 | – | 281 | – | 313 | – | 252 | – |
| Heterosexual contacte | 398 | – | 376 | – | 393 | – | 428 | – | 386 | – |
| Otherf | 2 | – | 3 | – | 6 | – | 4 | – | 5 | – |
| Region of residenceg | ||||||||||
| Northeast | 228 | 11.0 | 205 | 9.8 | 201 | 9.6 | 215 | 10.3 | 198 | 9.5 |
| Midwest | 62 | 2.5 | 75 | 3.1 | 56 | 2.3 | 73 | 3.0 | 66 | 2.7 |
| South | 368 | 9.0 | 314 | 7.6 | 353 | 8.4 | 367 | 8.7 | 304 | 7.1 |
| West | 56 | 2.3 | 64 | 2.6 | 51 | 2.0 | 66 | 2.6 | 62 | 2.5 |
| U.S. dependent areas | 17 | 12.8 | 19 | 14.2 | 18 | 13.6 | 24 | 18.3 | 13 | 10.0 |
| Subtotal, female adulth | 731 | 6.5 | 677 | 6.0 | 679 | 5.9 | 745 | 6.5 | 643 | 5.6 |
| Both sexes | ||||||||||
| Race/Ethnicity | ||||||||||
| American Indian/Alaska Native | 16 | – | 11 | – | 6 | – | 7 | – | 8 | – |
| Asianb | 9 | – | 8 | – | 10 | – | 8 | – | 11 | – |
| Black/African American | 1,354 | – | 1,269 | – | 1,312 | – | 1,301 | – | 1,125 | – |
| Hispanic/Latinoc | 499 | – | 446 | – | 563 | – | 546 | – | 539 | – |
| Native Hawaiian/other Pacific Islander | 4 | – | 2 | – | 4 | – | 0 | – | 1 | – |
| White | 931 | – | 974 | – | 992 | – | 987 | – | 974 | – |
| Multiple races | 178 | – | 195 | – | 186 | – | 201 | – | 184 | – |
| Region of residenceg | ||||||||||
| Northeast | 772 | 19.2 | 714 | 17.6 | 743 | 18.2 | 696 | 17.1 | 678 | 16.8 |
| Midwest | 320 | 6.7 | 329 | 6.8 | 326 | 6.7 | 345 | 7.2 | 349 | 7.4 |
| South | 1,361 | 17.3 | 1,349 | 16.9 | 1,445 | 17.8 | 1,435 | 17.6 | 1,266 | 15.4 |
| West | 452 | 9.4 | 449 | 9.2 | 485 | 9.8 | 494 | 10.0 | 484 | 9.8 |
| U.S. dependent areas | 87 | 35.1 | 65 | 26.2 | 75 | 30.4 | 81 | 33.1 | 65 | 26.7 |
| Totalh | 2,992 | 13.8 | 2,906 | 13.2 | 3,074 | 13.8 | 3,051 | 13.7 | 2,842 | 12.8 |
60–64
| Aged 60–64 Years of Age at Diagnosis | ||||||||||
|---|---|---|---|---|---|---|---|---|---|---|
| 2014 | 2015 | 2016 | 2017 | 2018 | ||||||
| No. | Ratea | No. | Ratea | No. | Ratea | No. | Ratea | No. | Ratea | |
| Male adult | ||||||||||
| Race/Ethnicity | ||||||||||
| American Indian/Alaska Native | 1 | – | 2 | – | 6 | – | 4 | – | 3 | – |
| Asianb | 5 | – | 4 | – | 4 | – | 7 | – | 7 | – |
| Black/African American | 755 | – | 733 | – | 784 | – | 851 | – | 745 | – |
| Hispanic/Latinoc | 281 | – | 284 | – | 281 | – | 299 | – | 339 | – |
| Native Hawaiian/other Pacific Islander | 0 | – | 0 | – | 1 | – | 1 | – | 2 | – |
| White | 616 | – | 568 | – | 711 | – | 688 | – | 650 | – |
| Multiple races | 101 | – | 119 | – | 107 | – | 116 | – | 119 | – |
| Transmission Categoryd | ||||||||||
| Male-to-male sexual contact | 799 | – | 757 | – | 882 | – | 922 | – | 868 | – |
| Injection drug use | 526 | – | 512 | – | 539 | – | 536 | – | 499 | – |
| Male-to-male sexual contact and injection drug use | 177 | – | 201 | – | 213 | – | 234 | – | 231 | – |
| Heterosexual contacte | 253 | – | 230 | – | 253 | – | 268 | – | 263 | – |
| Otherf | 4 | – | 11 | – | 7 | – | 6 | – | 4 | – |
| Region of residenceg | ||||||||||
| Northeast | 425 | 26.1 | 441 | 26.4 | 495 | 29.0 | 468 | 26.8 | 441 | 24.8 |
| Midwest | 206 | 10.3 | 193 | 9.5 | 204 | 9.8 | 229 | 10.8 | 249 | 11.5 |
| South | 778 | 24.1 | 737 | 22.3 | 806 | 23.7 | 885 | 25.3 | 785 | 21.9 |
| West | 302 | 15.0 | 301 | 14.5 | 346 | 16.3 | 355 | 16.3 | 351 | 15.9 |
| U.S. dependent areas | 48 | 46.2 | 38 | 36.6 | 44 | 42.1 | 29 | 27.5 | 39 | 37.0 |
| Subtotal, male adulth | 1,759 | 19.6 | 1,710 | 18.6 | 1,895 | 20.1 | 1,966 | 20.4 | 1,865 | 19.0 |
| Female adult | ||||||||||
| Race/Ethnicity | ||||||||||
| American Indian/Alaska Native | 1 | – | 2 | – | 1 | – | 0 | – | 0 | – |
| Asianb | 1 | – | 1 | – | 0 | – | 4 | – | 1 | – |
| Black/African American | 292 | – | 299 | – | 359 | – | 327 | – | 360 | – |
| Hispanic/Latinoc | 72 | – | 63 | – | 90 | – | 100 | – | 86 | – |
| Native Hawaiian/other Pacific Islander | 0 | – | 0 | – | 2 | – | 0 | – | 0 | – |
| White | 99 | – | 91 | – | 93 | – | 101 | – | 116 | – |
| Multiple races | 38 | – | 37 | – | 31 | – | 37 | – | 40 | – |
| Transmission Categoryd | ||||||||||
| Injection drug use | 209 | – | 204 | – | 249 | – | 224 | – | 251 | – |
| Heterosexual contacte | 291 | – | 286 | – | 324 | – | 343 | – | 349 | – |
| Otherf | 3 | – | 3 | – | 3 | – | 2 | – | 3 | – |
| Region of residenceg | ||||||||||
| Northeast | 149 | 8.4 | 134 | 7.4 | 181 | 9.8 | 176 | 9.3 | 163 | 8.4 |
| Midwest | 51 | 2.4 | 60 | 2.8 | 54 | 2.4 | 45 | 2.0 | 59 | 2.6 |
| South | 241 | 6.7 | 251 | 6.8 | 275 | 7.2 | 287 | 7.3 | 306 | 7.7 |
| West | 50 | 2.3 | 39 | 1.7 | 57 | 2.5 | 48 | 2.0 | 68 | 2.9 |
| U.S. dependent areas | 12 | 9.7 | 9 | 7.3 | 9 | 7.3 | 13 | 10.5 | 7 | 5.7 |
| Subtotal, female adulth | 503 | 5.1 | 493 | 4.9 | 576 | 5.6 | 569 | 5.4 | 603 | 5.6 |
| Both sexes | ||||||||||
| Race/Ethnicity | ||||||||||
| American Indian/Alaska Native | 2 | – | 4 | – | 7 | – | 4 | – | 3 | – |
| Asianb | 6 | – | 5 | – | 4 | – | 11 | – | 8 | – |
| Black/African American | 1,047 | – | 1,032 | – | 1,143 | – | 1,178 | – | 1,105 | – |
| Hispanic/Latinoc | 353 | – | 347 | – | 371 | – | 399 | – | 425 | – |
| Native Hawaiian/other Pacific Islander | 0 | – | 0 | – | 3 | – | 1 | – | 2 | – |
| White | 715 | – | 659 | – | 804 | – | 789 | – | 766 | – |
| Multiple races | 139 | – | 156 | – | 138 | – | 153 | – | 159 | – |
| Region of residenceg | ||||||||||
| Northeast | 574 | 16.9 | 575 | 16.5 | 676 | 19.0 | 644 | 17.7 | 604 | 16.3 |
| Midwest | 257 | 6.3 | 253 | 6.0 | 258 | 6.0 | 274 | 6.3 | 308 | 6.9 |
| South | 1,019 | 14.9 | 988 | 14.1 | 1,081 | 15.0 | 1,172 | 15.8 | 1,091 | 14.4 |
| West | 352 | 8.4 | 340 | 7.9 | 403 | 9.1 | 403 | 8.9 | 419 | 9.1 |
| U.S. dependent areas | 60 | 26.4 | 47 | 20.7 | 53 | 23.2 | 42 | 18.3 | 46 | 20.1 |
| Totalh | 2,262 | 12.1 | 2,203 | 11.4 | 2,471 | 12.6 | 2,535 | 12.6 | 2,468 | 12.0 |
65–69
| Aged 65–69 Years of Age at Diagnosis | ||||||||||
|---|---|---|---|---|---|---|---|---|---|---|
| 2014 | 2015 | 2016 | 2017 | 2018 | ||||||
| No. | Ratea | No. | Ratea | No. | Ratea | No. | Ratea | No. | Ratea | |
| Male adult | ||||||||||
| Race/Ethnicity | ||||||||||
| American Indian/Alaska Native | 3 | – | 2 | – | 1 | – | 2 | – | 0 | – |
| Asianb | 2 | – | 6 | – | 10 | – | 4 | – | 6 | – |
| Black/African American | 387 | – | 422 | – | 530 | – | 557 | – | 566 | – |
| Hispanic/Latinoc | 149 | – | 161 | – | 173 | – | 219 | – | 234 | – |
| Native Hawaiian/other Pacific Islander | 0 | – | 0 | – | 0 | – | 1 | – | 0 | – |
| White | 390 | – | 430 | – | 486 | – | 494 | – | 460 | – |
| Multiple races | 64 | – | 57 | – | 84 | – | 75 | – | 98 | – |
| Transmission Categoryd | ||||||||||
| Male-to-male sexual contact | 506 | – | 525 | – | 611 | – | 634 | – | 670 | – |
| Injection drug use | 244 | – | 289 | – | 345 | – | 346 | – | 364 | – |
| Male-to-male sexual contact and injection drug use | 72 | – | 99 | – | 111 | – | 131 | – | 122 | – |
| Heterosexual contacte | 169 | – | 161 | – | 211 | – | 235 | – | 204 | – |
| Otherf | 4 | – | 4 | – | 8 | – | 7 | – | 4 | – |
| Region of residenceg | ||||||||||
| Northeast | 256 | 19.7 | 315 | 23.2 | 312 | 22.0 | 349 | 24.8 | 347 | 24.3 |
| Midwest | 105 | 6.8 | 133 | 8.1 | 140 | 8.1 | 131 | 7.6 | 149 | 8.4 |
| South | 420 | 15.3 | 410 | 14.3 | 575 | 19.3 | 611 | 20.6 | 585 | 19.5 |
| West | 180 | 11.0 | 200 | 11.6 | 232 | 12.8 | 228 | 12.6 | 259 | 14.0 |
| U.S. dependent areas | 34 | 34.9 | 20 | 20.4 | 26 | 26.8 | 33 | 34.7 | 24 | 25.8 |
| Subtotal, male adulth | 995 | 13.6 | 1,078 | 14.0 | 1,285 | 16.0 | 1,352 | 16.9 | 1,364 | 16.8 |
| Female adult | ||||||||||
| Race/Ethnicity | ||||||||||
| American Indian/Alaska Native | 2 | – | 1 | – | 0 | – | 2 | – | 1 | – |
| Asianb | 1 | – | 0 | – | 2 | – | 0 | – | 1 | – |
| Black/African American | 159 | – | 161 | – | 195 | – | 209 | – | 195 | – |
| Hispanic/Latinoc | 44 | – | 41 | – | 53 | – | 67 | – | 55 | – |
| Native Hawaiian/other Pacific Islander | 0 | – | 0 | – | 0 | – | 0 | – | 0 | – |
| White | 42 | – | 54 | – | 57 | – | 65 | – | 57 | – |
| Multiple races | 24 | – | 12 | – | 15 | – | 18 | – | 38 | – |
| Transmission Categoryd | ||||||||||
| Injection drug use | 94 | – | 82 | – | 114 | – | 121 | – | 110 | – |
| Heterosexual contacte | 173 | – | 183 | – | 202 | – | 236 | – | 234 | – |
| Otherf | 5 | – | 4 | – | 6 | – | 4 | – | 3 | – |
| Region of residenceg | ||||||||||
| Northeast | 77 | 5.2 | 70 | 4.5 | 96 | 6.0 | 111 | 7.0 | 115 | 7.1 |
| Midwest | 20 | 1.2 | 24 | 1.3 | 31 | 1.6 | 28 | 1.5 | 29 | 1.5 |
| South | 142 | 4.6 | 143 | 4.4 | 151 | 4.4 | 178 | 5.2 | 161 | 4.7 |
| West | 25 | 1.4 | 24 | 1.3 | 33 | 1.7 | 34 | 1.7 | 37 | 1.8 |
| U.S. dependent areas | 8 | 6.9 | 8 | 6.8 | 11 | 9.4 | 10 | 8.7 | 5 | 4.5 |
| Subtotal, female adulth | 272 | 3.3 | 269 | 3.1 | 322 | 3.6 | 361 | 4.0 | 347 | 3.8 |
| Both sexes | ||||||||||
| Race/Ethnicity | ||||||||||
| American Indian/Alaska Native | 5 | – | 3 | – | 1 | – | 4 | – | 1 | – |
| Asianb | 3 | – | 6 | – | 12 | – | 4 | – | 7 | – |
| Black/African American | 546 | – | 583 | – | 725 | – | 766 | – | 761 | – |
| Hispanic/Latinoc | 193 | – | 202 | – | 226 | – | 286 | – | 289 | – |
| Native Hawaiian/other Pacific Islander | 0 | – | 0 | – | 0 | – | 1 | – | 0 | – |
| White | 432 | – | 484 | – | 543 | – | 559 | – | 517 | – |
| Multiple races | 88 | – | 69 | – | 99 | – | 93 | – | 136 | – |
| Region of residenceg | ||||||||||
| Northeast | 333 | 12.0 | 385 | 13.3 | 408 | 13.5 | 460 | 15.3 | 462 | 15.2 |
| Midwest | 125 | 3.8 | 157 | 4.6 | 171 | 4.7 | 159 | 4.4 | 178 | 4.8 |
| South | 562 | 9.6 | 553 | 9.1 | 726 | 11.4 | 789 | 12.4 | 746 | 11.6 |
| West | 205 | 6.0 | 224 | 6.2 | 265 | 7.0 | 262 | 6.9 | 296 | 7.6 |
| U.S. dependent areas | 42 | 19.7 | 28 | 13.0 | 37 | 17.3 | 43 | 20.5 | 29 | 14.2 |
| Totalh | 1,267 | 8.2 | 1,347 | 8.3 | 1,607 | 9.4 | 1,713 | 10.1 | 1,711 | 9.9 |
70–74
| Aged 70–74 Years of Age at Diagnosis | ||||||||||
|---|---|---|---|---|---|---|---|---|---|---|
| 2014 | 2015 | 2016 | 2017 | 2018 | ||||||
| No. | Ratea | No. | Ratea | No. | Ratea | No. | Ratea | No. | Ratea | |
| Male adult | ||||||||||
| Race/Ethnicity | ||||||||||
| American Indian/Alaska Native | 0 | – | 2 | – | 1 | – | 1 | – | 0 | – |
| Asianb | 1 | – | 1 | – | 6 | – | 2 | – | 6 | – |
| Black/African American | 202 | – | 230 | – | 238 | – | 267 | – | 264 | – |
| Hispanic/Latinoc | 82 | – | 74 | – | 106 | – | 105 | – | 140 | – |
| Native Hawaiian/other Pacific Islander | 0 | – | 0 | – | 0 | – | 1 | – | 0 | – |
| White | 224 | – | 262 | – | 294 | – | 311 | – | 316 | – |
| Multiple races | 27 | – | 31 | – | 25 | – | 39 | – | 42 | – |
| Transmission Categoryd | ||||||||||
| Male-to-male sexual contact | 291 | – | 324 | – | 360 | – | 407 | – | 427 | – |
| Injection drug use | 101 | – | 112 | – | 119 | – | 129 | – | 154 | – |
| Male-to-male sexual contact and injection drug use | 20 | – | 42 | – | 41 | – | 45 | – | 49 | – |
| Heterosexual contacte | 122 | – | 119 | – | 146 | – | 141 | – | 133 | – |
| Otherf | 3 | – | 3 | – | 5 | – | 4 | – | 4 | – |
| Region of residenceg | ||||||||||
| Northeast | 134 | 14.8 | 142 | 15.2 | 156 | 16.2 | 185 | 17.7 | 182 | 16.8 |
| Midwest | 60 | 5.5 | 69 | 6.2 | 65 | 5.7 | 69 | 5.6 | 88 | 6.8 |
| South | 228 | 11.6 | 263 | 12.9 | 306 | 14.5 | 301 | 13.1 | 306 | 12.7 |
| West | 104 | 9.2 | 118 | 9.9 | 122 | 9.9 | 160 | 11.8 | 172 | 12.1 |
| U.S. dependent areas | 10 | 13.6 | 8 | 10.6 | 21 | 26.6 | 11 | 13.5 | 20 | 24.0 |
| Subtotal, male adulth | 536 | 10.4 | 600 | 11.2 | 670 | 12.1 | 726 | 12.1 | 768 | 12.2 |
| Female adult | ||||||||||
| Race/Ethnicity | ||||||||||
| American Indian/Alaska Native | 0 | – | 0 | – | 0 | – | 0 | – | 0 | – |
| Asianb | 0 | – | 1 | – | 0 | – | 0 | – | 2 | – |
| Black/African American | 73 | – | 99 | – | 97 | – | 76 | – | 103 | – |
| Hispanic/Latinoc | 34 | – | 27 | – | 31 | – | 31 | – | 33 | – |
| Native Hawaiian/other Pacific Islander | 0 | – | 0 | – | 0 | – | 0 | – | 0 | – |
| White | 22 | – | 33 | – | 32 | – | 34 | – | 29 | – |
| Multiple races | 8 | – | 6 | – | 3 | – | 11 | – | 7 | – |
| Transmission Categoryd | ||||||||||
| Injection drug use | 32 | – | 49 | – | 46 | – | 34 | – | 54 | – |
| Heterosexual contacte | 104 | – | 117 | – | 115 | – | 113 | – | 119 | – |
| Otherf | 2 | – | 1 | – | 2 | – | 5 | – | 2 | – |
| Region of residenceg | ||||||||||
| Northeast | 41 | 3.7 | 52 | 4.6 | 48 | 4.2 | 58 | 4.7 | 66 | 5.1 |
| Midwest | 9 | 0.7 | 13 | 1.0 | 9 | 0.7 | 10 | 0.7 | 12 | 0.8 |
| South | 69 | 3.0 | 76 | 3.2 | 81 | 3.3 | 73 | 2.7 | 82 | 2.9 |
| West | 13 | 1.0 | 23 | 1.7 | 21 | 1.5 | 7 | 0.5 | 11 | 0.7 |
| U.S. dependent areas | 6 | 6.7 | 3 | 3.3 | 4 | 4.2 | 4 | 4.0 | 3 | 3.0 |
| Subtotal, female adulth | 138 | 2.3 | 167 | 2.7 | 163 | 2.5 | 152 | 2.2 | 174 | 2.4 |
| Both sexes | ||||||||||
| Race/Ethnicity | ||||||||||
| American Indian/Alaska Native | 0 | – | 2 | – | 1 | – | 1 | – | 0 | – |
| Asianb | 1 | – | 2 | – | 6 | – | 2 | – | 8 | – |
| Black/African American | 275 | – | 329 | – | 335 | – | 343 | – | 367 | – |
| Hispanic/Latinoc | 116 | – | 101 | – | 137 | – | 136 | – | 173 | – |
| Native Hawaiian/other Pacific Islander | 0 | – | 0 | – | 0 | – | 1 | – | 0 | – |
| White | 246 | – | 295 | – | 326 | – | 345 | – | 345 | – |
| Multiple races | 35 | – | 37 | – | 28 | – | 50 | – | 49 | – |
| Region of residenceg | ||||||||||
| Northeast | 175 | 8.7 | 194 | 9.4 | 204 | 9.6 | 243 | 10.6 | 248 | 10.4 |
| Midwest | 69 | 2.9 | 82 | 3.4 | 74 | 3.0 | 79 | 3.0 | 100 | 3.6 |
| South | 297 | 7.0 | 339 | 7.6 | 387 | 8.5 | 374 | 7.5 | 388 | 7.4 |
| West | 117 | 4.8 | 141 | 5.5 | 143 | 5.4 | 167 | 5.8 | 183 | 6.0 |
| U.S. dependent areas | 16 | 9.8 | 11 | 6.6 | 25 | 14.3 | 15 | 8.3 | 23 | 12.4 |
| Totalh | 674 | 6.0 | 767 | 6.6 | 833 | 7.0 | 878 | 6.7 | 942 | 6.9 |
75–79
| Aged 75–79 Years of Age at Diagnosis | ||||||||||
|---|---|---|---|---|---|---|---|---|---|---|
| 2014 | 2015 | 2016 | 2017 | 2018 | ||||||
| No. | Ratea | No. | Ratea | No. | Ratea | No. | Ratea | No. | Ratea | |
| Male adult | ||||||||||
| Race/Ethnicity | ||||||||||
| American Indian/Alaska Native | 0 | – | 0 | – | 2 | – | 0 | – | 1 | – |
| Asianb | 1 | – | 1 | – | 5 | – | 3 | – | 2 | – |
| Black/African American | 107 | – | 121 | – | 101 | – | 132 | – | 136 | – |
| Hispanic/Latinoc | 50 | – | 56 | – | 53 | – | 76 | – | 86 | – |
| Native Hawaiian/other Pacific Islander | 0 | – | 0 | – | 0 | – | 0 | – | 0 | – |
| White | 91 | – | 120 | – | 132 | – | 167 | – | 203 | – |
| Multiple races | 15 | – | 23 | – | 23 | – | 24 | – | 21 | – |
| Transmission Categoryd | ||||||||||
| Male-to-male sexual contact | 132 | – | 166 | – | 172 | – | 238 | – | 257 | – |
| Injection drug use | 46 | – | 51 | – | 53 | – | 61 | – | 70 | – |
| Male-to-male sexual contact and injection drug use | 8 | – | 15 | – | 9 | – | 19 | – | 34 | – |
| Heterosexual contacte | 75 | – | 85 | – | 78 | – | 83 | – | 86 | – |
| Otherf | 2 | – | 4 | – | 5 | – | 1 | – | 2 | – |
| Region of residenceg | ||||||||||
| Northeast | 70 | 11.1 | 85 | 13.3 | 83 | 12.7 | 98 | 14.4 | 101 | 13.9 |
| Midwest | 33 | 4.3 | 25 | 3.2 | 32 | 4.0 | 37 | 4.5 | 51 | 5.8 |
| South | 110 | 8.2 | 138 | 10.0 | 128 | 8.9 | 165 | 10.9 | 179 | 11.1 |
| West | 43 | 5.5 | 61 | 7.6 | 65 | 7.8 | 93 | 10.6 | 104 | 11.1 |
| U.S. dependent areas | 8 | 15.1 | 12 | 22.0 | 8 | 14.3 | 9 | 15.7 | 14 | 23.7 |
| Subtotal, male adulth | 264 | 7.4 | 321 | 8.8 | 316 | 8.4 | 402 | 10.2 | 449 | 10.7 |
| Female adult | ||||||||||
| Race/Ethnicity | ||||||||||
| American Indian/Alaska Native | 0 | – | 0 | – | 0 | – | 0 | – | 0 | – |
| Asianb | 1 | – | 0 | – | 0 | – | 0 | – | 0 | – |
| Black/African American | 45 | – | 43 | – | 49 | – | 49 | – | 53 | – |
| Hispanic/Latinoc | 19 | – | 23 | – | 21 | – | 25 | – | 27 | – |
| Native Hawaiian/other Pacific Islander | 0 | – | 0 | – | 0 | – | 0 | – | 0 | – |
| White | 11 | – | 8 | – | 12 | – | 18 | – | 17 | – |
| Multiple races | 6 | – | 6 | – | 3 | – | 7 | – | 5 | – |
| Transmission Categoryd | ||||||||||
| Injection drug use | 11 | – | 14 | – | 16 | – | 23 | – | 16 | – |
| Heterosexual contacte | 69 | – | 64 | – | 68 | – | 73 | – | 84 | – |
| Otherf | 2 | – | 1 | – | 1 | – | 3 | – | 1 | – |
| Region of residenceg | ||||||||||
| Northeast | 29 | 3.5 | 30 | 3.6 | 26 | 3.0 | 37 | 4.2 | 25 | 2.7 |
| Midwest | 3 | 0.3 | 3 | 0.3 | 8 | 0.8 | 6 | 0.6 | 11 | 1.0 |
| South | 44 | 2.6 | 36 | 2.1 | 41 | 2.3 | 41 | 2.2 | 47 | 2.4 |
| West | 4 | 0.4 | 8 | 0.8 | 8 | 0.8 | 11 | 1.1 | 16 | 1.4 |
| U.S. dependent areas | 2 | 3.0 | 3 | 4.4 | 2 | 2.8 | 4 | 5.5 | 3 | 4.0 |
| Subtotal, female adulth | 82 | 1.8 | 80 | 1.7 | 85 | 1.8 | 99 | 2.0 | 102 | 2.0 |
| Both sexes | ||||||||||
| Race/Ethnicity | ||||||||||
| American Indian/Alaska Native | 0 | – | 0 | – | 2 | – | 0 | – | 1 | – |
| Asianb | 2 | – | 1 | – | 5 | – | 3 | – | 2 | – |
| Black/African American | 152 | – | 164 | – | 150 | – | 181 | – | 189 | – |
| Hispanic/Latinoc | 69 | – | 79 | – | 74 | – | 101 | – | 113 | – |
| Native Hawaiian/other Pacific Islander | 0 | – | 0 | – | 0 | – | 0 | – | 0 | – |
| White | 102 | – | 128 | – | 144 | – | 185 | – | 220 | – |
| Multiple races | 21 | – | 29 | – | 26 | – | 31 | – | 26 | – |
| Region of residenceg | ||||||||||
| Northeast | 99 | 6.8 | 115 | 7.8 | 109 | 7.2 | 135 | 8.6 | 126 | 7.6 |
| Midwest | 36 | 2.1 | 28 | 1.6 | 40 | 2.2 | 43 | 2.3 | 62 | 3.2 |
| South | 154 | 5.1 | 174 | 5.6 | 169 | 5.2 | 206 | 6.1 | 226 | 6.3 |
| West | 47 | 2.8 | 69 | 3.9 | 73 | 4.0 | 104 | 5.4 | 120 | 5.9 |
| U.S. dependent areas | 10 | 8.4 | 15 | 12.2 | 10 | 7.9 | 13 | 10.0 | 17 | 12.7 |
| Totalh | 346 | 4.3 | 401 | 4.9 | 401 | 4.7 | 501 | 5.7 | 551 | 5.9 |
80–84
| Aged 80–84 Years of Age at Diagnosis | ||||||||||
|---|---|---|---|---|---|---|---|---|---|---|
| 2014 | 2015 | 2016 | 2017 | 2018 | ||||||
| No. | Ratea | No. | Ratea | No. | Ratea | No. | Ratea | No. | Ratea | |
| Male adult | ||||||||||
| Race/Ethnicity | ||||||||||
| American Indian/Alaska Native | 0 | – | 0 | – | 1 | – | 0 | – | 0 | – |
| Asianb | 1 | – | 0 | – | 2 | – | 1 | – | 2 | – |
| Black/African American | 40 | – | 45 | – | 41 | – | 58 | – | 69 | – |
| Hispanic/Latinoc | 31 | – | 25 | – | 36 | – | 37 | – | 34 | – |
| Native Hawaiian/other Pacific Islander | 0 | – | 1 | – | 0 | – | 0 | – | 0 | – |
| White | 51 | – | 66 | – | 88 | – | 84 | – | 84 | – |
| Multiple races | 9 | – | 10 | – | 8 | – | 9 | – | 8 | – |
| Transmission Categoryd | ||||||||||
| Male-to-male sexual contact | 66 | – | 72 | – | 112 | – | 104 | – | 108 | – |
| Injection drug use | 17 | – | 20 | – | 20 | – | 21 | – | 30 | – |
| Male-to-male sexual contact and injection drug use | 3 | – | 6 | – | 7 | – | 9 | – | 6 | – |
| Heterosexual contacte | 46 | – | 46 | – | 34 | – | 53 | – | 53 | – |
| Otherf | 1 | – | 4 | – | 4 | – | 2 | – | 1 | – |
| Region of residenceg | ||||||||||
| Northeast | 41 | 9.1 | 46 | 10.2 | 43 | 9.5 | 50 | 10.9 | 45 | 9.7 |
| Midwest | 7 | 1.3 | 14 | 2.7 | 12 | 2.3 | 14 | 2.6 | 20 | 3.6 |
| South | 51 | 5.8 | 57 | 6.4 | 79 | 8.6 | 80 | 8.5 | 83 | 8.4 |
| West | 25 | 4.7 | 27 | 5.0 | 38 | 6.9 | 39 | 6.9 | 45 | 7.7 |
| U.S. dependent areas | 8 | 24.5 | 3 | 8.8 | 4 | 11.2 | 6 | 16.1 | 4 | 10.3 |
| Subtotal, male adulth | 132 | 5.5 | 147 | 6.0 | 176 | 7.1 | 189 | 7.4 | 197 | 7.5 |
| Female adult | ||||||||||
| Race/Ethnicity | ||||||||||
| American Indian/Alaska Native | 1 | – | 0 | – | 0 | – | 0 | – | 0 | – |
| Asianb | 0 | – | 0 | – | 0 | – | 1 | – | 0 | – |
| Black/African American | 23 | – | 18 | – | 21 | – | 26 | – | 32 | – |
| Hispanic/Latinoc | 11 | – | 8 | – | 7 | – | 9 | – | 9 | – |
| Native Hawaiian/other Pacific Islander | 0 | – | 0 | – | 0 | – | 0 | – | 0 | – |
| White | 4 | – | 10 | – | 5 | – | 9 | – | 12 | – |
| Multiple races | 1 | – | 2 | – | 3 | – | 3 | – | 3 | – |
| Transmission Categoryd | ||||||||||
| Injection drug use | 6 | – | 5 | – | 4 | – | 5 | – | 7 | – |
| Heterosexual contacte | 32 | – | 30 | – | 31 | – | 42 | – | 48 | – |
| Otherf | 1 | – | 3 | – | 1 | – | 1 | – | 1 | – |
| Region of residenceg | ||||||||||
| Northeast | 19 | 2.8 | 13 | 1.9 | 15 | 2.3 | 17 | 2.6 | 14 | 2.1 |
| Midwest | 1 | 0.1 | 1 | 0.1 | 3 | 0.4 | 3 | 0.4 | 2 | 0.3 |
| South | 15 | 1.2 | 15 | 1.2 | 16 | 1.3 | 23 | 1.8 | 32 | 2.4 |
| West | 1 | 0.1 | 8 | 1.1 | 1 | 0.1 | 3 | 0.4 | 6 | 0.8 |
| U.S. dependent areas | 4 | 8.6 | 1 | 2.1 | 1 | 2.0 | 2 | 3.9 | 2 | 3.8 |
| Subtotal, female adulth | 40 | 1.2 | 38 | 1.1 | 36 | 1.0 | 48 | 1.4 | 56 | 1.6 |
| Both sexes | ||||||||||
| Race/Ethnicity | ||||||||||
| American Indian/Alaska Native | 1 | – | 0 | – | 1 | – | 0 | – | 0 | – |
| Asianb | 1 | – | 0 | – | 2 | – | 2 | – | 2 | – |
| Black/African American | 63 | – | 63 | – | 62 | – | 84 | – | 101 | – |
| Hispanic/Latinoc | 42 | – | 33 | – | 43 | – | 46 | – | 43 | – |
| Native Hawaiian/other Pacific Islander | 0 | – | 1 | – | 0 | – | 0 | – | 0 | – |
| White | 55 | – | 76 | – | 93 | – | 93 | – | 96 | – |
| Multiple races | 10 | – | 12 | – | 11 | – | 12 | – | 11 | – |
| Region of residenceg | ||||||||||
| Northeast | 60 | 5.3 | 59 | 5.3 | 58 | 5.2 | 67 | 6.0 | 59 | 5.2 |
| Midwest | 8 | 0.6 | 15 | 1.2 | 15 | 1.2 | 17 | 1.3 | 22 | 1.7 |
| South | 66 | 3.1 | 72 | 3.3 | 95 | 4.3 | 103 | 4.6 | 115 | 5.0 |
| West | 26 | 2.1 | 35 | 2.8 | 39 | 3.1 | 42 | 3.3 | 51 | 3.8 |
| U.S. dependent areas | 12 | 15.2 | 4 | 4.8 | 5 | 5.8 | 8 | 9.0 | 6 | 6.6 |
| Totalh | 172 | 3.0 | 185 | 3.2 | 212 | 3.6 | 237 | 3.9 | 253 | 4.1 |
85+
| Aged 85+ Years of Age at Diagnosis | ||||||||||
|---|---|---|---|---|---|---|---|---|---|---|
| 2014 | 2015 | 2016 | 2017 | 2018 | ||||||
| No. | Ratea | No. | Ratea | No. | Ratea | No. | Ratea | No. | Ratea | |
| Male adult | ||||||||||
| Race/Ethnicity | ||||||||||
| American Indian/Alaska Native | 0 | – | 1 | – | 0 | – | 0 | – | 0 | – |
| Asianb | 0 | – | 0 | – | 1 | – | 1 | – | 0 | – |
| Black/African American | 20 | – | 23 | – | 24 | – | 31 | – | 20 | – |
| Hispanic/Latinoc | 13 | – | 12 | – | 18 | – | 21 | – | 22 | – |
| Native Hawaiian/other Pacific Islander | 0 | – | 0 | – | 0 | – | 0 | – | 1 | – |
| White | 16 | – | 25 | – | 41 | – | 47 | – | 43 | – |
| Multiple races | 4 | – | 3 | – | 4 | – | 4 | – | 8 | – |
| Transmission Categoryd | ||||||||||
| Male-to-male sexual contact | 25 | – | 27 | – | 54 | – | 59 | – | 58 | – |
| Injection drug use | 11 | – | 14 | – | 9 | – | 15 | – | 10 | – |
| Male-to-male sexual contact and injection drug use | 1 | – | 1 | – | 2 | – | 2 | – | 1 | – |
| Heterosexual contacte | 16 | – | 20 | – | 20 | – | 27 | – | 22 | – |
| Otherf | 1 | – | 2 | – | 4 | – | 1 | – | 3 | – |
| Region of residenceg | ||||||||||
| Northeast | 21 | 4.9 | 18 | 4.1 | 25 | 5.6 | 25 | 5.5 | 24 | 5.3 |
| Midwest | 4 | 0.8 | 7 | 1.4 | 6 | 1.2 | 10 | 2.0 | 9 | 1.8 |
| South | 21 | 2.9 | 24 | 3.2 | 34 | 4.4 | 44 | 5.5 | 31 | 3.8 |
| West | 7 | 1.5 | 14 | 2.8 | 20 | 3.9 | 23 | 4.4 | 26 | 4.8 |
| U.S. dependent areas | 1 | 3.6 | 1 | 3.4 | 3 | 9.9 | 2 | 6.3 | 4 | 12.2 |
| Subtotal, male adulth | 54 | 2.5 | 64 | 2.9 | 88 | 3.9 | 104 | 4.5 | 94 | 4.0 |
| Female adult | ||||||||||
| Race/Ethnicity | ||||||||||
| American Indian/Alaska Native | 0 | – | 1 | – | 0 | – | 0 | – | 1 | – |
| Asianb | 0 | – | 0 | – | 0 | – | 1 | – | 0 | – |
| Black/African American | 8 | – | 8 | – | 13 | – | 15 | – | 15 | – |
| Hispanic/Latinoc | 10 | – | 3 | – | 5 | – | 7 | – | 7 | – |
| Native Hawaiian/other Pacific Islander | 0 | – | 0 | – | 0 | – | 0 | – | 0 | – |
| White | 4 | – | 6 | – | 8 | – | 13 | – | 8 | – |
| Multiple races | 1 | – | 0 | – | 0 | – | 3 | – | 2 | – |
| Transmission Categoryd | ||||||||||
| Injection drug use | 4 | – | 2 | – | 4 | – | 1 | – | 7 | – |
| Heterosexual contacte | 17 | – | 15 | – | 18 | – | 37 | – | 24 | – |
| Otherf | 2 | – | 2 | – | 4 | – | 1 | – | 2 | – |
| Region of residenceg | ||||||||||
| Northeast | 7 | 0.8 | 8 | 0.9 | 10 | 1.1 | 14 | 1.6 | 13 | 1.5 |
| Midwest | 2 | 0.2 | 1 | 0.1 | 2 | 0.2 | 4 | 0.4 | 3 | 0.3 |
| South | 11 | 0.8 | 7 | 0.5 | 11 | 0.8 | 14 | 1.0 | 15 | 1.0 |
| West | 2 | 0.2 | 2 | 0.2 | 1 | 0.1 | 4 | 0.5 | 2 | 0.2 |
| U.S. dependent areas | 1 | 2.1 | 0 | 0.0 | 2 | 3.9 | 3 | 5.6 | 0 | 0.0 |
| Subtotal, female adulth | 23 | 0.6 | 18 | 0.4 | 26 | 0.6 | 39 | 0.9 | 33 | 0.8 |
| Both sexes | ||||||||||
| Race/Ethnicity | ||||||||||
| American Indian/Alaska Native | 0 | – | 2 | – | 0 | – | 0 | – | 1 | – |
| Asianb | 0 | – | 0 | – | 1 | – | 2 | – | 0 | – |
| Black/African American | 28 | – | 31 | – | 37 | – | 46 | – | 35 | – |
| Hispanic/Latinoc | 23 | – | 15 | – | 23 | – | 28 | – | 29 | – |
| Native Hawaiian/other Pacific Islander | 0 | – | 0 | – | 0 | – | 0 | – | 1 | – |
| White | 20 | – | 31 | – | 49 | – | 60 | – | 51 | – |
| Multiple races | 5 | – | 3 | – | 4 | – | 7 | – | 10 | – |
| Region of residenceg | ||||||||||
| Northeast | 28 | 2.1 | 26 | 2.0 | 35 | 2.6 | 39 | 2.9 | 37 | 2.7 |
| Midwest | 6 | 0.4 | 8 | 0.6 | 8 | 0.5 | 14 | 1.0 | 12 | 0.8 |
| South | 32 | 1.5 | 31 | 1.4 | 45 | 2.0 | 58 | 2.6 | 46 | 2.0 |
| West | 9 | 0.7 | 16 | 1.2 | 21 | 1.5 | 27 | 1.9 | 28 | 2.0 |
| U.S. dependent areas | 2 | 2.6 | 1 | 1.3 | 5 | 6.1 | 5 | 5.8 | 4 | 4.5 |
| Totalh | 77 | 1.2 | 82 | 1.3 | 114 | 1.8 | 143 | 2.2 | 127 | 1.9 |
Note. Deaths of persons with a diagnosis of HIV infection may be due to any cause. Data for the year 2018 are considered preliminary and are based on death data reported to the Centers for Disease Control and Prevention through December 2019. Numbers less than 12, and rates and trends based on these numbers, should be interpreted with caution.
aRates are per 100,000 population. Rates by race/ethnicity are not provided because U.S. census information for U.S. dependent areas is limited. Rates are not calculated by transmission category because of the lack of denominator data.
bIncludes Asian/Pacific Islander legacy cases.
cHispanics/Latinos can be of any race.
dData have been statistically adjusted to account for missing transmission category; therefore, values may not sum to the column subtotals and total.
eHeterosexual contact with a person known to have, or to be at high risk for, HIV infection.
fIncludes hemophilia, blood transfusion, and risk factor not reported or not identified.
gData are based on residence at death. When information on residence at death was not available, state at death (where a person’s death occurred) was used.
hIncludes persons of unknown race/ethnicity.
| 2014 | 2015 | 2016 | 2017 | 2018 | |||||||||||
|---|---|---|---|---|---|---|---|---|---|---|---|---|---|---|---|
| Stage 3 (AIDS) at diagnosisa | Stage 3 (AIDS) at diagnosisa | Stage 3 (AIDS) at diagnosisa | Stage 3 (AIDS) at diagnosisa | Stage 3 (AIDS) at diagnosisa | |||||||||||
| Total No. | No. | % | Total No. | No. | % | Total No. | No. | % | Total No. | No. | % | Total No. | No. | % | |
| Gender | |||||||||||||||
| Male | 4,843 | 1,876 | 38.7 | 4,899 | 1,835 | 37.5 | 4,806 | 1,815 | 37.8 | 4,633 | 1,699 | 36.7 | 4,444 | 1,621 | 36.5 |
| Female | 1,749 | 599 | 34.2 | 1,805 | 598 | 33.1 | 1,877 | 571 | 30.4 | 1,831 | 578 | 31.6 | 1,784 | 573 | 32.1 |
| Transgender male-to-femaleb | 15 | 5 | 33.3 | 25 | 6 | 24.0 | 20 | 8 | 40.0 | 18 | 3 | 16.7 | 13 | 3 | 23.1 |
| Transgender female-to-maleb | 1 | 1 | 100 | 1 | 0 | 0.0 | 0 | 0 | – | 1 | 0 | 0.0 | 1 | 0 | 0.0 |
| Additional gender identityc | 0 | 0 | – | 0 | 0 | – | 1 | 0 | 0.0 | 0 | 0 | – | 0 | 0 | – |
| Age at diagnosis (yr) | |||||||||||||||
| 50–54 | 2,885 | 1,007 | 34.9 | 2,998 | 1,045 | 34.9 | 2,875 | 992 | 34.5 | 2,652 | 927 | 35.0 | 2,476 | 872 | 35.2 |
| 55–59 | 1,923 | 719 | 37.4 | 1,883 | 681 | 36.2 | 1,894 | 699 | 36.9 | 1,877 | 659 | 35.1 | 1,849 | 645 | 34.9 |
| 60–64 | 969 | 402 | 41.5 | 999 | 388 | 38.8 | 1,081 | 370 | 34.2 | 1,083 | 385 | 35.5 | 1,039 | 355 | 34.2 |
| 65–69 | 523 | 221 | 42.3 | 537 | 210 | 39.1 | 562 | 205 | 36.5 | 517 | 180 | 34.8 | 489 | 179 | 36.6 |
| 70–74 | 186 | 79 | 42.5 | 197 | 76 | 38.6 | 188 | 82 | 43.6 | 225 | 73 | 32.4 | 249 | 93 | 37.3 |
| 75–79 | 86 | 39 | 45.3 | 82 | 27 | 32.9 | 68 | 31 | 45.6 | 88 | 44 | 50.0 | 93 | 40 | 43.0 |
| 80–84 | 28 | 12 | 42.9 | 28 | 11 | 39.3 | 26 | 14 | 53.8 | 33 | 10 | 30.3 | 33 | 10 | 30.3 |
| ≥85 | 8 | 2 | 25.0 | 6 | 1 | 16.7 | 10 | 1 | 10.0 | 8 | 2 | 25.0 | 14 | 3 | 21.4 |
| Race/ethnicity | |||||||||||||||
| American Indian/Alaska Native | 26 | 14 | 53.8 | 24 | 10 | 41.7 | 30 | 6 | 20.0 | 33 | 12 | 36.4 | 30 | 12 | 40.0 |
| Asian | 104 | 38 | 36.5 | 106 | 53 | 50.0 | 125 | 44 | 35.2 | 119 | 54 | 45.4 | 115 | 47 | 40.9 |
| Black/African American | 2,801 | 1,027 | 36.7 | 2,776 | 929 | 33.5 | 2,760 | 898 | 32.5 | 2,708 | 874 | 32.3 | 2,567 | 851 | 33.2 |
| Hispanic/Latinod | 1,099 | 436 | 39.7 | 1,193 | 441 | 37.0 | 1,193 | 464 | 38.9 | 1,173 | 438 | 37.3 | 1,271 | 494 | 38.9 |
| Native Hawaiian/other Pacific Islander | 7 | 3 | 42.9 | 11 | 4 | 36.4 | 8 | 1 | 12.5 | 4 | 3 | 75.0 | 9 | 3 | 33.3 |
| White | 2,370 | 880 | 37.1 | 2,415 | 918 | 38.0 | 2,404 | 903 | 37.6 | 2,294 | 837 | 36.5 | 2,127 | 741 | 34.8 |
| Multiple races | 201 | 83 | 41.3 | 205 | 84 | 41.0 | 184 | 78 | 42.4 | 152 | 62 | 40.8 | 123 | 49 | 39.8 |
| Transmission Categorye | |||||||||||||||
| Male adultf | |||||||||||||||
| Male-to-male sexual contact | 3,171 | 1,175 | 37.1 | 3,224 | 1,157 | 35.9 | 3,195 | 1,174 | 36.7 | 3,113 | 1,098 | 35.3 | 2,978 | 1,056 | 35.4 |
| Injection drug use | 430 | 183 | 42.5 | 411 | 159 | 38.7 | 396 | 143 | 36.1 | 375 | 139 | 37.1 | 378 | 139 | 36.7 |
| Male-to-male sexual contact and injection drug use | 172 | 55 | 31.7 | 176 | 69 | 39.3 | 172 | 58 | 33.8 | 168 | 45 | 27.0 | 149 | 51 | 34.4 |
| Heterosexual contactg | 1,074 | 464 | 43.2 | 1,101 | 451 | 41.0 | 1,052 | 443 | 42.1 | 983 | 415 | 42.3 | 939 | 374 | 39.9 |
| Otherh | 11 | 5 | 49.5 | 12 | 5 | 37.2 | 12 | 5 | 41.4 | 12 | 4 | 36.7 | 13 | 4 | 31.5 |
| Subtotal | 4,858 | 1,881 | 38.7 | 4,924 | 1,841 | 37.4 | 4,826 | 1,823 | 37.8 | 4,651 | 1,702 | 36.6 | 4,457 | 1,624 | 36.4 |
| Female adultf | |||||||||||||||
| Injection drug use | 257 | 90 | 34.8 | 249 | 82 | 32.8 | 276 | 88 | 31.7 | 244 | 87 | 35.8 | 246 | 80 | 32.7 |
| Heterosexual contactg | 1,489 | 508 | 34.1 | 1,553 | 515 | 33.2 | 1,597 | 482 | 30.2 | 1,585 | 489 | 30.9 | 1,534 | 491 | 32.0 |
| Otherh | 4 | 3 | 64.1 | 4 | 1 | 33.3 | 4 | 2 | 37.2 | 4 | 1 | 38.9 | 5 | 2 | 40.8 |
| Subtotal | 1,750 | 600 | 34.3 | 1,806 | 598 | 33.1 | 1,878 | 571 | 30.4 | 1,832 | 578 | 31.6 | 1,785 | 573 | 32.1 |
| Region of residencei | |||||||||||||||
| Northeast | 1,389 | 522 | 37.6 | 1,344 | 506 | 37.6 | 1,242 | 421 | 33.9 | 1,170 | 429 | 36.7 | 1,153 | 419 | 36.3 |
| Midwest | 714 | 320 | 44.8 | 775 | 297 | 38.3 | 813 | 344 | 42.3 | 774 | 289 | 37.3 | 735 | 281 | 38.2 |
| South | 3,304 | 1,206 | 36.5 | 3,371 | 1,202 | 35.7 | 3,345 | 1,180 | 35.3 | 3,295 | 1,154 | 35.0 | 3,195 | 1,073 | 33.6 |
| West | 1,201 | 433 | 36.1 | 1,240 | 434 | 35.0 | 1,304 | 449 | 34.4 | 1,244 | 408 | 32.8 | 1,159 | 424 | 36.6 |
| Total | 6,608 | 2,481 | 37.5 | 6,730 | 2,439 | 36.2 | 6,704 | 2,394 | 35.7 | 6,483 | 2,280 | 35.2 | 6,242 | 2,197 | 35.2 |
Abbreviation: CD4, CD4+ T-lymphocyte count (cells/μL) or percentage [footnotes only].
Note. Numbers less than 12, and rates and trends based on these numbers, should be intepreted with caution.
aBased on first CD4 test performed or documentation of an AIDS-defining condition ≤3 months after a diagnosis of HIV infection.
b“Transgender male-to-female” includes individuals who were assigned “male” sex at birth but have ever identified as “female” gender. “Transgender female-to-male” includes individuals who were assigned “female” sex at birth but have ever identified as “male” gender.
cAdditional gender identity examples include “bigender,” “gender queer,” and “two-spirit.”
dHispanics/Latinos can be of any race.
eData have been statistically adjusted to account for missing transmission category; therefore, values may not sum to the column subtotals and total.
fData presented based on sex at birth and include transgender persons.
gHeterosexual contact with a person known to have, or to be at high risk for, HIV infection.
hIncludes hemophilia, blood transfusion,and risk factor not reported or not identified.
iData are based on residence at time of diagnosis of HIV infection.
| 2014 | 2015 | 2016 | 2017 | 2018 | |||||||||||
|---|---|---|---|---|---|---|---|---|---|---|---|---|---|---|---|
| Stage 3 (AIDS) at diagnosisa | Stage 3 (AIDS) at diagnosisa | Stage 3 (AIDS) at diagnosisa | Stage 3 (AIDS) at diagnosisa | Stage 3 (AIDS) at diagnosisa | |||||||||||
| Total No. | No. | % | Total No. | No. | % | Total No. | No. | % | Total No. | No. | % | Total No. | No. | % | |
| Gender | |||||||||||||||
| Male | 4,949 | 1,914 | 38.7 | 4,997 | 1,869 | 37.4 | 4,918 | 1,856 | 37.7 | 4,727 | 1,725 | 36.5 | 4,535 | 1,661 | 36.6 |
| Female | 1,788 | 616 | 34.5 | 1,843 | 610 | 33.1 | 1,909 | 581 | 30.4 | 1,863 | 587 | 31.5 | 1,814 | 584 | 32.2 |
| Transgender male-to-femaleb | 15 | 5 | 33.3 | 25 | 6 | 24.0 | 20 | 8 | 40.0 | 18 | 3 | 16.7 | 13 | 3 | 23.1 |
| Transgender female-to-maleb | 1 | 1 | 100 | 1 | 0 | 0.0 | 0 | 0 | – | 1 | 0 | 0.0 | 1 | 0 | 0.0 |
| Additional gender identityc | 0 | 0 | – | 0 | 0 | – | 1 | 0 | 0 | 0 | 0 | – | 0 | 0 | – |
| Age at diagnosis (yr) | |||||||||||||||
| 50–54 | 2,931 | 1,025 | 35.0 | 3,056 | 1,068 | 34.9 | 2,920 | 1,009 | 34.6 | 2,703 | 943 | 34.9 | 2,528 | 894 | 35.4 |
| 55–59 | 1,968 | 738 | 37.5 | 1,915 | 689 | 36.0 | 1,944 | 712 | 36.6 | 1,911 | 669 | 35.0 | 1,877 | 658 | 35.1 |
| 60–64 | 996 | 412 | 41.4 | 1,014 | 390 | 38.5 | 1,106 | 379 | 34.3 | 1,103 | 389 | 35.3 | 1,058 | 363 | 34.3 |
| 65–69 | 537 | 224 | 41.7 | 559 | 219 | 39.2 | 579 | 215 | 37.1 | 525 | 183 | 34.9 | 502 | 183 | 36.5 |
| 70–74 | 195 | 83 | 42.6 | 204 | 78 | 38.2 | 191 | 82 | 42.9 | 231 | 74 | 32.0 | 255 | 95 | 37.3 |
| 75–79 | 88 | 40 | 45.5 | 84 | 29 | 34.5 | 70 | 33 | 47.1 | 92 | 44 | 47.8 | 95 | 41 | 43.2 |
| 80–84 | 28 | 12 | 42.9 | 28 | 11 | 39.3 | 27 | 14 | 51.9 | 35 | 11 | 31.4 | 33 | 10 | 30.3 |
| ≥85 | 10 | 2 | 20.0 | 6 | 1 | 16.7 | 11 | 1 | 9.1 | 9 | 2 | 22.2 | 15 | 4 | 26.7 |
| Race/ethnicity | |||||||||||||||
| American Indian/Alaska Native | 26 | 14 | 53.8 | 24 | 10 | 41.7 | 30 | 6 | 20.0 | 33 | 12 | 36.4 | 30 | 12 | 40.0 |
| Asian | 105 | 39 | 37.1 | 106 | 53 | 50.0 | 125 | 44 | 35.2 | 119 | 54 | 45.4 | 115 | 47 | 40.9 |
| Black/African American | 2,811 | 1,032 | 36.7 | 2,778 | 930 | 33.5 | 2,762 | 899 | 32.5 | 2,708 | 874 | 32.3 | 2,569 | 851 | 33.1 |
| Hispanic/Latinod | 1,231 | 484 | 39.3 | 1,324 | 483 | 36.5 | 1,334 | 513 | 38.5 | 1,296 | 471 | 36.3 | 1,387 | 543 | 39.1 |
| Native Hawaiian/other Pacific Islander | 7 | 3 | 42.9 | 12 | 5 | 41.7 | 9 | 2 | 22.2 | 6 | 5 | 83.3 | 10 | 4 | 40.0 |
| White | 2,372 | 881 | 37.1 | 2,417 | 920 | 38.1 | 2,404 | 903 | 37.6 | 2,295 | 837 | 36.5 | 2,129 | 742 | 34.9 |
| Multiple races | 201 | 83 | 41.3 | 205 | 84 | 41.0 | 184 | 78 | 42.4 | 152 | 62 | 40.8 | 123 | 49 | 39.8 |
| Transmission Categorye | |||||||||||||||
| Male adultf | |||||||||||||||
| Male-to-male sexual contact | 3,199 | 1,181 | 36.9 | 3,264 | 1,172 | 35.9 | 3,241 | 1,183 | 36.5 | 3,151 | 1,113 | 35.3 | 3,019 | 1,071 | 35.5 |
| Injection drug use | 455 | 189 | 41.5 | 432 | 163 | 37.7 | 414 | 151 | 36.6 | 397 | 145 | 36.6 | 389 | 144 | 37.0 |
| Male-to-male sexual contact and injection drug use | 174 | 55 | 31.5 | 181 | 71 | 39.5 | 172 | 58 | 33.8 | 168 | 45 | 27.0 | 152 | 53 | 35.0 |
| Heterosexual contactg | 1,125 | 489 | 43.5 | 1,133 | 464 | 41.0 | 1,100 | 466 | 42.4 | 1,016 | 420 | 41.4 | 975 | 391 | 40.1 |
| Otherh | 11 | 5 | 49.5 | 12 | 5 | 37.2 | 12 | 5 | 41.5 | 12 | 4 | 35.5 | 13 | 4 | 31.5 |
| Subtotal | 4,964 | 1,919 | 38.7 | 5,022 | 1,875 | 37.3 | 4,938 | 1,864 | 37.7 | 4,745 | 1,728 | 36.4 | 4,548 | 1,664 | 36.6 |
| Female adultf | |||||||||||||||
| Injection drug use | 260 | 92 | 35.2 | 250 | 82 | 32.7 | 279 | 88 | 31.4 | 247 | 87 | 35.3 | 246 | 80 | 32.6 |
| Heterosexual contactg | 1,525 | 523 | 34.3 | 1,590 | 527 | 33.1 | 1,627 | 492 | 30.2 | 1,613 | 498 | 30.9 | 1,564 | 502 | 32.1 |
| Otherh | 4 | 3 | 64.1 | 4 | 1 | 33.3 | 4 | 2 | 37.2 | 4 | 1 | 38.9 | 5 | 2 | 40.8 |
| Subtotal | 1,789 | 617 | 34.5 | 1,844 | 610 | 33.1 | 1,910 | 581 | 30.4 | 1,864 | 587 | 31.5 | 1,815 | 584 | 32.2 |
| Region of residencei | |||||||||||||||
| Northeast | 1,389 | 522 | 37.6 | 1,344 | 506 | 37.6 | 1,242 | 421 | 33.9 | 1,170 | 429 | 36.7 | 1,153 | 419 | 36.3 |
| Midwest | 714 | 320 | 44.8 | 775 | 297 | 38.3 | 813 | 344 | 42.3 | 774 | 289 | 37.3 | 735 | 281 | 38.2 |
| South | 3,304 | 1,206 | 36.5 | 3,371 | 1,202 | 35.7 | 3,345 | 1,180 | 35.3 | 3,295 | 1,154 | 35.0 | 3,195 | 1,073 | 33.6 |
| West | 1,201 | 433 | 36.1 | 1,240 | 434 | 35.0 | 1,304 | 449 | 34.4 | 1,244 | 408 | 32.8 | 1,159 | 424 | 36.6 |
| U.S. dependent areas | 145 | 55 | 37.9 | 136 | 46 | 33.8 | 144 | 51 | 35.4 | 126 | 35 | 27.8 | 121 | 51 | 42.1 |
| Total | 6,753 | 2,536 | 37.6 | 6,866 | 2,485 | 36.2 | 6,848 | 2,445 | 35.7 | 6,609 | 2,315 | 35.0 | 6,363 | 2,248 | 35.3 |
Abbreviation: CD4, CD4+ T-lymphocyte count (cells/μL) or percentage [footnotes only].
Note. Numbers less than 12, and rates and trends based on these numbers, should be intepreted with caution.
aBased on first CD4 test performed or documentation of an AIDS-defining condition ≤3 months after a diagnosis of HIV infection.
b“Transgender male-to-female” includes individuals who were assigned “male” sex at birth but have ever identified as “female” gender. “Transgender female-to-male” includes individuals who were assigned “female” sex at birth but have ever identified as “male” gender.
cAdditional gender identity examples include “bigender,” “gender queer,” and “two-spirit.”
dHispanics/Latinos can be of any race.
eData have been statistically adjusted to account for missing transmission category; therefore, values may not sum to the column subtotals and total.
fData presented based on sex at birth and include transgender persons.
gHeterosexual contact with a person known to have, or to be at high risk for, HIV infection.
hIncludes hemophilia, blood transfusion,and risk factor not reported or not identified.
iData are based on residence at time of diagnosis of HIV infection.
| 2014 | 2015 | 2016 | 2017 | 2018 | |||||||||||
|---|---|---|---|---|---|---|---|---|---|---|---|---|---|---|---|
| Stage 3 (AIDS) at diagnosisa | Stage 3 (AIDS) at diagnosisa | Stage 3 (AIDS) at diagnosisa | Stage 3 (AIDS) at diagnosisa | Stage 3 (AIDS) at diagnosisa | |||||||||||
| Total No. | No. | % | Total No. | No. | % | Total No. | No. | % | Total No. | No. | % | Total No. | No. | % | |
| Male adult | |||||||||||||||
| Age at diagnosis (yr) | |||||||||||||||
| 50–54 | 2,193 | 792 | 36.1 | 2,252 | 819 | 36.4 | 2,144 | 780 | 36.4 | 1,990 | 705 | 35.4 | 1,813 | 661 | 36.5 |
| 55–59 | 1,335 | 512 | 38.4 | 1,347 | 500 | 37.1 | 1,323 | 520 | 39.3 | 1,312 | 490 | 37.3 | 1,299 | 475 | 36.6 |
| 60–64 | 700 | 305 | 43.6 | 700 | 284 | 40.6 | 736 | 272 | 37.0 | 749 | 281 | 37.5 | 717 | 255 | 35.6 |
| 65–69 | 388 | 167 | 43.0 | 385 | 153 | 39.7 | 408 | 154 | 37.7 | 365 | 139 | 38.1 | 352 | 137 | 38.9 |
| 70–74 | 143 | 62 | 43.4 | 154 | 58 | 37.7 | 142 | 65 | 45.8 | 152 | 50 | 32.9 | 177 | 63 | 35.6 |
| 75–79 | 71 | 32 | 45.1 | 64 | 22 | 34.4 | 52 | 21 | 40.4 | 53 | 27 | 50.9 | 65 | 27 | 41.5 |
| 80–84 | 25 | 10 | 40.0 | 16 | 4 | 25.0 | 17 | 10 | 58.8 | 25 | 9 | 36.0 | 24 | 5 | 20.8 |
| ≥85 | 3 | 1 | 33.3 | 6 | 1 | 16.7 | 4 | 1 | 25.0 | 5 | 1 | 20.0 | 10 | 1 | 10.0 |
| Race/Ethnicity | |||||||||||||||
| American Indian/Alaska Native | 17 | 11 | 64.7 | 14 | 4 | 28.6 | 20 | 5 | 25.0 | 21 | 7 | 33.3 | 23 | 10 | 43.5 |
| Asian | 79 | 26 | 32.9 | 81 | 45 | 55.6 | 98 | 34 | 34.7 | 84 | 42 | 50.0 | 85 | 36 | 42.4 |
| Black/African American | 1,695 | 649 | 38.3 | 1,671 | 589 | 35.2 | 1,618 | 582 | 36.0 | 1,576 | 547 | 34.7 | 1,498 | 537 | 35.8 |
| Hispanic/Latinob | 829 | 344 | 41.5 | 924 | 349 | 37.8 | 903 | 362 | 40.1 | 912 | 355 | 38.9 | 959 | 379 | 39.5 |
| Native Hawaiian/other Pacific Islander | 4 | 2 | 50.0 | 9 | 4 | 44.4 | 4 | 0 | 0.0 | 3 | 2 | 66.7 | 7 | 3 | 42.9 |
| White | 2,084 | 783 | 37.6 | 2,078 | 786 | 37.8 | 2,050 | 784 | 38.2 | 1,940 | 705 | 36.3 | 1,802 | 628 | 34.9 |
| Multiple races | 150 | 66 | 44.0 | 147 | 64 | 43.5 | 133 | 56 | 42.1 | 115 | 44 | 38.3 | 83 | 31 | 37.3 |
| Region of residencec | |||||||||||||||
| Northeast | 993 | 373 | 37.6 | 926 | 367 | 39.6 | 832 | 309 | 37.1 | 765 | 295 | 38.6 | 774 | 295 | 38.1 |
| Midwest | 553 | 255 | 46.1 | 594 | 245 | 41.2 | 625 | 276 | 44.2 | 585 | 226 | 38.6 | 574 | 227 | 39.5 |
| South | 2,344 | 896 | 38.2 | 2,381 | 874 | 36.7 | 2,311 | 855 | 37.0 | 2,286 | 838 | 36.7 | 2,204 | 776 | 35.2 |
| West | 968 | 357 | 36.9 | 1,023 | 355 | 34.7 | 1,058 | 383 | 36.2 | 1,015 | 343 | 33.8 | 905 | 326 | 36.0 |
| Subtotal, male adult | 4,858 | 1,881 | 38.7 | 4,924 | 1,841 | 37.4 | 4,826 | 1,823 | 37.8 | 4,651 | 1,702 | 36.6 | 4,457 | 1,624 | 36.4 |
| Female adult | |||||||||||||||
| Age at diagnosis (yr) | |||||||||||||||
| 50–54 | 692 | 215 | 31.1 | 746 | 226 | 30.3 | 731 | 212 | 29.0 | 662 | 222 | 33.5 | 663 | 211 | 31.8 |
| 55–59 | 588 | 207 | 35.2 | 536 | 181 | 33.8 | 571 | 179 | 31.3 | 565 | 169 | 29.9 | 550 | 170 | 30.9 |
| 60–64 | 269 | 97 | 36.1 | 299 | 104 | 34.8 | 345 | 98 | 28.4 | 334 | 104 | 31.1 | 322 | 100 | 31.1 |
| 65–69 | 135 | 54 | 40.0 | 152 | 57 | 37.5 | 154 | 51 | 33.1 | 152 | 41 | 27.0 | 137 | 42 | 30.7 |
| 70–74 | 43 | 17 | 39.5 | 43 | 18 | 41.9 | 46 | 17 | 37.0 | 73 | 23 | 31.5 | 72 | 30 | 41.7 |
| 75–79 | 15 | 7 | 46.7 | 18 | 5 | 27.8 | 16 | 10 | 62.5 | 35 | 17 | 48.6 | 28 | 13 | 46.4 |
| 80–84 | 3 | 2 | 66.7 | 12 | 7 | 58.3 | 9 | 4 | 44.4 | 8 | 1 | 12.5 | 9 | 5 | 55.6 |
| ≥85 | 5 | 1 | 20.0 | 0 | 0 | – | 6 | 0 | 0.0 | 3 | 1 | 33.3 | 4 | 2 | 50.0 |
| Race/Ethnicity | |||||||||||||||
| American Indian/Alaska Native | 9 | 3 | 33.3 | 10 | 6 | 60.0 | 10 | 1 | 10.0 | 12 | 5 | 41.7 | 7 | 2 | 28.6 |
| Asian | 25 | 12 | 48.0 | 25 | 8 | 32.0 | 27 | 10 | 37.0 | 35 | 12 | 34.3 | 30 | 11 | 36.7 |
| Black/African American | 1,106 | 378 | 34.2 | 1,105 | 340 | 30.8 | 1,142 | 316 | 27.7 | 1,132 | 327 | 28.9 | 1,069 | 314 | 29.4 |
| Hispanic/Latinob | 270 | 92 | 34.1 | 269 | 92 | 34.2 | 290 | 102 | 35.2 | 261 | 83 | 31.8 | 312 | 115 | 36.9 |
| Native Hawaiian/other Pacific Islander | 3 | 1 | 33.3 | 2 | 0 | 0.0 | 4 | 1 | 25.0 | 1 | 1 | 100 | 2 | 0 | 0.0 |
| White | 286 | 97 | 33.9 | 337 | 132 | 39.2 | 354 | 119 | 33.6 | 354 | 132 | 37.3 | 325 | 113 | 34.8 |
| Multiple races | 51 | 17 | 33.3 | 58 | 20 | 34.5 | 51 | 22 | 43.1 | 37 | 18 | 48.6 | 40 | 18 | 45.0 |
| Region of residencec | |||||||||||||||
| Northeast | 396 | 149 | 37.6 | 418 | 139 | 33.3 | 410 | 112 | 27.3 | 405 | 134 | 33.1 | 379 | 124 | 32.7 |
| Midwest | 161 | 65 | 40.4 | 181 | 52 | 28.7 | 188 | 68 | 36.2 | 189 | 63 | 33.3 | 161 | 54 | 33.5 |
| South | 960 | 310 | 32.3 | 990 | 328 | 33.1 | 1,034 | 325 | 31.4 | 1,009 | 316 | 31.3 | 991 | 297 | 30.0 |
| West | 233 | 76 | 32.6 | 217 | 79 | 36.4 | 246 | 66 | 26.8 | 229 | 65 | 28.4 | 254 | 98 | 38.6 |
| Subtotal, female adult | 1,750 | 600 | 34.3 | 1,806 | 598 | 33.1 | 1,878 | 571 | 30.4 | 1,832 | 578 | 31.6 | 1,785 | 573 | 32.1 |
| Total | 6,608 | 2,481 | 37.5 | 6,730 | 2,439 | 36.2 | 6,704 | 2,394 | 35.7 | 6,483 | 2,280 | 35.2 | 6,242 | 2,197 | 35.2 |
Abbreviation: CD4, CD4+ T-lymphocyte count (cells/µL) or percentage [footnotes only].
Note. Numbers less than 12, and rates and trends based on these numbers, should be intepreted with caution.
aBased on first CD4 test performed or documentation of an AIDS-defining condition ≤3 months after a diagnosis of HIV infection.
bHispanics/Latinos can be of any race.
cData have been statistically adjusted to account for missing transmission category; therefore, values may not sum to the column subtotals and total.
| 2014 | 2015 | 2016 | 2017 | 2018 | |||||||||||
|---|---|---|---|---|---|---|---|---|---|---|---|---|---|---|---|
| Stage 3 (AIDS) at diagnosisa | Stage 3 (AIDS) at diagnosisa | Stage 3 (AIDS) at diagnosisa | Stage 3 (AIDS) at diagnosisa | Stage 3 (AIDS) at diagnosisa | |||||||||||
| Total No. | No. | % | Total No. | No. | % | Total No. | No. | % | Total No. | No. | % | Total No. | No. | % | |
| Male Adult | |||||||||||||||
| Age at diagnosis (yr) | |||||||||||||||
| 50–54 | 2,226 | 803 | 36.1 | 2,295 | 838 | 36.5 | 2,181 | 794 | 36.4 | 2,029 | 718 | 35.4 | 1,853 | 678 | 36.6 |
| 55–59 | 1,366 | 523 | 38.3 | 1,368 | 505 | 36.9 | 1,359 | 529 | 38.9 | 1,335 | 496 | 37.2 | 1,319 | 484 | 36.7 |
| 60–64 | 723 | 314 | 43.4 | 714 | 286 | 40.1 | 754 | 279 | 37.0 | 764 | 285 | 37.3 | 732 | 262 | 35.8 |
| 65–69 | 398 | 170 | 42.7 | 397 | 157 | 39.5 | 423 | 163 | 38.5 | 372 | 141 | 37.9 | 362 | 141 | 39.0 |
| 70–74 | 148 | 65 | 43.9 | 160 | 60 | 37.5 | 145 | 65 | 44.8 | 155 | 50 | 32.3 | 181 | 64 | 35.4 |
| 75–79 | 73 | 33 | 45.2 | 66 | 24 | 36.4 | 54 | 23 | 42.6 | 57 | 27 | 47.4 | 66 | 28 | 42.4 |
| 80–84 | 25 | 10 | 40.0 | 16 | 4 | 25.0 | 18 | 10 | 55.6 | 27 | 10 | 37.0 | 24 | 5 | 20.8 |
| ≥85 | 5 | 1 | 20.0 | 6 | 1 | 16.7 | 4 | 1 | 25.0 | 6 | 1 | 16.7 | 11 | 2 | 18.2 |
| Race/Ethnicity | |||||||||||||||
| American Indian/Alaska Native | 17 | 11 | 64.7 | 14 | 4 | 28.6 | 20 | 5 | 25.0 | 21 | 7 | 33.3 | 23 | 10 | 43.5 |
| Asian | 80 | 27 | 33.8 | 81 | 45 | 55.6 | 98 | 34 | 34.7 | 84 | 42 | 50.0 | 85 | 36 | 42.4 |
| Black/African American | 1,702 | 653 | 38.4 | 1,671 | 589 | 35.2 | 1,620 | 583 | 36.0 | 1,576 | 547 | 34.7 | 1,500 | 537 | 35.8 |
| Hispanic/Latinob | 926 | 376 | 40.6 | 1,019 | 380 | 37.3 | 1,012 | 401 | 39.6 | 1,004 | 379 | 37.7 | 1,045 | 417 | 39.9 |
| Native Hawaiian/other Pacific Islander | 4 | 2 | 50.0 | 10 | 5 | 50.0 | 5 | 1 | 20.0 | 5 | 4 | 80.0 | 8 | 4 | 50.0 |
| White | 2,085 | 784 | 37.6 | 2,080 | 788 | 37.9 | 2,050 | 784 | 38.2 | 1,940 | 705 | 36.3 | 1,804 | 629 | 34.9 |
| Multiple races | 150 | 66 | 44.0 | 147 | 64 | 43.5 | 133 | 56 | 42.1 | 115 | 44 | 38.3 | 83 | 31 | 37.3 |
| Region of residencec | |||||||||||||||
| Northeast | 993 | 373 | 37.6 | 926 | 367 | 39.6 | 832 | 309 | 37.1 | 765 | 295 | 38.6 | 774 | 295 | 38.1 |
| Midwest | 553 | 255 | 46.1 | 594 | 245 | 41.2 | 625 | 276 | 44.2 | 585 | 226 | 38.6 | 574 | 227 | 39.5 |
| South | 2,344 | 896 | 38.2 | 2,381 | 874 | 36.7 | 2,311 | 855 | 37.0 | 2,286 | 838 | 36.7 | 2,204 | 776 | 35.2 |
| West | 968 | 357 | 36.9 | 1,023 | 355 | 34.7 | 1,058 | 383 | 36.2 | 1,015 | 343 | 33.8 | 905 | 326 | 36.0 |
| U.S. dependent areas | 106 | 38 | 35.8 | 98 | 34 | 34.7 | 112 | 41 | 36.6 | 94 | 26 | 27.7 | 91 | 40 | 44.0 |
| Subtotal, male adult | 4,964 | 1,919 | 38.7 | 5,022 | 1,875 | 37.3 | 4,938 | 1,864 | 37.7 | 4,745 | 1,728 | 36.4 | 4,548 | 1,664 | 36.6 |
| Female Adult | |||||||||||||||
| Age at diagnosis (yr) | |||||||||||||||
| 50–54 | 705 | 222 | 31.5 | 761 | 230 | 30.2 | 739 | 215 | 29.1 | 674 | 225 | 33.4 | 675 | 216 | 32.0 |
| 55–59 | 602 | 215 | 35.7 | 547 | 184 | 33.6 | 585 | 183 | 31.3 | 576 | 173 | 30.0 | 558 | 174 | 31.2 |
| 60–64 | 273 | 98 | 35.9 | 300 | 104 | 34.7 | 352 | 100 | 28.4 | 339 | 104 | 30.7 | 326 | 101 | 31.0 |
| 65–69 | 139 | 54 | 38.8 | 162 | 62 | 38.3 | 156 | 52 | 33.3 | 153 | 42 | 27.5 | 140 | 42 | 30.0 |
| 70–74 | 47 | 18 | 38.3 | 44 | 18 | 40.9 | 46 | 17 | 37.0 | 76 | 24 | 31.6 | 74 | 31 | 41.9 |
| 75–79 | 15 | 7 | 46.7 | 18 | 5 | 27.8 | 16 | 10 | 62.5 | 35 | 17 | 48.6 | 29 | 13 | 44.8 |
| 80–84 | 3 | 2 | 66.7 | 12 | 7 | 58.3 | 9 | 4 | 44.4 | 8 | 1 | 12.5 | 9 | 5 | 55.6 |
| ≥85 | 5 | 1 | 20.0 | 0 | 0 | – | 7 | 0 | 0.0 | 3 | 1 | 33.3 | 4 | 2 | 50.0 |
| Race/Ethnicity | |||||||||||||||
| American Indian/Alaska Native | 9 | 3 | 33.3 | 10 | 6 | 60.0 | 10 | 1 | 10.0 | 12 | 5 | 41.7 | 7 | 2 | 28.6 |
| Asian | 25 | 12 | 48.0 | 25 | 8 | 32.0 | 27 | 10 | 37.0 | 35 | 12 | 34.3 | 30 | 11 | 36.7 |
| Black/African American | 1,109 | 379 | 34.2 | 1,107 | 341 | 30.8 | 1,142 | 316 | 27.7 | 1,132 | 327 | 28.9 | 1,069 | 314 | 29.4 |
| Hispanic/Latinob | 305 | 108 | 35.4 | 305 | 103 | 33.8 | 322 | 112 | 34.8 | 292 | 92 | 31.5 | 342 | 126 | 36.8 |
| Native Hawaiian/other Pacific Islander | 3 | 1 | 33.3 | 2 | 0 | 0.0 | 4 | 1 | 25.0 | 1 | 1 | 100 | 2 | 0 | 0.0 |
| White | 287 | 97 | 33.8 | 337 | 132 | 39.2 | 354 | 119 | 33.6 | 355 | 132 | 37.2 | 325 | 113 | 34.8 |
| Multiple races | 51 | 17 | 33.3 | 58 | 20 | 34.5 | 51 | 22 | 43.1 | 37 | 18 | 48.6 | 40 | 18 | 45.0 |
| Region of residencec | |||||||||||||||
| Northeast | 396 | 149 | 37.6 | 418 | 139 | 33.3 | 410 | 112 | 27.3 | 405 | 134 | 33.1 | 379 | 124 | 32.7 |
| Midwest | 161 | 65 | 40.4 | 181 | 52 | 28.7 | 188 | 68 | 36.2 | 189 | 63 | 33.3 | 161 | 54 | 33.5 |
| South | 960 | 310 | 32.3 | 990 | 328 | 33.1 | 1,034 | 325 | 31.4 | 1,009 | 316 | 31.3 | 991 | 297 | 30.0 |
| West | 233 | 76 | 32.6 | 217 | 79 | 36.4 | 246 | 66 | 26.8 | 229 | 65 | 28.4 | 254 | 98 | 38.6 |
| U.S. dependent areas | 39 | 17 | 43.6 | 38 | 12 | 31.6 | 32 | 10 | 31.3 | 32 | 9 | 28.1 | 30 | 11 | 36.7 |
| Subtotal, female adult | 1,789 | 617 | 34.5 | 1,844 | 610 | 33.1 | 1,910 | 581 | 30.4 | 1,864 | 587 | 31.5 | 1,815 | 584 | 32.2 |
| Total | 6,753 | 2,536 | 37.6 | 6,866 | 2,485 | 36.2 | 6,848 | 2,445 | 35.7 | 6,609 | 2,315 | 35.0 | 6,363 | 2,248 | 35.3 |
Abbreviation: CD4, CD4+ T-lymphocyte count (cells/µL) or percentage [footnotes only].
Note. Numbers less than 12, and rates and trends based on these numbers, should be intepreted with caution.
aBased on first CD4 test performed or documentation of an AIDS-defining condition ≤3 months after a diagnosis of HIV infection.
bHispanics/Latinos can be of any race.
cData have been statistically adjusted to account for missing transmission category; therefore, values may not sum to the column subtotals and total.
| 2014 | 2015 | 2016 | 2017 | 2018 | |||||||||||
|---|---|---|---|---|---|---|---|---|---|---|---|---|---|---|---|
| Stage 3 (AIDS) at diagnosisa | Stage 3 (AIDS) at diagnosisa | Stage 3 (AIDS) at diagnosisa | Stage 3 (AIDS) at diagnosisa | Stage 3 (AIDS) at diagnosisa | |||||||||||
| Total No. | No. | % | Total No. | No. | % | Total No. | No. | % | Total No. | No. | % | Total No. | No. | % | |
| Adult aged 50–64 years at diagnosis | |||||||||||||||
| Male adult | |||||||||||||||
| Race/Ethnicity | |||||||||||||||
| American Indian/Alaska Native | 16 | 10 | 62.5 | 14 | 4 | 28.6 | 17 | 3 | 17.6 | 18 | 6 | 33.3 | 20 | 9 | 45.0 |
| Asian | 64 | 20 | 31.3 | 71 | 40 | 56.3 | 79 | 26 | 32.9 | 73 | 38 | 52.1 | 68 | 29 | 42.6 |
| Black/African American | 1,451 | 542 | 37.4 | 1,449 | 504 | 34.8 | 1,394 | 491 | 35.2 | 1,362 | 472 | 34.7 | 1,271 | 455 | 35.8 |
| Hispanic/Latinob | 740 | 298 | 40.3 | 812 | 309 | 38.1 | 809 | 312 | 38.6 | 796 | 317 | 39.8 | 849 | 336 | 39.6 |
| Native Hawaiian/other Pacific Islander | 3 | 2 | 66.7 | 9 | 4 | 44.4 | 2 | 0 | 0.0 | 2 | 1 | 50.0 | 6 | 2 | 33.3 |
| White | 1,822 | 682 | 37.4 | 1,821 | 689 | 37.8 | 1,780 | 686 | 38.5 | 1,695 | 604 | 35.6 | 1,545 | 533 | 34.5 |
| Multiple races | 132 | 55 | 41.7 | 123 | 53 | 43.1 | 122 | 54 | 44.3 | 105 | 38 | 36.2 | 70 | 27 | 38.6 |
| Transmission categoryc | |||||||||||||||
| Male-to-male sexual contact | 2,811 | 1,027 | 36.5 | 2,875 | 1,031 | 35.9 | 2,855 | 1,043 | 36.5 | 2,774 | 971 | 35.0 | 2,596 | 920 | 35.4 |
| Injection drug use | 369 | 155 | 41.9 | 354 | 137 | 38.9 | 333 | 122 | 36.5 | 316 | 119 | 37.6 | 328 | 122 | 37.2 |
| Male-to-male sexual contact and injection drug use | 164 | 52 | 31.7 | 165 | 63 | 38.1 | 154 | 51 | 33.3 | 153 | 40 | 26.3 | 137 | 48 | 34.8 |
| Heterosexual contactd | 879 | 374 | 42.5 | 900 | 369 | 41.0 | 856 | 355 | 41.4 | 802 | 343 | 42.8 | 760 | 299 | 39.3 |
| Othere | 5 | 2 | 40.0 | 6 | 3 | 39.1 | 5 | 2 | 34.0 | 6 | 3 | 42.6 | 8 | 3 | 35.1 |
| Region of residencef | |||||||||||||||
| Northeast | 836 | 308 | 36.8 | 792 | 315 | 39.8 | 706 | 256 | 36.3 | 654 | 246 | 37.6 | 662 | 247 | 37.3 |
| Midwest | 496 | 231 | 46.6 | 531 | 215 | 40.5 | 568 | 252 | 44.4 | 514 | 193 | 37.5 | 499 | 193 | 38.7 |
| South | 2,038 | 764 | 37.5 | 2,068 | 760 | 36.8 | 1,996 | 733 | 36.7 | 1,981 | 730 | 36.9 | 1,893 | 672 | 35.5 |
| West | 858 | 306 | 35.7 | 908 | 313 | 34.5 | 933 | 331 | 35.5 | 902 | 307 | 34.0 | 775 | 279 | 36.0 |
| Subtotal, male adult aged 50–64 years | 4,228 | 1,609 | 38.1 | 4,299 | 1,603 | 37.3 | 4,203 | 1,572 | 37.4 | 4,051 | 1,476 | 36.4 | 3,829 | 1,391 | 36.3 |
| Female adult | |||||||||||||||
| Race/Ethnicity | |||||||||||||||
| American Indian/Alaska Native | 9 | 3 | 33.3 | 9 | 6 | 66.7 | 9 | 1 | 11.1 | 11 | 5 | 45.5 | 7 | 2 | 28.6 |
| Asian | 24 | 12 | 50.0 | 20 | 6 | 30.0 | 22 | 10 | 45.5 | 30 | 12 | 40.0 | 23 | 9 | 39.1 |
| Black/African American | 963 | 322 | 33.4 | 955 | 284 | 29.7 | 1,003 | 276 | 27.5 | 943 | 268 | 28.4 | 921 | 265 | 28.8 |
| Hispanic/Latinob | 240 | 84 | 35.0 | 236 | 80 | 33.9 | 245 | 78 | 31.8 | 220 | 71 | 32.3 | 261 | 95 | 36.4 |
| Native Hawaiian/other Pacific Islander | 3 | 1 | 33.3 | 2 | 0 | 0.0 | 4 | 1 | 25.0 | 1 | 1 | 100.0 | 2 | 0 | 0.0 |
| White | 264 | 83 | 31.4 | 306 | 118 | 38.6 | 322 | 107 | 33.2 | 324 | 122 | 37.7 | 292 | 96 | 32.9 |
| Multiple races | 46 | 14 | 30.4 | 53 | 17 | 32.1 | 42 | 16 | 38.1 | 32 | 16 | 50.0 | 29 | 14 | 48.3 |
| Transmission categoryc | |||||||||||||||
| Injection drug use | 224 | 76 | 33.7 | 222 | 73 | 32.7 | 246 | 76 | 30.7 | 215 | 79 | 36.5 | 218 | 66 | 30.4 |
| Heterosexual contactd | 1,322 | 442 | 33.4 | 1,357 | 438 | 32.3 | 1,398 | 412 | 29.5 | 1,344 | 416 | 30.9 | 1,315 | 414 | 31.5 |
| Othere | 2 | 1 | 59.1 | 2 | 1 | 28.6 | 3 | 1 | 36.7 | 3 | 1 | 40.0 | 3 | 1 | 36.0 |
| Region of residencef | |||||||||||||||
| Northeast | 332 | 129 | 38.9 | 363 | 114 | 31.4 | 352 | 88 | 25.0 | 344 | 116 | 33.7 | 323 | 104 | 32.2 |
| Midwest | 142 | 55 | 38.7 | 160 | 46 | 28.8 | 173 | 65 | 37.6 | 169 | 58 | 34.3 | 140 | 47 | 33.6 |
| South | 863 | 268 | 31.1 | 871 | 283 | 32.5 | 901 | 276 | 30.6 | 841 | 262 | 31.2 | 860 | 250 | 29.1 |
| West | 212 | 67 | 31.6 | 187 | 68 | 36.4 | 221 | 60 | 27.1 | 207 | 59 | 28.5 | 212 | 80 | 37.7 |
| Subtotal, female adult aged 50–64 years | 1,549 | 519 | 33.5 | 1,581 | 511 | 32.3 | 1,647 | 489 | 29.7 | 1,561 | 495 | 31.7 | 1,535 | 481 | 31.3 |
| Both sexes | |||||||||||||||
| American Indian/Alaska Native | 25 | 13 | 52.0 | 23 | 10 | 43.5 | 26 | 4 | 15.4 | 29 | 11 | 37.9 | 27 | 11 | 40.7 |
| Asian | 88 | 32 | 36.4 | 91 | 46 | 50.5 | 101 | 36 | 35.6 | 103 | 50 | 48.5 | 91 | 38 | 41.8 |
| Black/African American | 2,414 | 864 | 35.8 | 2,404 | 788 | 32.8 | 2,397 | 767 | 32.0 | 2,305 | 740 | 32.1 | 2,192 | 720 | 32.8 |
| Hispanic/Latinob | 980 | 382 | 39.0 | 1,048 | 389 | 37.1 | 1,054 | 390 | 37.0 | 1,016 | 388 | 38.2 | 1,110 | 431 | 38.8 |
| Native Hawaiian/other Pacific Islander | 6 | 3 | 50.0 | 11 | 4 | 36.4 | 6 | 1 | 16.7 | 3 | 2 | 66.7 | 8 | 2 | 25.0 |
| White | 2,086 | 765 | 36.7 | 2,127 | 807 | 37.9 | 2,102 | 793 | 37.7 | 2,019 | 726 | 36.0 | 1,837 | 629 | 34.2 |
| Multiple races | 178 | 69 | 38.8 | 176 | 70 | 39.8 | 164 | 70 | 42.7 | 137 | 54 | 39.4 | 99 | 41 | 41.4 |
| Region of residencef | |||||||||||||||
| Northeast | 1,168 | 437 | 37.4 | 1,155 | 429 | 37.1 | 1,058 | 344 | 32.5 | 998 | 362 | 36.3 | 985 | 351 | 35.6 |
| Midwest | 638 | 286 | 44.8 | 691 | 261 | 37.8 | 741 | 317 | 42.8 | 683 | 251 | 36.7 | 639 | 240 | 37.6 |
| South | 2,901 | 1,032 | 35.6 | 2,939 | 1,043 | 35.5 | 2,897 | 1,009 | 34.8 | 2,822 | 992 | 35.2 | 2,753 | 922 | 33.5 |
| West | 1,070 | 373 | 34.9 | 1,095 | 381 | 34.8 | 1,154 | 391 | 33.9 | 1,109 | 366 | 33.0 | 987 | 359 | 36.4 |
| Subtotal, adult aged 50–64 years | 5,777 | 2,128 | 36.8 | 5,880 | 2,114 | 36.0 | 5,850 | 2,061 | 35.2 | 5,612 | 1,971 | 35.1 | 5,364 | 1,872 | 34.9 |
| Adult aged ≥65 years at diagnosis | |||||||||||||||
| Male adult | |||||||||||||||
| Race/Ethnicity | |||||||||||||||
| American Indian/Alaska Native | 1 | 1 | 100.0 | 0 | 0 | – | 3 | 2 | 66.7 | 3 | 1 | 33.3 | 3 | 1 | 33.3 |
| Asian | 15 | 6 | 40.0 | 10 | 5 | 50.0 | 19 | 8 | 42.1 | 11 | 4 | 36.4 | 17 | 7 | 41.2 |
| Black/African American | 244 | 107 | 43.9 | 222 | 85 | 38.3 | 224 | 91 | 40.6 | 214 | 75 | 35.0 | 227 | 82 | 36.1 |
| Hispanic/Latinob | 89 | 46 | 51.7 | 112 | 40 | 35.7 | 94 | 50 | 53.2 | 116 | 38 | 32.8 | 110 | 43 | 39.1 |
| Native Hawaiian/other Pacific Islander | 1 | 0 | 0.0 | 0 | 0 | – | 2 | 0 | 0.0 | 1 | 1 | 100 | 1 | 1 | 100 |
| White | 262 | 101 | 38.5 | 257 | 97 | 37.7 | 270 | 98 | 36.3 | 245 | 101 | 41.2 | 257 | 95 | 37.0 |
| Multiple races | 18 | 11 | 61.1 | 24 | 11 | 45.8 | 11 | 2 | 18.2 | 10 | 6 | 60.0 | 13 | 4 | 30.8 |
| Transmission categoryc | |||||||||||||||
| Male-to-male sexual contact | 360 | 148 | 41.1 | 350 | 126 | 36.1 | 340 | 131 | 38.6 | 339 | 126 | 37.2 | 382 | 136 | 35.5 |
| Injection drug use | 61 | 28 | 46.1 | 57 | 22 | 37.6 | 63 | 21 | 34.2 | 59 | 21 | 34.9 | 50 | 17 | 33.1 |
| Male-to-male sexual contact and injection drug use | 9 | 3 | 31.1 | 12 | 7 | 56.4 | 18 | 7 | 38.2 | 15 | 5 | 34.2 | 12 | 3 | 29.3 |
| Heterosexual contactd | 195 | 90 | 46.1 | 201 | 82 | 40.7 | 196 | 89 | 45.2 | 181 | 72 | 39.9 | 179 | 76 | 42.4 |
| Othere | 6 | 3 | 57.9 | 6 | 2 | 35.1 | 7 | 3 | 46.4 | 6 | 2 | 30.5 | 5 | 1 | 26.4 |
| Region of residencef | |||||||||||||||
| Northeast | 157 | 65 | 41.4 | 134 | 52 | 38.8 | 126 | 53 | 42.1 | 111 | 49 | 44.1 | 112 | 48 | 42.9 |
| Midwest | 57 | 24 | 42.1 | 63 | 30 | 47.6 | 57 | 24 | 42.1 | 71 | 33 | 46.5 | 75 | 34 | 45.3 |
| South | 306 | 132 | 43.1 | 313 | 114 | 36.4 | 315 | 122 | 38.7 | 305 | 108 | 35.4 | 311 | 104 | 33.4 |
| West | 110 | 51 | 46.4 | 115 | 42 | 36.5 | 125 | 52 | 41.6 | 113 | 36 | 31.9 | 130 | 47 | 36.2 |
| Subtotal, male adult aged ≥65 years | 630 | 272 | 43.2 | 625 | 238 | 38.1 | 623 | 251 | 40.3 | 600 | 226 | 37.7 | 628 | 233 | 37.1 |
| Female adult | |||||||||||||||
| Race/Ethnicity | |||||||||||||||
| American Indian/Alaska Native | 0 | 0 | – | 1 | 0 | 0.0 | 1 | 0 | 0.0 | 1 | 0 | 0.0 | 0 | 0 | – |
| Asian | 1 | 0 | 0.0 | 5 | 2 | 40.0 | 5 | 0 | 0.0 | 5 | 0 | 0.0 | 7 | 2 | 28.6 |
| Black/African American | 143 | 56 | 39.2 | 150 | 56 | 37.3 | 139 | 40 | 28.8 | 189 | 59 | 31.2 | 148 | 49 | 33.1 |
| Hispanic/Latinob | 30 | 8 | 26.7 | 33 | 12 | 36.4 | 45 | 24 | 53.3 | 41 | 12 | 29.3 | 51 | 20 | 39.2 |
| Native Hawaiian/other Pacific Islander | 0 | 0 | – | 0 | 0 | – | 0 | 0 | – | 0 | 0 | – | 0 | 0 | – |
| White | 22 | 14 | 63.6 | 31 | 14 | 45.2 | 32 | 12 | 37.5 | 30 | 10 | 33.3 | 33 | 17 | 51.5 |
| Multiple races | 5 | 3 | 60.0 | 5 | 3 | 60.0 | 9 | 6 | 66.7 | 5 | 2 | 40.0 | 11 | 4 | 36.4 |
| Transmission categoryc | |||||||||||||||
| Injection drug use | 33 | 14 | 42.2 | 27 | 9 | 33.6 | 30 | 12 | 39.8 | 29 | 9 | 30.1 | 29 | 14 | 49.8 |
| Heterosexual contactd | 167 | 66 | 39.6 | 196 | 77 | 39.4 | 200 | 70 | 34.8 | 241 | 74 | 30.7 | 219 | 77 | 35.0 |
| Othere | 2 | 1 | 70.6 | 2 | 1 | 38.9 | 1 | 1 | 38.5 | 1 | 0 | 36.4 | 2 | 1 | 45.8 |
| Region of residencef | |||||||||||||||
| Northeast | 64 | 20 | 31.3 | 55 | 25 | 45.5 | 58 | 24 | 41.4 | 61 | 18 | 29.5 | 56 | 20 | 35.7 |
| Midwest | 19 | 10 | 52.6 | 21 | 6 | 28.6 | 15 | 3 | 20.0 | 20 | 5 | 25.0 | 21 | 7 | 33.3 |
| South | 97 | 42 | 43.3 | 119 | 45 | 37.8 | 133 | 49 | 36.8 | 168 | 54 | 32.1 | 131 | 47 | 35.9 |
| West | 21 | 9 | 42.9 | 30 | 11 | 36.7 | 25 | 6 | 24.0 | 22 | 6 | 27.3 | 42 | 18 | 42.9 |
| Subtotal, female adult aged ≥65 years | 201 | 81 | 40.3 | 225 | 87 | 38.7 | 231 | 82 | 35.5 | 271 | 83 | 30.6 | 250 | 92 | 36.8 |
| Both sexes | |||||||||||||||
| Race/Ethnicity | |||||||||||||||
| American Indian/Alaska Native | 1 | 1 | 100 | 1 | 0 | 0 | 4 | 2 | 50.0 | 4 | 1 | 25.0 | 3 | 1 | 33.3 |
| Asian | 16 | 6 | 37.5 | 15 | 7 | 46.7 | 24 | 8 | 33.3 | 16 | 4 | 25.0 | 24 | 9 | 37.5 |
| Black/African American | 387 | 163 | 42.1 | 372 | 141 | 37.9 | 363 | 131 | 36.1 | 403 | 134 | 33.3 | 375 | 131 | 34.9 |
| Hispanic/Latinob | 119 | 54 | 45.4 | 145 | 52 | 35.9 | 139 | 74 | 53.2 | 157 | 50 | 31.8 | 161 | 63 | 39.1 |
| Native Hawaiian/other Pacific Islander | 1 | 0 | 0.0 | 0 | 0 | – | 2 | 0 | 0.0 | 1 | 1 | 100 | 1 | 1 | 100 |
| White | 284 | 115 | 40.5 | 288 | 111 | 38.5 | 302 | 110 | 36.4 | 275 | 111 | 40.4 | 290 | 112 | 38.6 |
| Multiple races | 23 | 14 | 60.9 | 29 | 14 | 48.3 | 20 | 8 | 40.0 | 15 | 8 | 53.3 | 24 | 8 | 33.3 |
| Region of residencef | |||||||||||||||
| Northeast | 221 | 85 | 38.5 | 189 | 77 | 40.7 | 184 | 77 | 41.8 | 172 | 67 | 39.0 | 168 | 68 | 40.5 |
| Midwest | 76 | 34 | 44.7 | 84 | 36 | 42.9 | 72 | 27 | 37.5 | 91 | 38 | 41.8 | 96 | 41 | 42.7 |
| South | 403 | 174 | 43.2 | 432 | 159 | 36.8 | 448 | 171 | 38.2 | 473 | 162 | 34.2 | 442 | 151 | 34.2 |
| West | 131 | 60 | 45.8 | 145 | 53 | 36.6 | 150 | 58 | 38.7 | 135 | 42 | 31.1 | 172 | 65 | 37.8 |
| Subtotal, adult aged ≥65 years | 831 | 353 | 42.5 | 850 | 325 | 38.2 | 854 | 333 | 39.0 | 871 | 309 | 35.5 | 878 | 325 | 37.0 |
| Total | 6,608 | 2,481 | 37.5 | 6,730 | 2,439 | 36.2 | 6,704 | 2,394 | 35.7 | 6,483 | 2,280 | 35.2 | 6,242 | 2,197 | 35.2 |
Note. Numbers less than 12, and rates and trends based on these numbers, should be intepreted with caution.
aBased on first CD4 test performed or documentation of an AIDS-defining condition ≤3 months after a diagnosis of HIV infection.
bHispanics/Latinos can be of any race.
cData have been statistically adjusted to account for missing transmission category; therefore, values may not sum to the column subtotals and total.
dHeterosexual contact with a person known to have, or to be at high risk for, HIV infection.
eIncludes hemophilia, blood transfusion,and risk factor not reported or not identified.
fData are based on residence at time of diagnosis of HIV infection.
Black/African American
| 2014 | 2015 | 2016 | 2017 | 2018 | |||||||||||
|---|---|---|---|---|---|---|---|---|---|---|---|---|---|---|---|
| Stage 3 (AIDS) at diagnosisa | Stage 3 (AIDS) at diagnosisa | Stage 3 (AIDS) at diagnosisa | Stage 3 (AIDS) at diagnosisa | Stage 3 (AIDS) at diagnosisa | |||||||||||
| Total No. | No. | % | Total No. | No. | % | Total No. | No. | % | Total No. | No. | % | Total No. | No. | % | |
| Adult aged 50–64 years at diagnosis | |||||||||||||||
| Male adult | |||||||||||||||
| Race/Ethnicity | |||||||||||||||
| American Indian/Alaska Native | 16 | 10 | 62.5 | 14 | 4 | 28.6 | 17 | 3 | 17.6 | 18 | 6 | 33.3 | 20 | 9 | 45.0 |
| Asian | 65 | 21 | 32.3 | 71 | 40 | 56.3 | 79 | 26 | 32.9 | 73 | 38 | 52.1 | 68 | 29 | 42.6 |
| 1,457 | 546 | 37.5 | 1,449 | 504 | 34.8 | 1,396 | 492 | 35.2 | 1,362 | 472 | 34.7 | 1,273 | 455 | 35.7 | |
| Hispanic/Latinob | 819 | 323 | 39.4 | 887 | 332 | 37.4 | 897 | 340 | 37.9 | 871 | 338 | 38.8 | 919 | 367 | 39.9 |
| Native Hawaiian/other Pacific Islander | 3 | 2 | 66.7 | 10 | 5 | 50.0 | 3 | 1 | 33.3 | 4 | 3 | 75.0 | 7 | 3 | 42.9 |
| White | 1,823 | 683 | 37.5 | 1,823 | 691 | 37.9 | 1,780 | 686 | 38.5 | 1,695 | 604 | 35.6 | 1,547 | 534 | 34.5 |
| Multiple races | 132 | 55 | 41.7 | 123 | 53 | 43.1 | 122 | 54 | 44.3 | 105 | 38 | 36.2 | 70 | 27 | 38.6 |
| Transmission categoryc | |||||||||||||||
| Male-to-male sexual contact | 2,835 | 1,031 | 36.4 | 2,909 | 1,044 | 35.9 | 2,899 | 1,052 | 36.3 | 2,809 | 985 | 35.1 | 2,634 | 935 | 35.5 |
| Injection drug use | 392 | 161 | 41.1 | 373 | 141 | 37.9 | 348 | 127 | 36.6 | 334 | 125 | 37.4 | 336 | 127 | 37.7 |
| Male-to-male sexual contact and injection drug use | 164 | 52 | 31.7 | 167 | 64 | 38.3 | 155 | 52 | 33.3 | 153 | 40 | 26.3 | 139 | 49 | 35.0 |
| Heterosexual contactd | 920 | 394 | 42.8 | 923 | 378 | 40.9 | 888 | 369 | 41.6 | 826 | 346 | 41.9 | 787 | 311 | 39.6 |
| Othere | 5 | 2 | 40.0 | 6 | 3 | 39.1 | 5 | 2 | 34.7 | 6 | 3 | 41.9 | 8 | 3 | 35.1 |
| Region of residencef | |||||||||||||||
| Northeast | 836 | 308 | 36.8 | 792 | 315 | 39.8 | 706 | 256 | 36.3 | 654 | 246 | 37.6 | 662 | 247 | 37.3 |
| Midwest | 496 | 231 | 46.6 | 531 | 215 | 40.5 | 568 | 252 | 44.4 | 514 | 193 | 37.5 | 499 | 193 | 38.7 |
| South | 2,038 | 764 | 37.5 | 2,068 | 760 | 36.8 | 1,996 | 733 | 36.7 | 1,981 | 730 | 36.9 | 1,893 | 672 | 35.5 |
| West | 858 | 306 | 35.7 | 908 | 313 | 34.5 | 933 | 331 | 35.5 | 902 | 307 | 34.0 | 775 | 279 | 36.0 |
| U.S. dependent areas | 87 | 31 | 35.6 | 78 | 26 | 33.3 | 91 | 30 | 33.0 | 77 | 23 | 29.9 | 75 | 33 | 44.0 |
| Subtotal, male adult aged 50–64 years | 4,315 | 1,640 | 38.0 | 4,377 | 1,629 | 37.2 | 4,294 | 1,602 | 37.3 | 4,128 | 1,499 | 36.3 | 3,904 | 1,424 | 36.5 |
| Female adult | |||||||||||||||
| Race/Ethnicity | |||||||||||||||
| American Indian/Alaska Native | 9 | 3 | 33.3 | 9 | 6 | 66.7 | 9 | 1 | 11.1 | 11 | 5 | 45.5 | 7 | 2 | 28.6 |
| Asian | 24 | 12 | 50.0 | 20 | 6 | 30.0 | 22 | 10 | 45.5 | 30 | 12 | 40.0 | 23 | 9 | 39.1 |
| Black/African American | 966 | 323 | 33.4 | 955 | 284 | 29.7 | 1,003 | 276 | 27.5 | 943 | 268 | 28.4 | 921 | 265 | 28.8 |
| Hispanic/Latinob | 268 | 99 | 36.9 | 263 | 87 | 33.1 | 274 | 87 | 31.8 | 247 | 78 | 31.6 | 285 | 105 | 36.8 |
| Native Hawaiian/other Pacific Islander | 3 | 1 | 33.3 | 2 | 0 | 0.0 | 4 | 1 | 25.0 | 1 | 1 | 100 | 2 | 0 | 0.0 |
| White | 264 | 83 | 31.4 | 306 | 118 | 38.6 | 322 | 107 | 33.2 | 325 | 122 | 37.5 | 292 | 96 | 32.9 |
| Multiple races | 46 | 14 | 30.4 | 53 | 17 | 32.1 | 42 | 16 | 38.1 | 32 | 16 | 50.0 | 29 | 14 | 48.3 |
| Transmission categoryc | |||||||||||||||
| Injection drug use | 226 | 78 | 34.3 | 223 | 73 | 32.5 | 249 | 76 | 30.4 | 218 | 79 | 36.0 | 218 | 66 | 30.3 |
| Heterosexual contactd | 1,351 | 456 | 33.7 | 1,383 | 445 | 32.2 | 1,424 | 421 | 29.6 | 1,368 | 423 | 30.9 | 1,339 | 424 | 31.7 |
| Othere | 2 | 1 | 59.1 | 2 | 1 | 28.6 | 3 | 1 | 36.7 | 3 | 1 | 40.0 | 3 | 1 | 36.0 |
| Region of residencef | |||||||||||||||
| Northeast | 332 | 129 | 38.9 | 363 | 114 | 31.4 | 352 | 88 | 25.0 | 344 | 116 | 33.7 | 323 | 104 | 32.2 |
| Midwest | 142 | 55 | 38.7 | 160 | 46 | 28.8 | 173 | 65 | 37.6 | 169 | 58 | 34.3 | 140 | 47 | 33.6 |
| South | 863 | 268 | 31.1 | 871 | 283 | 32.5 | 901 | 276 | 30.6 | 841 | 262 | 31.2 | 860 | 250 | 29.1 |
| West | 212 | 67 | 31.6 | 187 | 68 | 36.4 | 221 | 60 | 27.1 | 207 | 59 | 28.5 | 212 | 80 | 37.7 |
| U.S dependent areas | 31 | 16 | 51.6 | 27 | 7 | 25.9 | 29 | 9 | 31.0 | 28 | 7 | 25.0 | 24 | 10 | 41.7 |
| Subtotal, female adult aged 50–64 years | 1,580 | 535 | 33.9 | 1,608 | 518 | 32.2 | 1,676 | 498 | 29.7 | 1,589 | 502 | 31.6 | 1,559 | 491 | 31.5 |
| Both sexes | |||||||||||||||
| Race/Ethnicity | |||||||||||||||
| American Indian/Alaska Native | 25 | 13 | 52.0 | 23 | 10 | 43.5 | 26 | 4 | 15.4 | 29 | 11 | 37.9 | 27 | 11 | 40.7 |
| Asian | 89 | 33 | 37.1 | 91 | 46 | 50.5 | 101 | 36 | 35.6 | 103 | 50 | 48.5 | 91 | 38 | 41.8 |
| Black/African American | 2,423 | 869 | 35.9 | 2,404 | 788 | 32.8 | 2,399 | 768 | 32.0 | 2,305 | 740 | 32.1 | 2,194 | 720 | 32.8 |
| Hispanic/Latinob | 1,087 | 422 | 38.8 | 1,150 | 419 | 36.4 | 1,171 | 427 | 36.5 | 1,118 | 416 | 37.2 | 1,204 | 472 | 39.2 |
| Native Hawaiian/other Pacific Islander | 6 | 3 | 50.0 | 12 | 5 | 41.7 | 7 | 2 | 28.6 | 5 | 4 | 80.0 | 9 | 3 | 33.3 |
| White | 2,087 | 766 | 36.7 | 2,129 | 809 | 38.0 | 2,102 | 793 | 37.7 | 2,020 | 726 | 35.9 | 1,839 | 630 | 34.3 |
| Multiple races | 178 | 69 | 38.8 | 176 | 70 | 39.8 | 164 | 70 | 42.7 | 137 | 54 | 39.4 | 99 | 41 | 41.4 |
| Region of residencef | |||||||||||||||
| Northeast | 1,168 | 437 | 37.4 | 1,155 | 429 | 37.1 | 1,058 | 344 | 32.5 | 998 | 362 | 36.3 | 985 | 351 | 35.6 |
| Midwest | 638 | 286 | 44.8 | 691 | 261 | 37.8 | 741 | 317 | 42.8 | 683 | 251 | 36.7 | 639 | 240 | 37.6 |
| South | 2,901 | 1,032 | 35.6 | 2,939 | 1,043 | 35.5 | 2,897 | 1,009 | 34.8 | 2,822 | 992 | 35.2 | 2,753 | 922 | 33.5 |
| West | 1,070 | 373 | 34.9 | 1,095 | 381 | 34.8 | 1,154 | 391 | 33.9 | 1,109 | 366 | 33.0 | 987 | 359 | 36.4 |
| U.S dependent areas | 118 | 47 | 39.8 | 105 | 33 | 31.4 | 120 | 39 | 32.5 | 105 | 30 | 28.6 | 99 | 43 | 43.4 |
| Subtotal, adult aged 50–64 years | 5,895 | 2,175 | 36.9 | 5,985 | 2,147 | 35.9 | 5,970 | 2,100 | 35.2 | 5,717 | 2,001 | 35.0 | 5,463 | 1,915 | 35.1 |
| Adult aged ≥65 years at diagnosis | |||||||||||||||
| Male adult | |||||||||||||||
| Race/Ethnicity | |||||||||||||||
| American Indian/Alaska Native | 1 | 1 | 100 | 0 | 0 | – | 3 | 2 | 66.7 | 3 | 1 | 33.3 | 3 | 1 | 33.3 |
| Asian | 15 | 6 | 40.0 | 10 | 5 | 50.0 | 19 | 8 | 42.1 | 11 | 4 | 36.4 | 17 | 7 | 41.2 |
| Black/African American | 245 | 107 | 43.7 | 222 | 85 | 38.3 | 224 | 91 | 40.6 | 214 | 75 | 35.0 | 227 | 82 | 36.1 |
| Hispanic/Latinob | 107 | 53 | 49.5 | 132 | 48 | 36.4 | 115 | 61 | 53.0 | 133 | 41 | 30.8 | 126 | 50 | 39.7 |
| Native Hawaiian/other Pacific Islander | 1 | 0 | 0.0 | 0 | 0 | – | 2 | 0 | 0.0 | 1 | 1 | 100 | 1 | 1 | 100 |
| White | 262 | 101 | 38.5 | 257 | 97 | 37.7 | 270 | 98 | 36.3 | 245 | 101 | 41.2 | 257 | 95 | 37.0 |
| Multiple races | 18 | 11 | 61.1 | 24 | 11 | 45.8 | 11 | 2 | 18.2 | 10 | 6 | 60.0 | 13 | 4 | 30.8 |
| Transmission categoryc | |||||||||||||||
| Male-to-male sexual contact | 365 | 150 | 41.1 | 356 | 128 | 36.0 | 342 | 131 | 38.3 | 342 | 127 | 37.2 | 385 | 137 | 35.6 |
| Injection drug use | 63 | 28 | 44.3 | 59 | 22 | 36.4 | 66 | 24 | 36.4 | 64 | 21 | 32.4 | 53 | 17 | 32.6 |
| Male-to-male sexual contact and injection drug use | 10 | 3 | 28.0 | 14 | 8 | 55.1 | 18 | 7 | 38.2 | 15 | 5 | 34.2 | 13 | 4 | 34.9 |
| Heterosexual contactd | 206 | 95 | 46.2 | 211 | 87 | 41.1 | 212 | 97 | 45.9 | 190 | 74 | 39.1 | 188 | 80 | 42.5 |
| Othere | 6 | 3 | 57.9 | 6 | 2 | 35.1 | 7 | 3 | 46.4 | 6 | 2 | 29.0 | 5 | 1 | 26.4 |
| Region of residencef | |||||||||||||||
| Northeast | 157 | 65 | 41.4 | 134 | 52 | 38.8 | 126 | 53 | 42.1 | 111 | 49 | 44.1 | 112 | 48 | 42.9 |
| Midwest | 57 | 24 | 42.1 | 63 | 30 | 47.6 | 57 | 24 | 42.1 | 71 | 33 | 46.5 | 75 | 34 | 45.3 |
| South | 306 | 132 | 43.1 | 313 | 114 | 36.4 | 315 | 122 | 38.7 | 305 | 108 | 35.4 | 311 | 104 | 33.4 |
| West | 110 | 51 | 46.4 | 115 | 42 | 36.5 | 125 | 52 | 41.6 | 113 | 36 | 31.9 | 130 | 47 | 36.2 |
| U.S dependent areas | 19 | 7 | 36.8 | 20 | 8 | 40.0 | 21 | 11 | 52.4 | 17 | 3 | 17.6 | 16 | 7 | 43.8 |
| Subtotal, male adult aged ≥65 years | 649 | 279 | 43.0 | 645 | 246 | 38.1 | 644 | 262 | 40.7 | 617 | 229 | 37.1 | 644 | 240 | 37.3 |
| Female adult | |||||||||||||||
| Race/Ethnicity | |||||||||||||||
| American Indian/Alaska Native | 0 | 0 | – | 1 | 0 | 0.0 | 1 | 0 | 0.0 | 1 | 0 | 0.0 | 0 | 0 | – |
| Asian | 1 | 0 | 0.0 | 5 | 2 | 40.0 | 5 | 0 | 0.0 | 5 | 0 | 0.0 | 7 | 2 | 28.6 |
| Black/African American | 143 | 56 | 39.2 | 152 | 57 | 37.5 | 139 | 40 | 28.8 | 189 | 59 | 31.2 | 148 | 49 | 33.1 |
| Hispanic/Latinob | 37 | 9 | 24.3 | 42 | 16 | 38.1 | 48 | 25 | 52.1 | 45 | 14 | 31.1 | 57 | 21 | 36.8 |
| Native Hawaiian/other Pacific Islander | 0 | 0 | – | 0 | 0 | – | 0 | 0 | – | 0 | 0 | – | 0 | 0 | – |
| White | 23 | 14 | 60.9 | 31 | 14 | 45.2 | 32 | 12 | 37.5 | 30 | 10 | 33.3 | 33 | 17 | 51.5 |
| Multiple races | 5 | 3 | 60.0 | 5 | 3 | 60.0 | 9 | 6 | 66.7 | 5 | 2 | 40.0 | 11 | 4 | 36.4 |
| Transmission categoryc | |||||||||||||||
| Injection drug use | 34 | 14 | 40.9 | 27 | 9 | 33.8 | 30 | 12 | 39.5 | 29 | 9 | 29.8 | 29 | 14 | 49.8 |
| Heterosexual contactd | 174 | 67 | 38.6 | 207 | 82 | 39.7 | 203 | 71 | 34.8 | 245 | 76 | 31.0 | 225 | 78 | 34.5 |
| Othere | 2 | 1 | 70.6 | 2 | 1 | 38.9 | 1 | 1 | 38.5 | 1 | 0 | 36.4 | 2 | 1 | 45.8 |
| Region of residencef | |||||||||||||||
| Northeast | 64 | 20 | 31.3 | 55 | 25 | 45.5 | 58 | 24 | 41.4 | 61 | 18 | 29.5 | 56 | 20 | 35.7 |
| Midwest | 19 | 10 | 52.6 | 21 | 6 | 28.6 | 15 | 3 | 20.0 | 20 | 5 | 25.0 | 21 | 7 | 33.3 |
| South | 97 | 42 | 43.3 | 119 | 45 | 37.8 | 133 | 49 | 36.8 | 168 | 54 | 32.1 | 131 | 47 | 35.9 |
| West | 21 | 9 | 42.9 | 30 | 11 | 36.7 | 25 | 6 | 24.0 | 22 | 6 | 27.3 | 42 | 18 | 42.9 |
| U.S dependent areas | 8 | 1 | 12.5 | 11 | 5 | 45.5 | 3 | 1 | 33.3 | 4 | 2 | 50.0 | 6 | 1 | 16.7 |
| Subtotal, female adult aged ≥65 years | 209 | 82 | 39.2 | 236 | 92 | 39.0 | 234 | 83 | 35.5 | 275 | 85 | 30.9 | 256 | 93 | 36.3 |
| Both sexes | |||||||||||||||
| Race/Ethnicity | |||||||||||||||
| American Indian/Alaska Native | 1 | 1 | 100 | 1 | 0 | 0 | 4 | 2 | 50.0 | 4 | 1 | 25.0 | 3 | 1 | 33.3 |
| Asian | 16 | 6 | 37.5 | 15 | 7 | 46.7 | 24 | 8 | 33.3 | 16 | 4 | 25.0 | 24 | 9 | 37.5 |
| Black/African American | 388 | 163 | 42.0 | 374 | 142 | 38.0 | 363 | 131 | 36.1 | 403 | 134 | 33.3 | 375 | 131 | 34.9 |
| Hispanic/Latinob | 144 | 62 | 43.1 | 174 | 64 | 36.8 | 163 | 86 | 52.8 | 178 | 55 | 30.9 | 183 | 71 | 38.8 |
| Native Hawaiian/other Pacific Islander | 1 | 0 | 0.0 | 0 | 0 | – | 2 | 0 | 0.0 | 1 | 1 | 100 | 1 | 1 | 100 |
| White | 285 | 115 | 40.4 | 288 | 111 | 38.5 | 302 | 110 | 36.4 | 275 | 111 | 40.4 | 290 | 112 | 38.6 |
| Multiple races | 23 | 14 | 60.9 | 29 | 14 | 48.3 | 20 | 8 | 40.0 | 15 | 8 | 53.3 | 24 | 8 | 33.3 |
| Region of residencef | |||||||||||||||
| Northeast | 221 | 85 | 38.5 | 189 | 77 | 40.7 | 184 | 77 | 41.8 | 172 | 67 | 39.0 | 168 | 68 | 40.5 |
| Midwest | 76 | 34 | 44.7 | 84 | 36 | 42.9 | 72 | 27 | 37.5 | 91 | 38 | 41.8 | 96 | 41 | 42.7 |
| South | 403 | 174 | 43.2 | 432 | 159 | 36.8 | 448 | 171 | 38.2 | 473 | 162 | 34.2 | 442 | 151 | 34.2 |
| West | 131 | 60 | 45.8 | 145 | 53 | 36.6 | 150 | 58 | 38.7 | 135 | 42 | 31.1 | 172 | 65 | 37.8 |
| U.S dependent areas | 27 | 8 | 29.6 | 31 | 13 | 41.9 | 24 | 12 | 50.0 | 21 | 5 | 23.8 | 22 | 8 | 36.4 |
| Subtotal, adult aged ≥65 years | 858 | 361 | 42.1 | 881 | 338 | 38.4 | 878 | 345 | 39.3 | 892 | 314 | 35.2 | 900 | 333 | 37.0 |
| Total | 6,753 | 2,536 | 37.6 | 6,866 | 2,485 | 36.2 | 6,848 | 2,445 | 35.7 | 6,609 | 2,315 | 35.0 | 6,363 | 2,248 | 35.3 |
Note. Numbers less than 12, and rates and trends based on these numbers, should be intepreted with caution.
aBased on first CD4 test performed or documentation of an AIDS-defining condition ≤3 months after a diagnosis of HIV infection.
bHispanics/Latinos can be of any race.
cData have been statistically adjusted to account for missing transmission category; therefore, values may not sum to the column subtotals and total.
dHeterosexual contact with a person known to have, or to be at high risk for, HIV infection.
eIncludes hemophilia, blood transfusion,and risk factor not reported or not identified.
fData are based on residence at time of diagnosis of HIV infection.