Diagnoses of HIV Infection in the United States and Dependent Areas, 2018: Diagnoses

All rates are per 100,000 population. The standard used for reporting trends in numbers and rates is an increase or a decrease of 5% or more during the specified time frame (e.g., when comparing 2014 and 2018). The exceptions to this standard are where numbers were small (i.e., less than 12) or rates were based on small numbers.
Please read all titles and footnotes carefully to ensure a complete understanding of the displayed data.
Figure 1. Rates of Diagnoses of HIV Infection among Adults and Adolescents, 2018—United States and 6 Dependent Areas
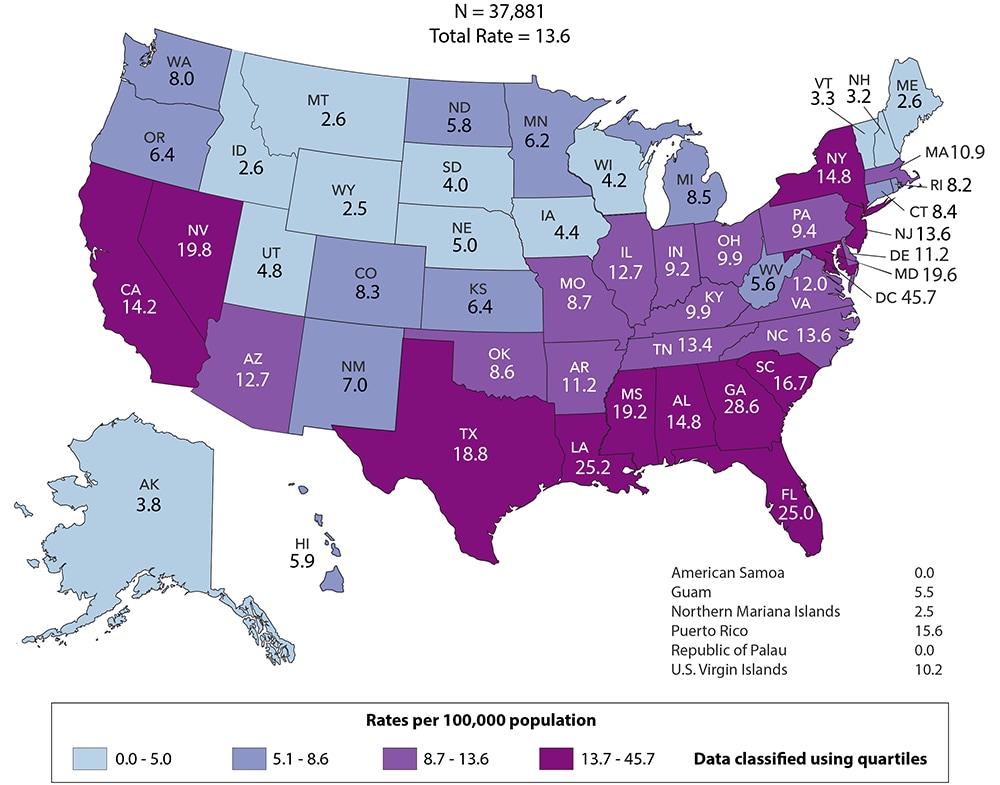
From 2014 through 2018, the annual number and rate of diagnoses of HIV infection in the United States and 6 dependent areas decreased (Table 1b). In the United States and 6 dependent areas, the overall rate in 2018 was 11.5; among adults and adolescents, the rate was 13.6 (Figure 1). From 2014 through 2018, by region, the rate of diagnoses of HIV infection in all regions decreased. In 2018, the rates were 15.6 in the South, 9.9 in the Northeast, 9.7 in the West, and 7.2 in the Midwest (Table 1b).
Figure 2. Diagnoses of HIV Infection among Adults and Adolescents, by Gender, 2014–2018—United States and 6 Dependent Areas
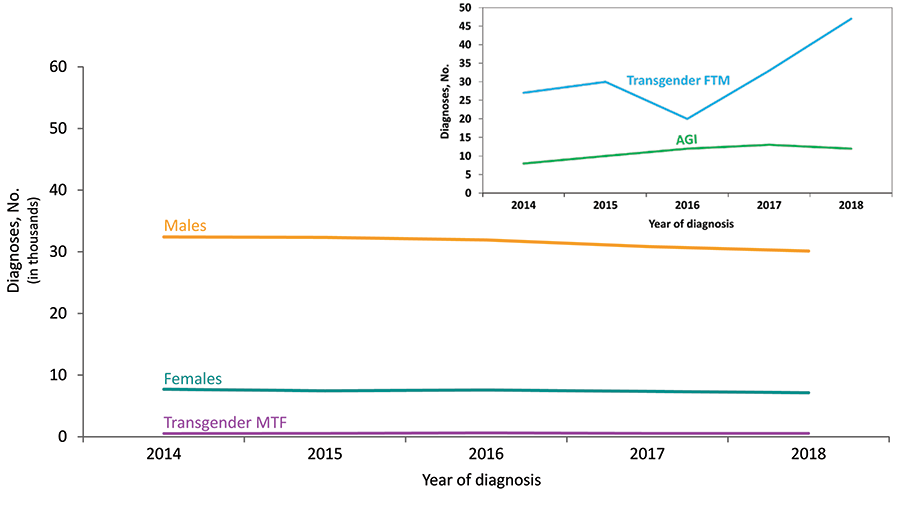
Note: See Data Tables, Definitions, and Acronyms for more information on gender.
From 2014 through 2018 in the United States and 6 dependent areas, the number of diagnoses of HIV infection for transgender male-to-female (MTF) and transgender female-to-male (FTM) adults and adolescents increased (Figure 2). The number of diagnoses among male and female adults and adolescents decreased. In 2018, among all adults and adolescents, diagnoses of HIV infection among males (79%) and females (19%) accounted for approximately 98% of HIV infections diagnosed in the United States and 6 dependent areas (Table 1b). Transgender MTF accounted for slightly more than 1% of annual diagnoses and transgender FTM accounted for less than 1%. Please use caution when interpreting data for additional gender identity (AGI): the numbers are small.
Figure 3. Rates of Diagnoses of HIV Infection among Adults and Adolescents, by Age at Diagnosis, 2014–2018—United States
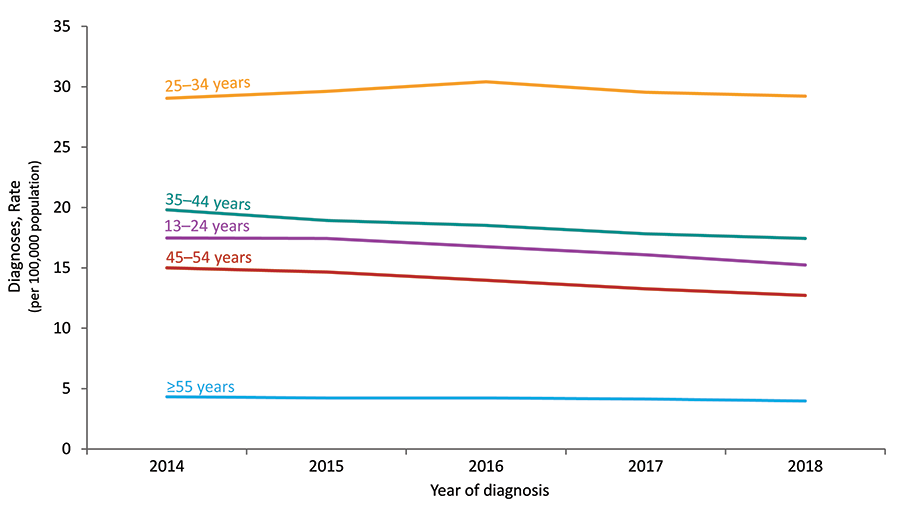
From 2014 through 2018 in the United States, the rates for persons aged 13–24, 35–44, 45–54, and 55 years and older decreased. The rate for persons aged 25–34 years remained stable (Figure 3). The rates for children (aged less than 13 years) and persons aged 13–14, 20–24, 35–39, 40–44, 45–49, 50–54, 55–59, and 65 years and older decreased (Table 1a). The rates for persons aged 15–19, 25–29, 30–34, and 60–64 years remained stable. In 2018, the highest rate (32.6) was for persons aged 25–29 years, followed by the rate (27.9) for persons aged 20–24 years (Table 1a).
Figure 4. Rates of Diagnoses of HIV Infection among Adults and Adolescents, by Race/Ethnicity, 2014–2018—United States
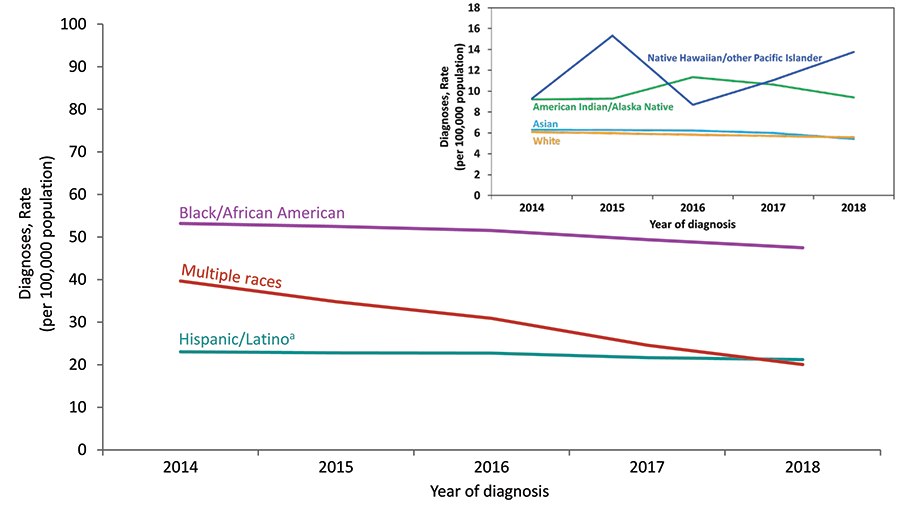
Note: See Data Tables, Definitions, and Acronyms for more information on race/ethnicity.
a Hispanics/Latinos can be of any race.
From 2014 through 2018 in the United States, the rate for Native Hawaiians/other Pacific Islanders increased (Figure 4). The rates for Asians, blacks/African Americans, Hispanics/Latinos, whites, and persons of multiple races decreased. The rate for American Indians/Alaska Natives remained stable. In 2018, the highest rate was 39.2 for blacks/African Americans, followed by 16.4 for Hispanics/Latinos, 13.3 for persons of multiple races, 11.3 for Native Hawaiians/other Pacific Islanders, 7.7 for American Indians/Alaska Natives, 4.8 for whites, and 4.7 for Asians (Table 1a).
Figure 5. Percentages of Diagnoses of HIV Infection among Adults and Adolescents, by Transmission Category, 2014–2018—United States and 6 Dependent Areas
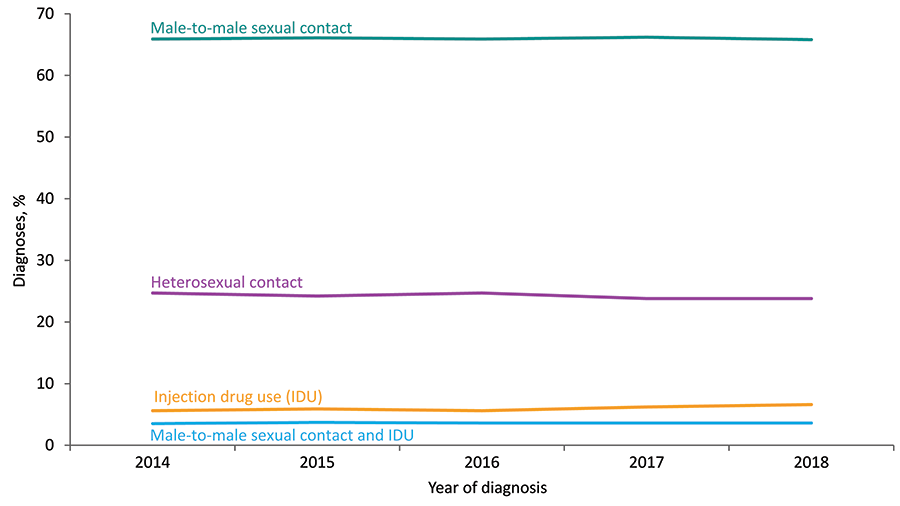
Note: Data have been statistically adjusted to account for missing transmission category. See Data Tables, Definitions, and Acronyms for more information on transmission categories.
From 2014 through 2018 in the United States and 6 dependent areas, the annual percentage of diagnoses of HIV infection among adults and adolescents attributed to male-to-male sexual contact accounted for over 65% of diagnoses (Figure 5 and Table 1b).
From 2014 through 2018 in the United States and 6 dependent areas, among male adults and adolescents, the annual number of diagnosed HIV infections attributed to injection drug use increased (Table 1b). The number of infections attributed to male-to-male sexual contact and heterosexual contact decreased. The number of infections attributed to male-to-male sexual contact and IDU remained stable. The perinatal and “Other” transmission categories accounted for less than 1% of cases. Among female adults and adolescents, the number of infections attributed to IDU increased. The number of infections attributed to heterosexual contact decreased. The perinatal and “Other” transmission categories accounted for less than 1% of cases. In 2018, among all adults and adolescents, the diagnoses of HIV infections attributed to male-to-male sexual contact (approximately 70%, including 4% male-to-male sexual contact and IDU) and those attributed to heterosexual contact (24%) accounted for approximately 94% of diagnoses in the United States (Figure 6).
Figure 6. Percentages of Diagnoses of HIV Infection among Adults and Adolescents, by Transmission Category, 2018—United States and 6 Dependent Areas
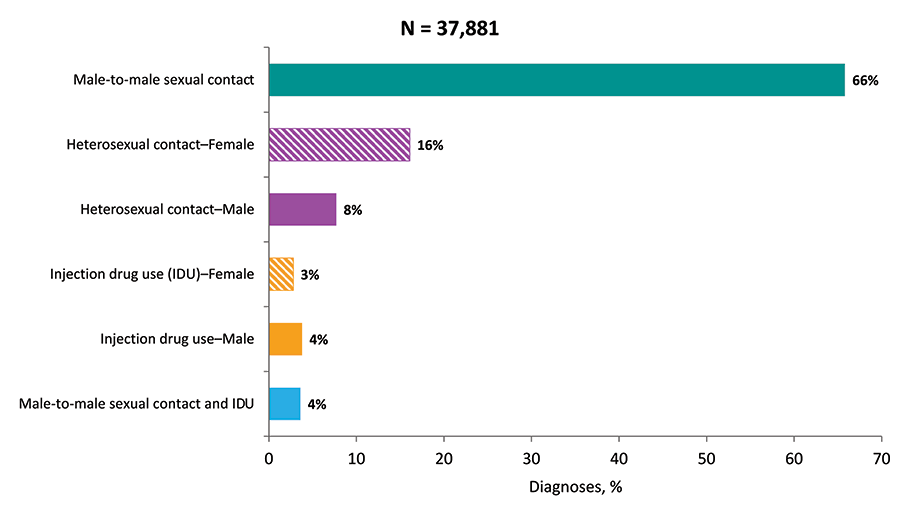
Note: Data have been statistically adjusted to account for missing transmission category. Total N includes perinatal and other transmissions among adults and adolescents. See Data Tables, Definitions, and Acronyms for more information on transmission categories.
| 2014 | 2015 | 2016 | 2017 | 2018 | ||||||
|---|---|---|---|---|---|---|---|---|---|---|
| No. | Ratea | No. | Ratea | No. | Ratea | No. | Ratea | No. | Ratea | |
| Gender | ||||||||||
| Male | 31,972 | — | 31,948 | — | 31,523 | — | 30,535 | — | 29,794 | — |
| Female | 7,657 | — | 7,416 | — | 7,526 | — | 7,326 | — | 7,109 | — |
| Transgender male-to-femaleb | 523 | — | 555 | — | 617 | — | 549 | — | 553 | — |
| Transgender female-to-maleb | 27 | — | 30 | — | 20 | — | 33 | — | 47 | — |
| Additional gender identityc | 8 | — | 10 | — | 12 | — | 13 | — | 12 | — |
| Age at diagnosis (yr) | ||||||||||
| <13 | 182 | 0.3 | 142 | 0.3 | 129 | 0.2 | 105 | 0.2 | 87 | 0.2 |
| 13–14 | 33 | 0.4 | 26 | 0.3 | 26 | 0.3 | 27 | 0.3 | 20 | 0.2 |
| 15–19 | 1,742 | 8.3 | 1,758 | 8.3 | 1,715 | 8.1 | 1,767 | 8.4 | 1,704 | 8.1 |
| 20–24 | 7,372 | 32.2 | 7,286 | 32.1 | 6,920 | 31.0 | 6,479 | 29.4 | 6,093 | 27.9 |
| 25–29 | 7,206 | 32.8 | 7,594 | 33.9 | 7,962 | 34.7 | 7,727 | 33.1 | 7,690 | 32.6 |
| 30–34 | 5,419 | 25.2 | 5,452 | 25.2 | 5,648 | 25.9 | 5,649 | 25.7 | 5,665 | 25.6 |
| 35–39 | 4,227 | 21.3 | 4,255 | 20.9 | 4,231 | 20.4 | 4,283 | 20.2 | 4,215 | 19.5 |
| 40–44 | 3,779 | 18.4 | 3,406 | 16.9 | 3,266 | 16.6 | 2,984 | 15.2 | 2,981 | 15.1 |
| 45–49 | 3,619 | 17.4 | 3,310 | 15.9 | 3,097 | 14.8 | 2,952 | 14.1 | 2,818 | 13.6 |
| 50–54 | 2,885 | 12.8 | 2,998 | 13.5 | 2,875 | 13.2 | 2,652 | 12.4 | 2,476 | 11.9 |
| 55–59 | 1,923 | 9.0 | 1,883 | 8.7 | 1,894 | 8.6 | 1,877 | 8.5 | 1,849 | 8.4 |
| 60–64 | 969 | 5.2 | 999 | 5.3 | 1,081 | 5.6 | 1,083 | 5.4 | 1,039 | 5.1 |
| ≥65 | 831 | 1.8 | 850 | 1.8 | 854 | 1.7 | 871 | 1.7 | 878 | 1.7 |
| Race/ethnicity | ||||||||||
| American Indian/Alaska Native | 178 | 7.6 | 180 | 7.6 | 220 | 9.2 | 208 | 8.7 | 186 | 7.7 |
| Asian | 904 | 5.4 | 930 | 5.4 | 953 | 5.4 | 943 | 5.2 | 876 | 4.7 |
| Black/African American | 17,286 | 43.8 | 17,229 | 43.2 | 17,090 | 42.5 | 16,518 | 40.7 | 16,047 | 39.2 |
| Hispanic/Latinod | 9,690 | 17.6 | 9,811 | 17.4 | 10,036 | 17.4 | 9,789 | 16.7 | 9,820 | 16.4 |
| Native Hawaiian/Other Pacific Islander | 42 | 7.7 | 69 | 12.4 | 40 | 7.1 | 53 | 9.2 | 66 | 11.3 |
| White | 10,449 | 5.3 | 10,252 | 5.2 | 9,995 | 5.1 | 9,820 | 5.0 | 9,572 | 4.8 |
| Multiple races | 1,638 | 25.7 | 1,488 | 22.7 | 1,364 | 20.2 | 1,125 | 16.2 | 948 | 13.3 |
| Transmission categorye | ||||||||||
| Male adult or adolescentf | ||||||||||
| Male-to-male sexual contact | 26,467 | — | 26,394 | — | 26,134 | — | 25,455 | — | 24,669 | — |
| Injection drug use | 1,242 | — | 1,283 | — | 1,207 | — | 1,308 | — | 1,408 | — |
| Male-to-male sexual contact and injection drug use | 1,428 | — | 1,467 | — | 1,451 | — | 1,383 | — | 1,361 | — |
| Heterosexual contactg | 3,253 | — | 3,259 | — | 3,267 | — | 2,871 | — | 2,845 | — |
| Perinatalh | 15 | — | 15 | — | 7 | — | 11 | — | 14 | — |
| Otheri | 19 | — | 20 | — | 18 | — | 22 | — | 21 | — |
| Subtotal | 32,425 | 25.0 | 32,437 | 24.8 | 32,085 | 24.3 | 31,050 | 23.3 | 30,318 | 22.6 |
| Female adult or adolescentf | ||||||||||
| Injection drug use | 978 | — | 1,023 | — | 1,006 | — | 1,063 | — | 1,056 | — |
| Heterosexual contactg | 6,572 | — | 6,328 | — | 6,433 | — | 6,192 | — | 6,014 | — |
| Perinatalh | 25 | — | 22 | — | 39 | — | 39 | — | 33 | — |
| Otheri | 5 | — | 6 | — | 7 | — | 7 | — | 7 | — |
| Subtotal | 7,580 | 5.6 | 7,380 | 5.4 | 7,484 | 5.4 | 7,301 | 5.2 | 7,110 | 5.1 |
| Child (<13 yrs at diagnosis) | ||||||||||
| Perinatal | 141 | — | 110 | — | 103 | — | 88 | — | 65 | — |
| Otheri | 41 | — | 32 | — | 26 | — | 17 | — | 22 | — |
| Subtotal | 182 | 0.3 | 142 | 0.3 | 129 | 0.2 | 105 | 0.2 | 87 | 0.2 |
| Region of residencej | ||||||||||
| Northeast | 6,920 | 12.4 | 6,479 | 11.6 | 6,221 | 11.1 | 5,997 | 10.7 | 5,582 | 9.9 |
| Midwest | 5,118 | 7.6 | 5,241 | 7.7 | 5,177 | 7.6 | 5,106 | 7.5 | 4,937 | 7.2 |
| South | 20,274 | 16.9 | 20,388 | 16.8 | 20,268 | 16.6 | 19,723 | 16.0 | 19,466 | 15.6 |
| West | 7,875 | 10.5 | 7,851 | 10.4 | 8,032 | 10.5 | 7,630 | 9.9 | 7,530 | 9.7 |
| Total | 40,187 | 12.6 | 39,959 | 12.5 | 39,698 | 12.3 | 38,456 | 11.8 | 37,515 | 11.5 |
Note: Numbers less than 12 should be interpreted with caution.
aRates are per 100,000 population. Rates are not calculated by gender or transmission category because of the lack of denominator data.
bTransgender male-to-female” includes individuals who were assigned “male” sex at birth but have ever identified as “female” gender. “Transgender female-to-male” includes individuals who were assigned “female” sex at birth but have ever identified as “male” gender.
cAdditional gender identity examples include “bigender,” “gender queer,” and “two-spirit.”
dHispanics/Latinos can be of any race.
eData have been statistically adjusted to account for missing transmission category, therefore values may not sum to column subtotals and total.
fData presented based on sex at birth and include transgender persons.
gHeterosexual contact with a person known to have, or to be at high risk for, HIV infection.
hIndividuals were ≥13 years of age at time of diagnosis of HIV infection.
iIncludes hemophilia, blood transfusion, and risk factor not reported or not identified.
jData are based on residence at time of diagnosis of HIV infection.
| 2014 | 2015 | 2016 | 2017 | 2018 | ||||||
|---|---|---|---|---|---|---|---|---|---|---|
| No. | Ratea | No. | Ratea | No. | Ratea | No. | Ratea | No. | Ratea | |
| Gender | ||||||||||
| Male | 32,472 | — | 32,413 | — | 31,970 | — | 30,902 | — | 30,166 | — |
| Female | 7,802 | — | 7,526 | — | 7,631 | — | 7,420 | — | 7,189 | — |
| Transgender male-to-femaleb | 527 | — | 559 | — | 619 | — | 551 | — | 554 | — |
| Transgender female-to-maleb | 27 | — | 30 | — | 20 | — | 33 | — | 47 | — |
| Additional gender identityc | 8 | — | 10 | — | 12 | — | 13 | — | 12 | — |
| Age at diagnosis (yr) | ||||||||||
| <13 | 182 | 0.3 | 142 | 0.3 | 129 | 0.2 | 105 | 0.2 | 87 | 0.2 |
| 13–14 | 33 | 0.4 | 26 | 0.3 | 26 | 0.3 | 27 | 0.3 | 20 | 0.2 |
| 15–19 | 1,766 | 8.3 | 1,765 | 8.3 | 1,727 | 8.1 | 1,780 | 8.3 | 1,719 | 8.1 |
| 20–24 | 7,488 | 32.3 | 7,367 | 32.1 | 6,994 | 30.9 | 6,543 | 29.3 | 6,152 | 27.8 |
| 25–29 | 7,300 | 32.9 | 7,689 | 33.9 | 8,033 | 34.7 | 7,792 | 33.0 | 7,768 | 32.6 |
| 30–34 | 5,482 | 25.2 | 5,512 | 25.2 | 5,714 | 25.9 | 5,712 | 25.8 | 5,723 | 25.6 |
| 35–39 | 4,299 | 21.4 | 4,325 | 21.0 | 4,303 | 20.5 | 4,336 | 20.2 | 4,250 | 19.5 |
| 40–44 | 3,855 | 18.5 | 3,470 | 17.0 | 3,322 | 16.7 | 3,021 | 15.2 | 3,025 | 15.2 |
| 45–49 | 3,678 | 17.4 | 3,376 | 16.1 | 3,156 | 14.9 | 2,994 | 14.2 | 2,861 | 13.6 |
| 50–54 | 2,931 | 12.9 | 3,056 | 13.6 | 2,920 | 13.2 | 2,703 | 12.5 | 2,528 | 12.0 |
| 55–59 | 1,968 | 9.1 | 1,915 | 8.7 | 1,944 | 8.8 | 1,911 | 8.6 | 1,877 | 8.5 |
| 60–64 | 996 | 5.3 | 1,014 | 5.3 | 1,106 | 5.6 | 1,103 | 5.5 | 1,058 | 5.1 |
| ≥65 | 858 | 1.8 | 881 | 1.8 | 878 | 1.8 | 892 | 1.7 | 900 | 1.7 |
| Race/ethnicity | ||||||||||
| American Indian/Alaska Native | 178 | — | 180 | — | 220 | — | 208 | — | 186 | — |
| Asian | 906 | — | 934 | — | 954 | — | 946 | — | 880 | — |
| Black/African American | 17,303 | — | 17,238 | — | 17,096 | — | 16,522 | — | 16,055 | — |
| Hispanic/Latinod | 10,310 | — | 10,371 | — | 10,575 | — | 10,238 | — | 10,255 | — |
| Native Hawaiian/other Pacific Islander | 45 | — | 72 | — | 46 | — | 56 | — | 68 | — |
| White | 10,455 | — | 10,254 | — | 9,997 | — | 9,823 | — | 9,575 | — |
| Multiple races | 1,639 | — | 1,489 | — | 1,364 | — | 1,126 | — | 949 | — |
| Transmission categorye | ||||||||||
| Male adult or adolescentf | ||||||||||
| Male-to-male sexual contact | 26,801 | — | 26,704 | — | 26,430 | — | 25,693 | — | 24,933 | — |
| Injection drug use | 1,302 | — | 1,334 | — | 1,247 | — | 1,342 | — | 1,434 | — |
| Male-to-male sexual contact and injection drug use |
1,436 | — | 1,488 | — | 1,462 | — | 1,395 | — | 1,372 | — |
| Heterosexual contactg | 3,355 | — | 3,344 | — | 3,370 | — | 2,956 | — | 2,916 | — |
| Perinatalh | 15 | — | 15 | — | 7 | — | 11 | — | 14 | — |
| Otheri | 19 | — | 20 | — | 18 | — | 22 | — | 21 | — |
| Subtotal | 32,929 | 25.1 | 32,906 | 24.8 | 32,534 | 24.3 | 31,419 | 23.3 | 30,691 | 22.6 |
| Female adult or adolescentf | ||||||||||
| Injection drug use | 992 | — | 1,031 | — | 1,016 | — | 1,072 | — | 1,058 | — |
| Heterosexual contactg | 6,702 | — | 6,430 | — | 6,528 | — | 6,276 | — | 6,092 | — |
| Perinatalh | 25 | — | 23 | — | 39 | — | 40 | — | 33 | — |
| Otheri | 5 | — | 6 | — | 7 | — | 7 | — | 7 | — |
| Subtotal | 7,725 | 5.6 | 7,490 | 5.4 | 7,589 | 5.4 | 7,395 | 5.2 | 7,190 | 5.1 |
| Child (<13 yrs at diagnosis) | ||||||||||
| Perinatal | 141 | — | 110 | — | 103 | — | 88 | — | 65 | — |
| Otheri | 41 | — | 32 | — | 26 | — | 17 | — | 22 | — |
| Subtotal | 182 | 0.3 | 142 | 0.3 | 129 | 0.2 | 105 | 0.2 | 87 | 0.2 |
| Region of residencej | ||||||||||
| Northeast | 6,920 | 12.4 | 6,479 | 11.6 | 6,221 | 11.1 | 5,997 | 10.7 | 5,582 | 9.9 |
| Midwest | 5,118 | 7.6 | 5,241 | 7.7 | 5,177 | 7.6 | 5,106 | 7.5 | 4,937 | 7.2 |
| South | 20,274 | 16.9 | 20,388 | 16.8 | 20,268 | 16.6 | 19,723 | 16.0 | 19,466 | 15.6 |
| West | 7,875 | 10.5 | 7,851 | 10.4 | 8,032 | 10.5 | 7,630 | 9.9 | 7,530 | 9.7 |
| U.S. dependent areas | 649 | 16.5 | 579 | 14.9 | 554 | 14.6 | 463 | 12.4 | 453 | 12.6 |
| Total | 40,836 | 12.7 | 40,538 | 12.5 | 40,252 | 12.3 | 38,919 | 11.8 | 37,968 | 11.5 |
Note: Numbers less than 12 should be interpreted with caution.
aRates are per 100,000 population. Rates are not calculated by gender or transmission category because of the lack of denominator data. Rates by race/ethnicity are not provided because U.S. census information is limited for U.S. dependent areas.
b“Transgender male-to-female” includes individuals who were assigned “male” sex at birth but have ever identified as “female” gender. “Transgender female-to-male” includes individuals who were assigned “female” sex at birth but have ever identified as “male” gender.
cAdditional gender identity examples include “bigender,” “gender queer,” and “two-spirit.”
dHispanics/Latinos can be of any race.
eData have been statistically adjusted to account for missing transmission category, therefore values may not sum to column subtotals and total.
fData presented based on sex at birth and include transgender persons.
gHeterosexual contact with a person known to have, or to be at high risk for, HIV infection.
hIndividuals were ≥13 years of age at time of diagnosis of HIV infection.
iIncludes hemophilia, blood transfusion, and risk factor not reported or not identified.
jData are based on residence at time of diagnosis of HIV infection.
Gender identity refers to a person’s internal understanding of their own gender, or gender with which a person identifies. HIV surveillance personnel collect data on gender identity, when available, from sources such as case report forms submitted by health care or HIV testing providers and medical records, or by matching with other health department databases (e.g., Ryan White program data). In May 2013, CDC issued guidance to state and local programs on methods for collecting data on transgender persons and working with transgender-specific data. However, characterization of HIV infection among transgender persons may require supplemental data from special studies. A person’s transgender status in NHSS is determined based on two variables – sex assigned at birth and current gender identity. Both variables are examined, using a two-step approach, to assess transgender status. Although not used in this report, cisgender is a term used to indicate that a person’s sex assigned at birth and current gender identity are the same (i.e., a person assigned male at birth and who currently identifies as a man, is a cisgender male).
Categories
- Male: persons assigned “male” sex at birth and current gender identity is not “transgender male-to-female” or “additional gender identity” (current gender identity can be listed as “male,” “female,” “transgender female-to-male,” “unspecified,” or left blank).
- Female: persons assigned “female” sex at birth and current gender identity is not “transgender female-to-male” or “additional gender identity” (current gender identity can be listed as “male,” “female,” “transgender male-to-female,” “unspecified,” or left blank).
- Transgender male-to-female (transgender MTF): persons assigned “male” sex at birth and current gender identity is “transgender male-to-female.”
- Transgender female-to-male (transgender FTM): persons assigned “female” sex at birth and current gender identity is “transgender female-to-male.”
- Additional gender identity (AGI): persons assigned “male” or “female” sex at birth and current gender identity is “additional gender identity.” AGI includes “bigender,” “gender queer,” and “two-spirit.”
In the Federal Register [6] for October 30, 1997, the Office of Management and Budget (OMB) announced the Revisions to the Standards for the Classification of Federal Data on Race and Ethnicity. Implementation by January 1, 2003 was mandated. At a minimum, data on the following race categories should be collected:
- American Indian or Alaska Native
- Asian
- black or African American
- Native Hawaiian or other Pacific Islander
- white
Additionally, systems must be able to retain information when multiple race categories are reported. In addition to data on race, data on 2 categories of ethnicity should be collected:
- Hispanic or Latino
- not Hispanic or Latino
The Asian or Pacific Islander category displayed in annual surveillance reports published prior to the 2007 surveillance report was split into 2 categories: (1) Asian and (2) Native Hawaiian or other Pacific Islander. The Asian category (in tables where footnoted) includes the cases in Asians/Pacific Islanders (referred to as legacy cases) that were reported before the implementation of the new race categories in 2003 (e.g., cases of HIV infection that were diagnosed and reported to CDC before 2003 but that were classified as stage 3 [AIDS] after 2003) and a small percentage of cases that were reported after 2003 but that were reported according to the old race category (Asian/ Pacific Islander). In tables of diagnoses of HIV infection during 2014–2018, the Asian category does not include Asian/Pacific Islander cases because these cases were diagnosed after 2003 and were reported to CDC in accordance with OMB’s Revisions to the Standards for the Classification of Federal Data on Race and Ethnicity [6].
This report also presents data for persons for whom multiple race categories are reported. In this report, persons categorized by race were not Hispanic or Latino. The number of persons reported in each race category may, however, include persons whose ethnicity was not reported.
Transmission category is the term for the classification of cases that summarizes an adult’s or adolescent’s possible HIV risk factors; the summary classification results from selecting, from the presumed hierarchical order of probability, the 1 (single) risk factor most likely to have been responsible for transmission. For surveillance purposes, a diagnosis of HIV infection is counted only once in the hierarchy of transmission categories [7]. Adults or adolescents with more than 1 reported risk factor for HIV infection are classified in the transmission category listed first in the hierarchy. The exception is men who had sexual contact with other men and injected drugs; this group makes up a separate transmission category.
Hierarchical Categories:
- Male-to-male sexual contact: men who have had sexual contact with men (i.e., homosexual contact) and men who have had sexual contact with both men and women (i.e., bisexual contact)
- Injection drug use (IDU): persons who have injected non-prescription drugs
- Male-to-male sexual contact and injection drug use (male-to-male sexual contact and IDU): men who have had sexual contact with other men and injected non-prescription drugs
- Heterosexual contact: persons who have ever had heterosexual contact with a person known to have, or to be at high risk for, HIV infection
- Perinatal: persons infected through perinatal transmission but aged 13 years and older at time of diagnosis of HIV infection. Prevalence data and tables of death data includes persons infected through perinatal transmission but aged 13 years and older during the specified year or at death.
- Other: all other transmission categories (e.g., blood transfusion, hemophilia, risk factor not reported or not identified).
Cases of HIV infection reported without a risk factor listed in the hierarchy of transmission categories are classified as “no identified risk (NIR).” Cases classified as NIR include cases that are being followed up by local health department staff; cases in persons whose risk-factor information is missing because they died, declined to be interviewed, or were lost to follow-up; and cases in persons who were interviewed or for whom other follow-up information was available but for whom no risk factor was identified.
Because a substantial proportion of cases of HIV infection are reported to CDC without an identified risk factor, multiple imputation is used to assign a transmission category to these cases [7]. Multiple imputation is a statistical approach in which each missing transmission category is replaced with a set of plausible values that represent the uncertainty about the true, but missing, value [8]. Each resulting data set containing the plausible values is analyzed by using standard procedures, and the results from these analyses are then combined to produce the final results. In tables displaying transmission categories, multiple imputation was used for adults and adolescents, but not for children (because the number of cases in children is small, missing transmission categories were not imputed).
AGI: additional gender identity
AIDS: acquired immunodeficiency syndrome
CDC: Centers for Disease Control and Prevention
FTM: female-to-male
HIV: human immunodeficiency virus
IDU: injection drug use
MSA: metropolitan statistical area
MSM: gay, bisexual, and other men who have sex with men
MTF: male-to-female
NHSS: National HIV Surveillance System
NIR: no identified risk factor
OI: opportunistic illness
OMB: Office of Management and Budget
PrEP: preexposure prophylaxis
PWID: persons who inject drugs