Fast Facts: HIV in the United States

At a glance

HIV remains a persistent problem in the United States. In the United States, estimated HIV infections decreased 12% overall from 2018 to 2022. Learn more about HIV trends in the United States.

Map showing the outline of the United States.

Fast facts

HIV affects some groups more than others. Social and structural issues—such as HIV stigma, homophobia, discrimination, poverty, and limited access to high-quality health care—influence health outcomes and continue to drive inequities.

HIV incidence

HIV incidence refers to the estimated number of new HIV infections in a given year.
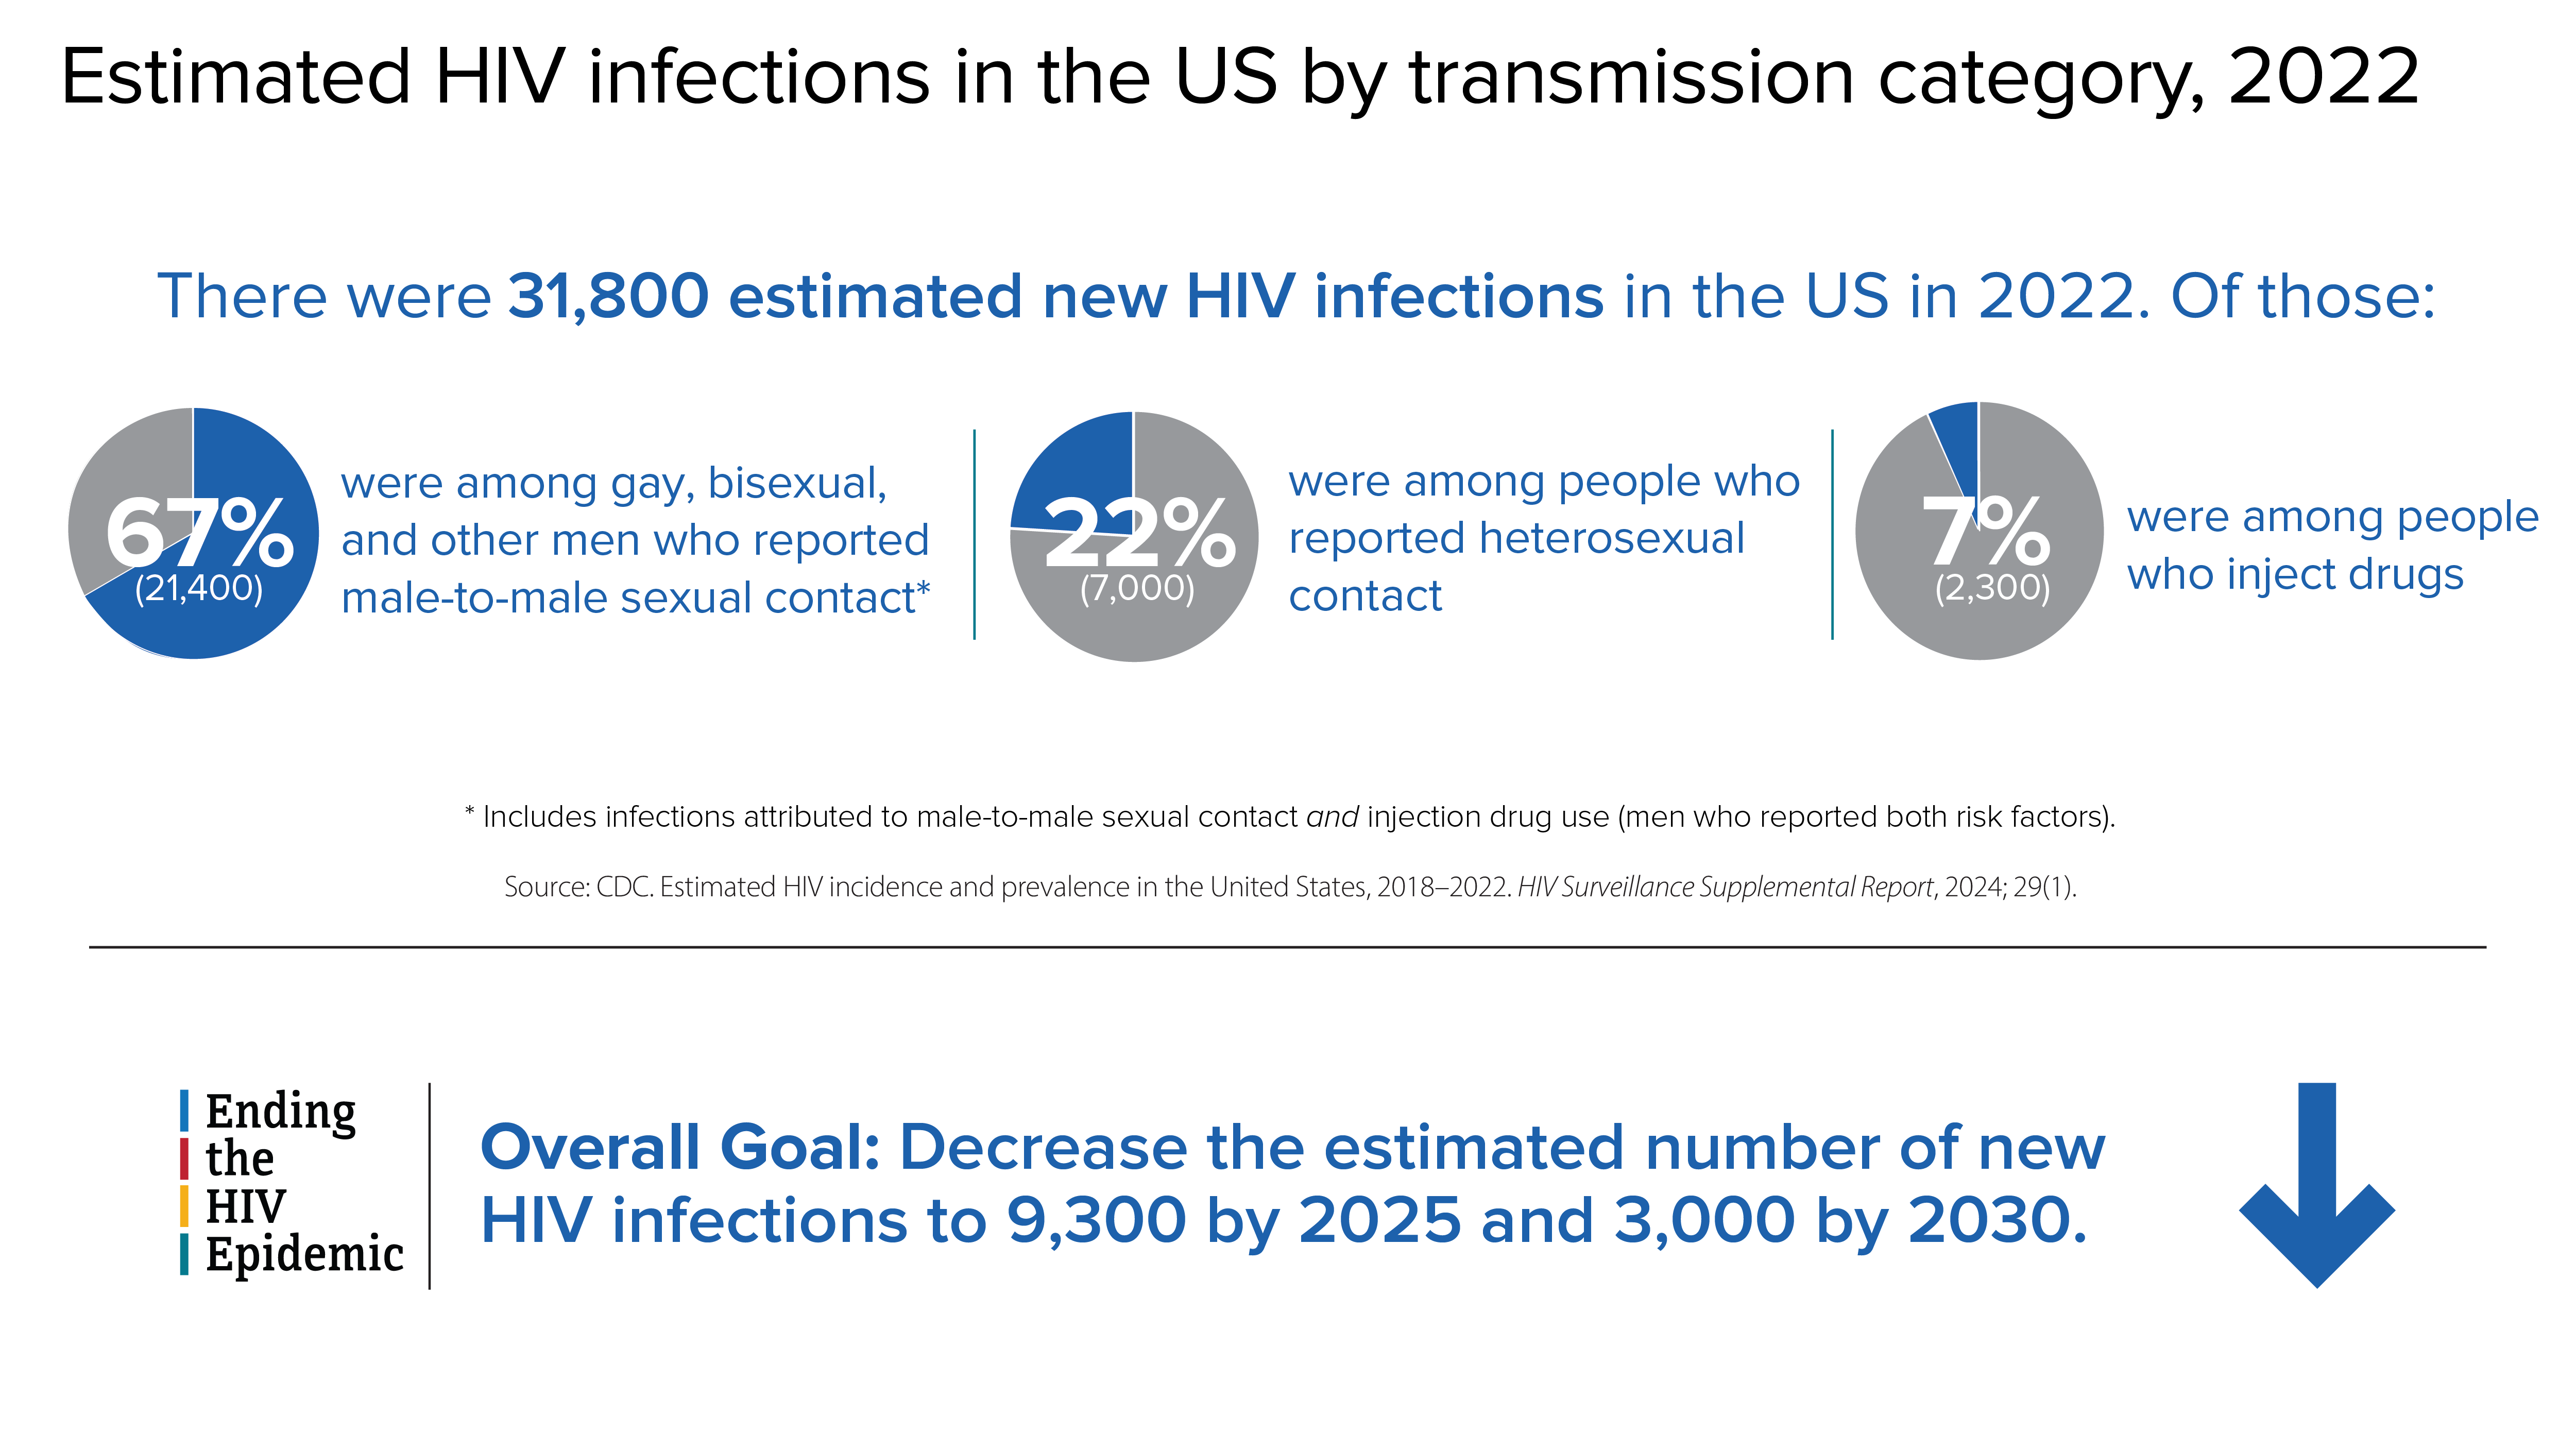
There were 31,800 estimated new HIV infections in the US in 2022. Of those, 67% were among gay, bisexual, and other men who reported male-to-male sexual contact; 22% were among people who reported heterosexual contact; and 7% were among people who inject drugs.
Estimated HIV infections in the US by transmission category.

HIV infections among gay, bisexual, and other men who reported male-to-male sexual contact

In 2022, gay, bisexual, and other men who reported male-to-male sexual contact accounted for 67% (21,400) of the 31,800 estimated new HIV infections and 83% of estimated infections among all men.
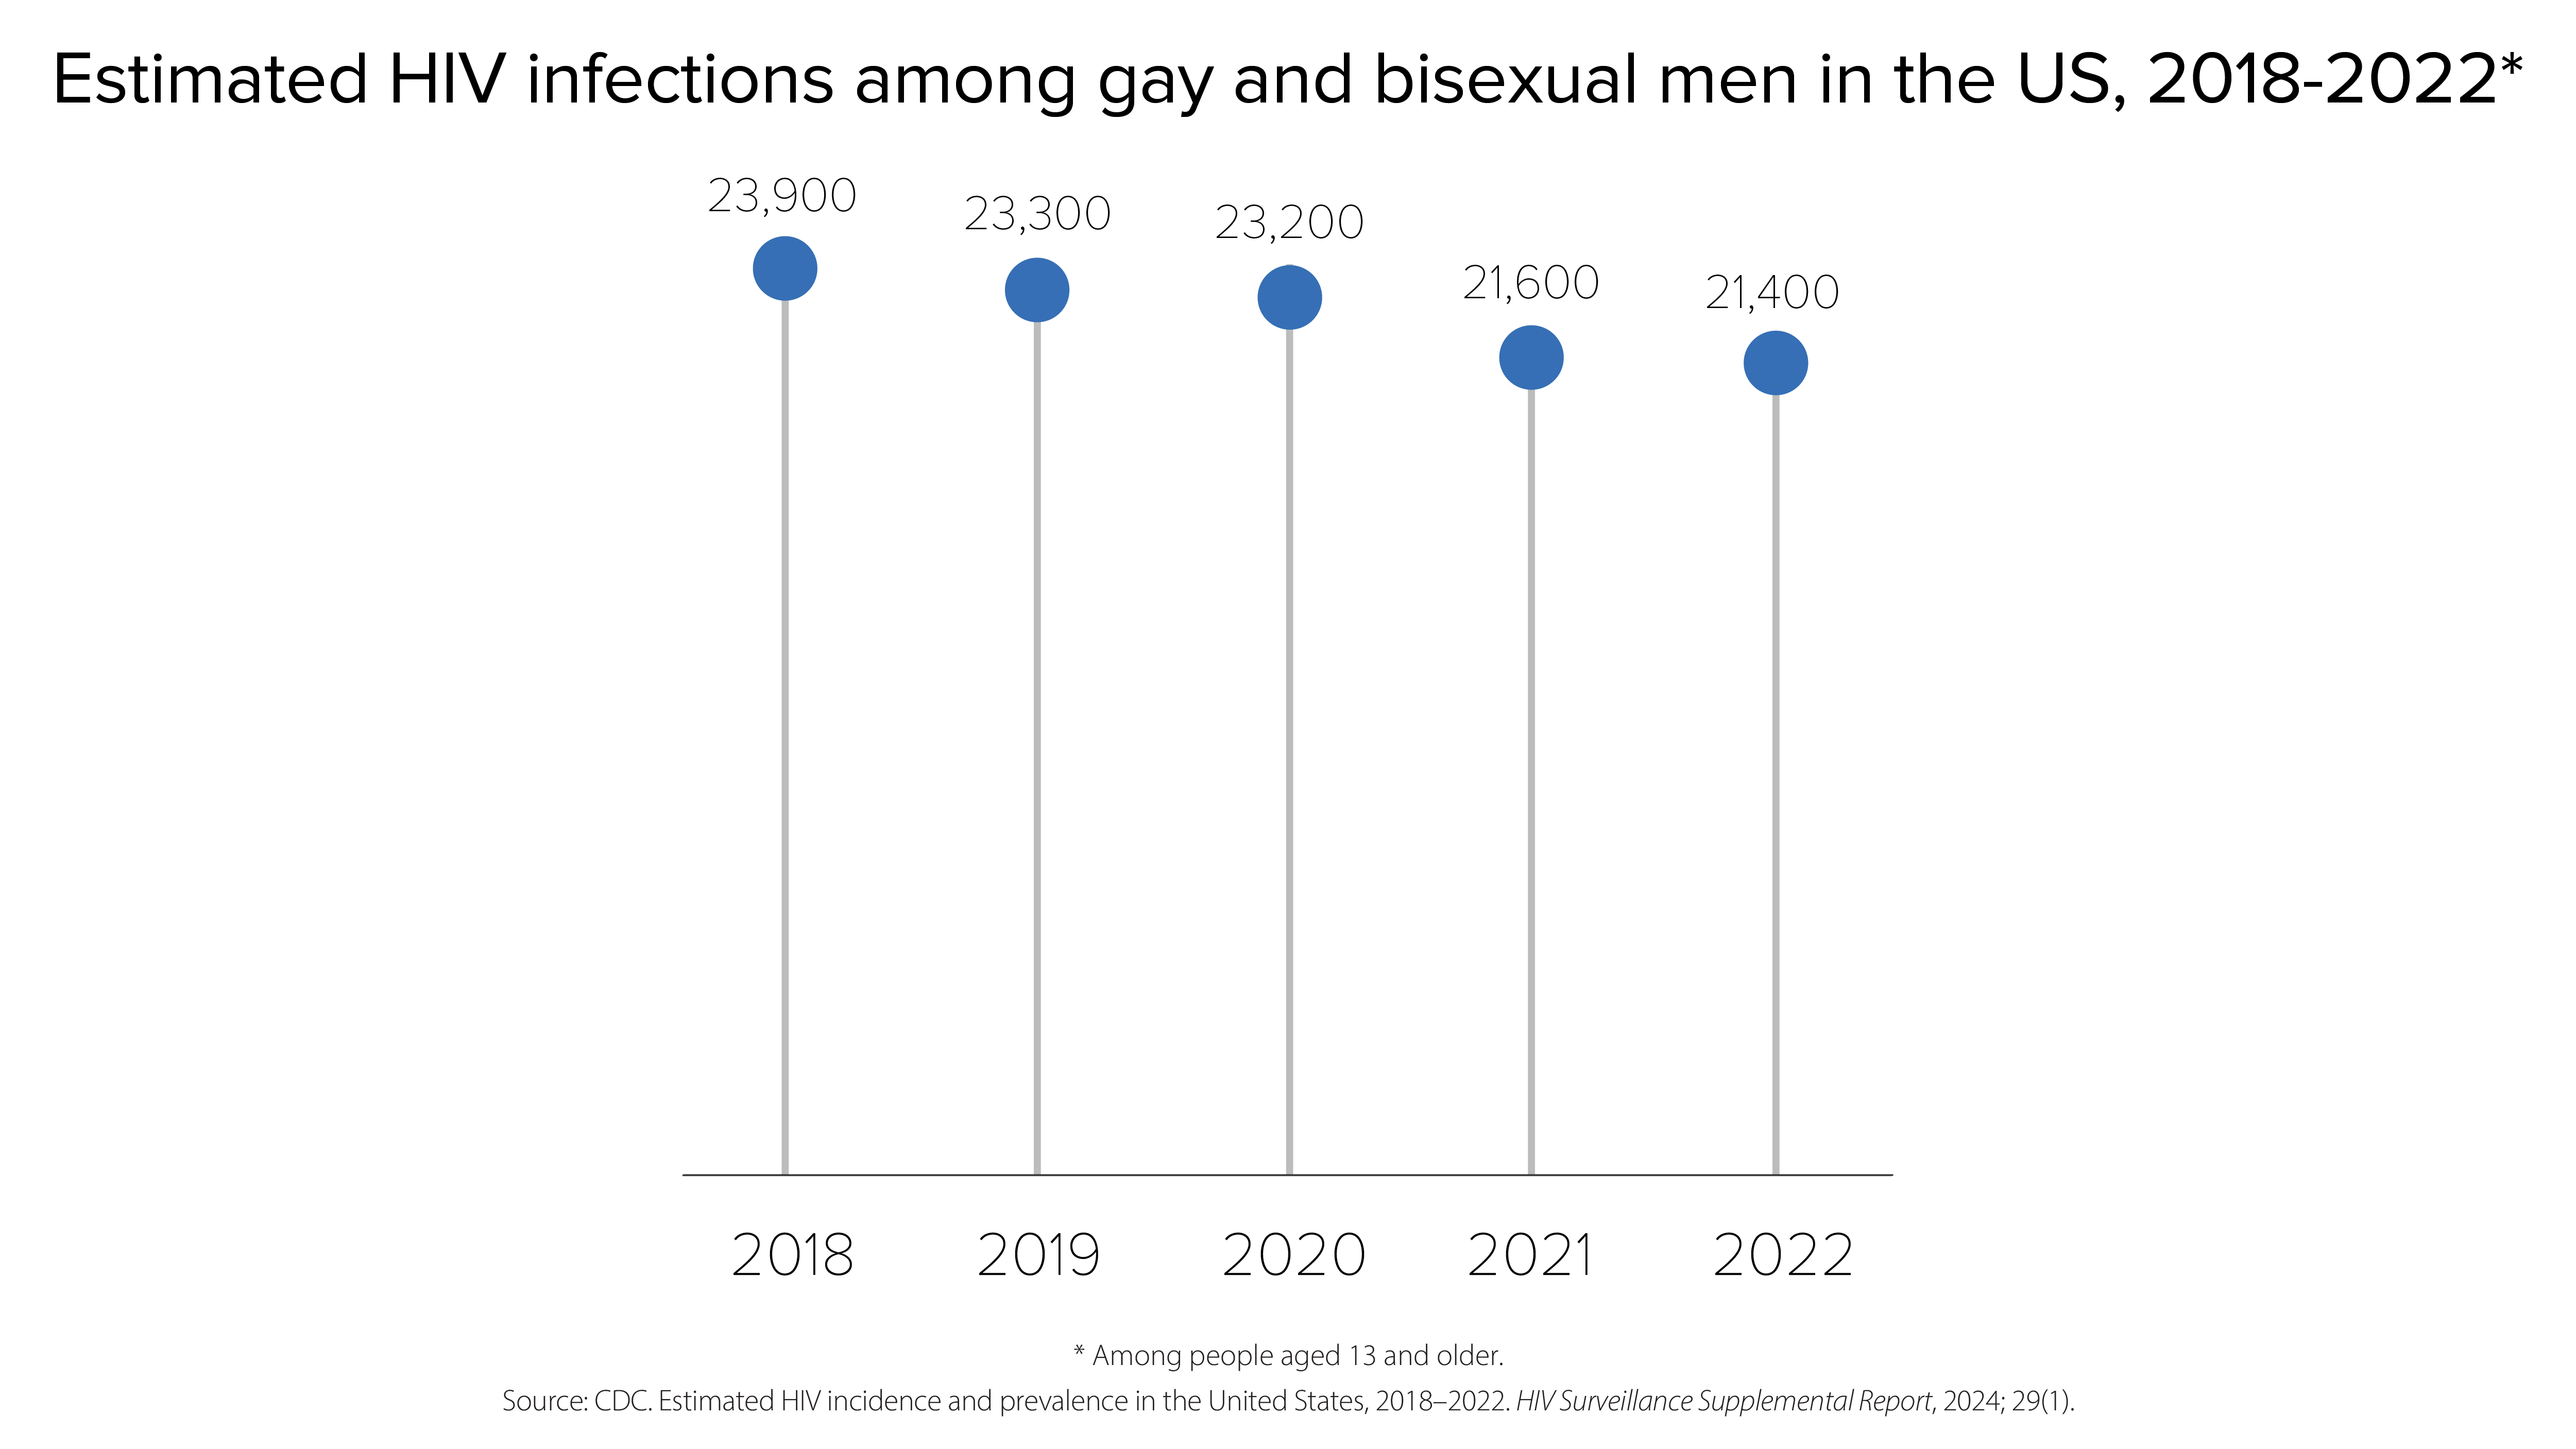
An estimated 23,900 HIV infections occurred among gay and bisexual men in 2018, followed by 23,300 in 2019, 23,200 in 2020, 21,600 in 2021, and 21,400 in 2022, respectively.
Estimated HIV infections among gay and bisexual men in the US.

HIV infections among people who reported heterosexual contact

In 2022, people reporting heterosexual contact accounted for 22% (7,000) of the 31,800 estimated new HIV infections.

  • Men reporting heterosexual contact accounted for 7% (2,100) of estimated new HIV infections.
  • Women reporting heterosexual contact accounted for 15% (4,900) of estimated new HIV infections.
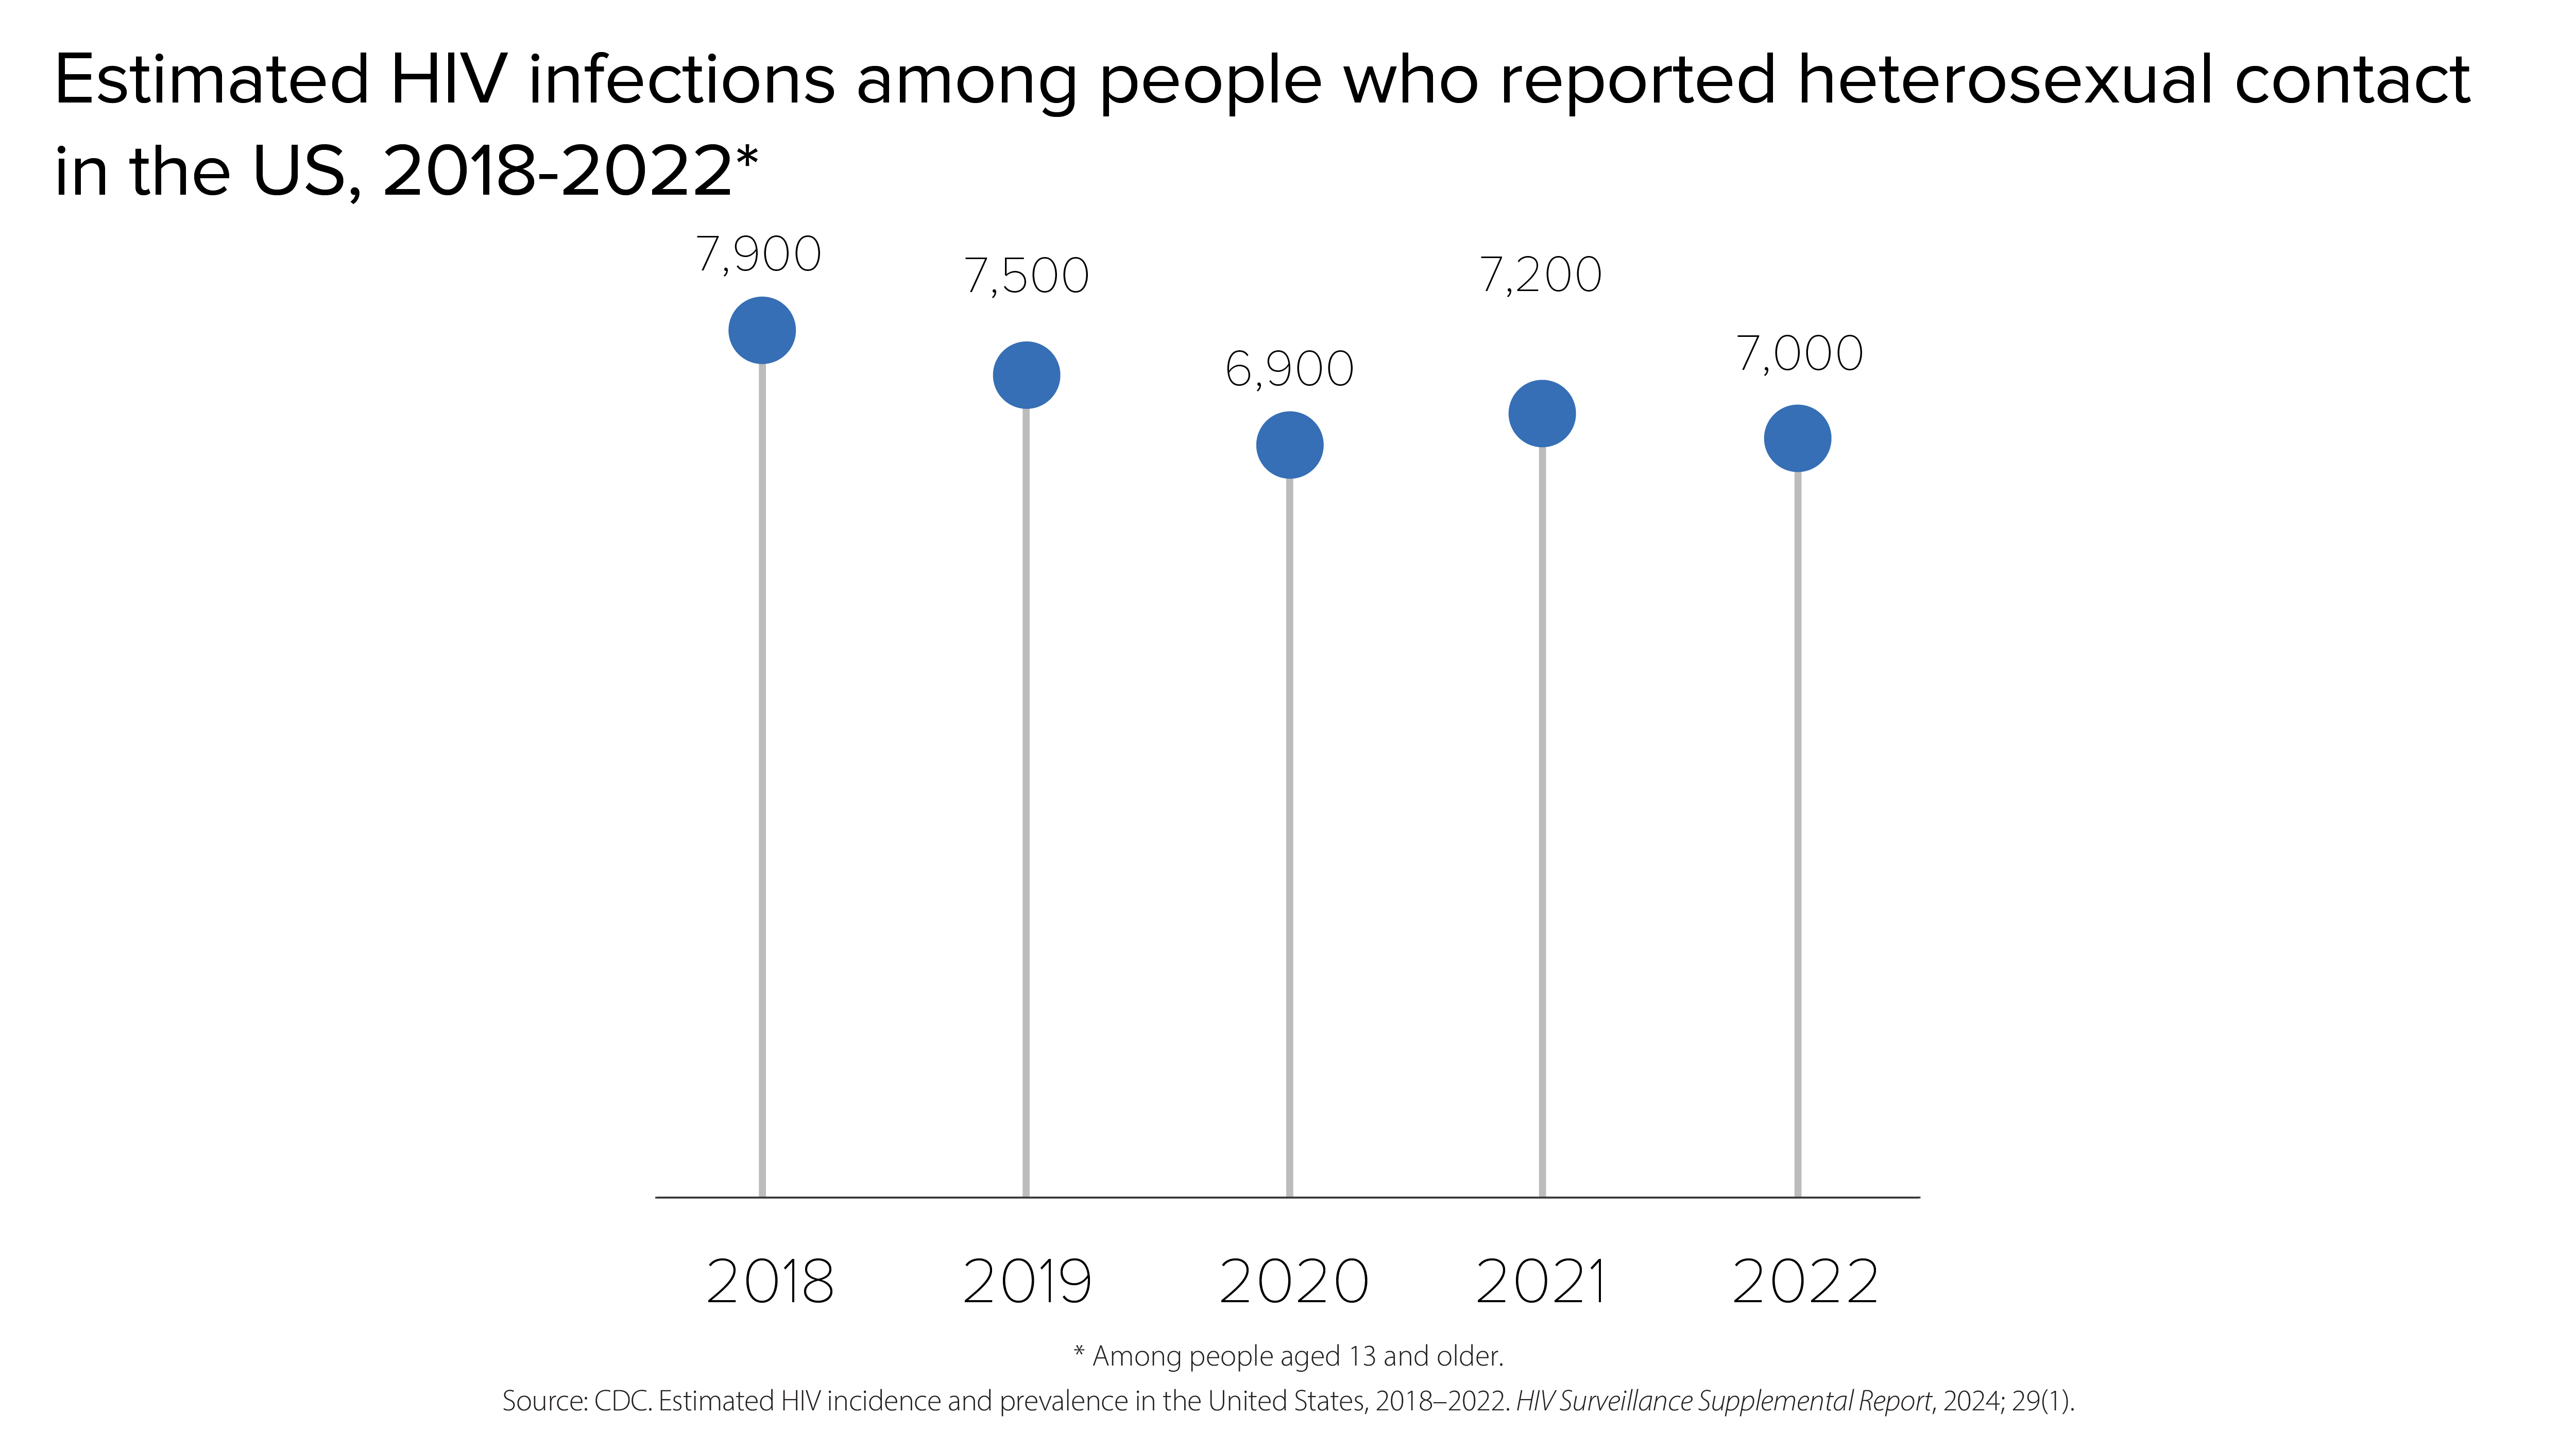
An estimated 7,900 HIV infections occurred among people who reported heterosexual contact in 2018, followed by 7,500 in 2019, 6,900 in 2020, 7,200 in 2021, and 7,000 in 2022, respectively.
Estimated HIV infections among people who reported heterosexual contact in the US.

HIV infections among people who inject drugs (PWID)

In 2022, PWID accounted for 7% (2,300) of the 31,800 estimated new HIV infections.

  • Men who inject drugs accounted for 4% (1,300) of estimated new HIV infections.
  • Women who inject drugs accounted for 3% (1,000) of estimated new HIV infections.
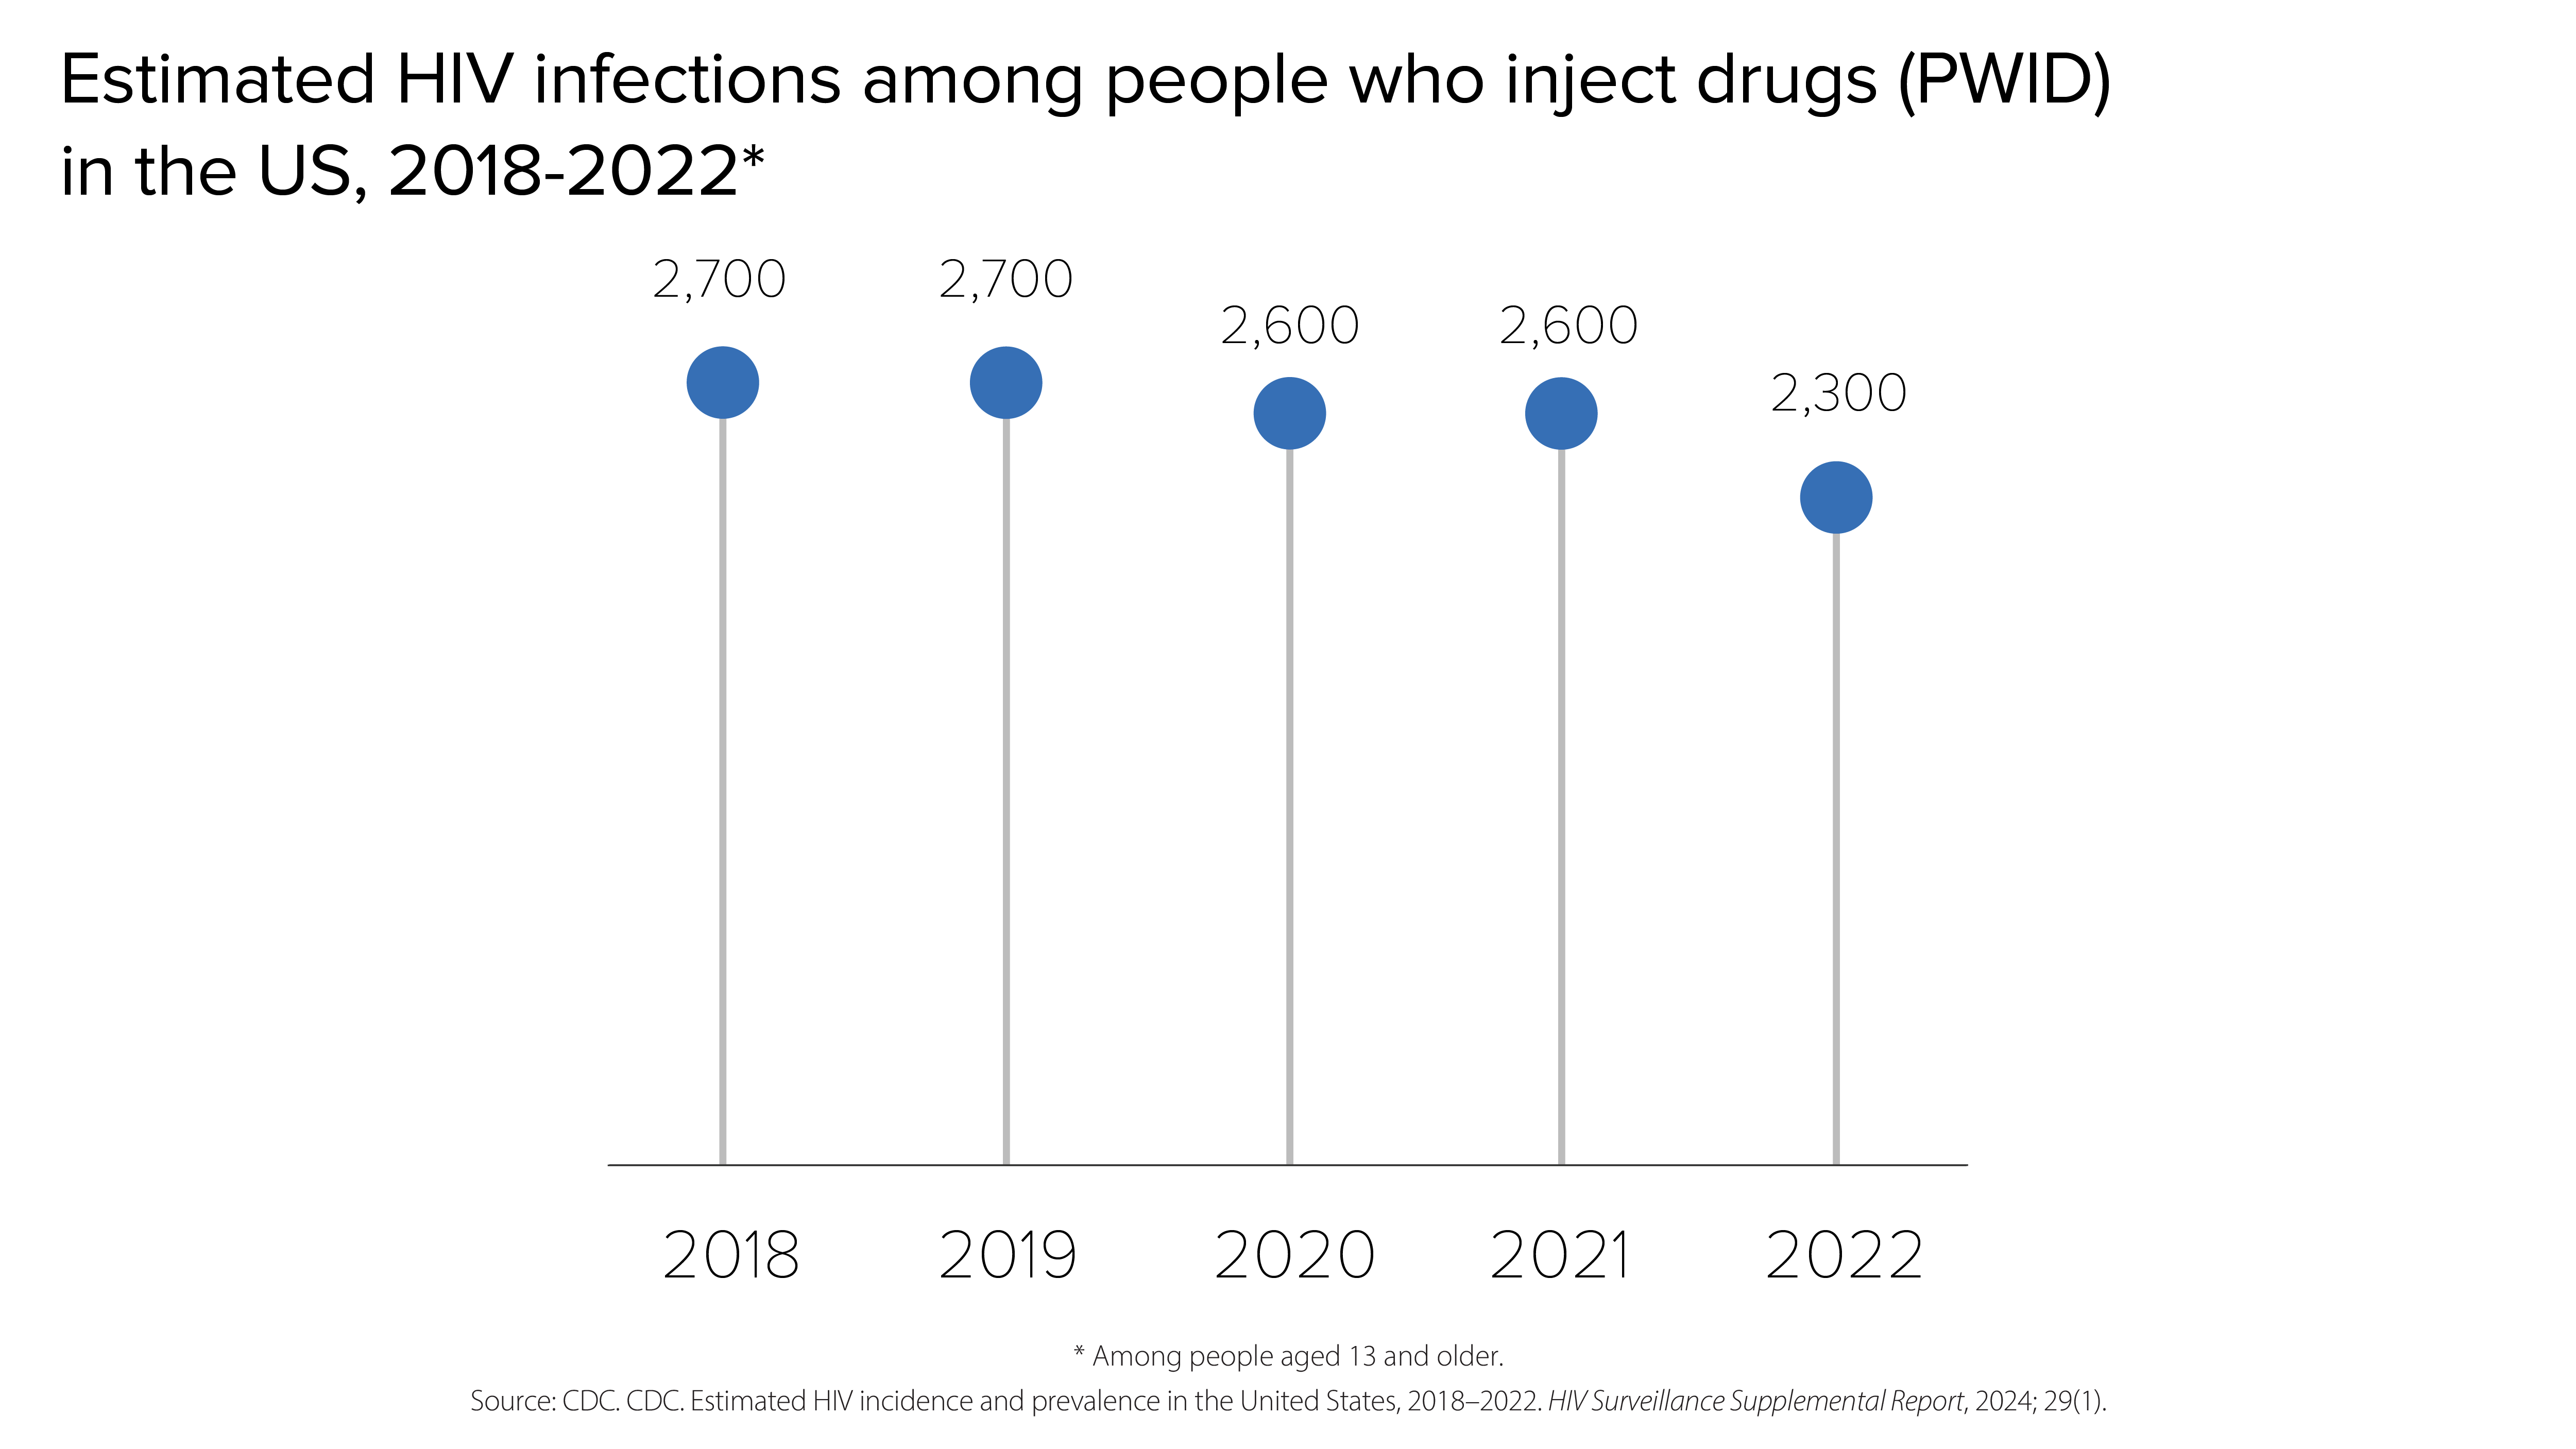
An estimated 2,700 HIV infections occurred among people who inject drugs in 2018, followed by 2,700 in 2019, 2,600 in 2020, 2,600 in 2021, and 2,300 in 2022, respectively.
Estimated HIV infections among people who inject drugs in the US.

HIV infections by region

In 2022, the South accounted for nearly half (49%) of the 31,800 estimated new HIV infections.
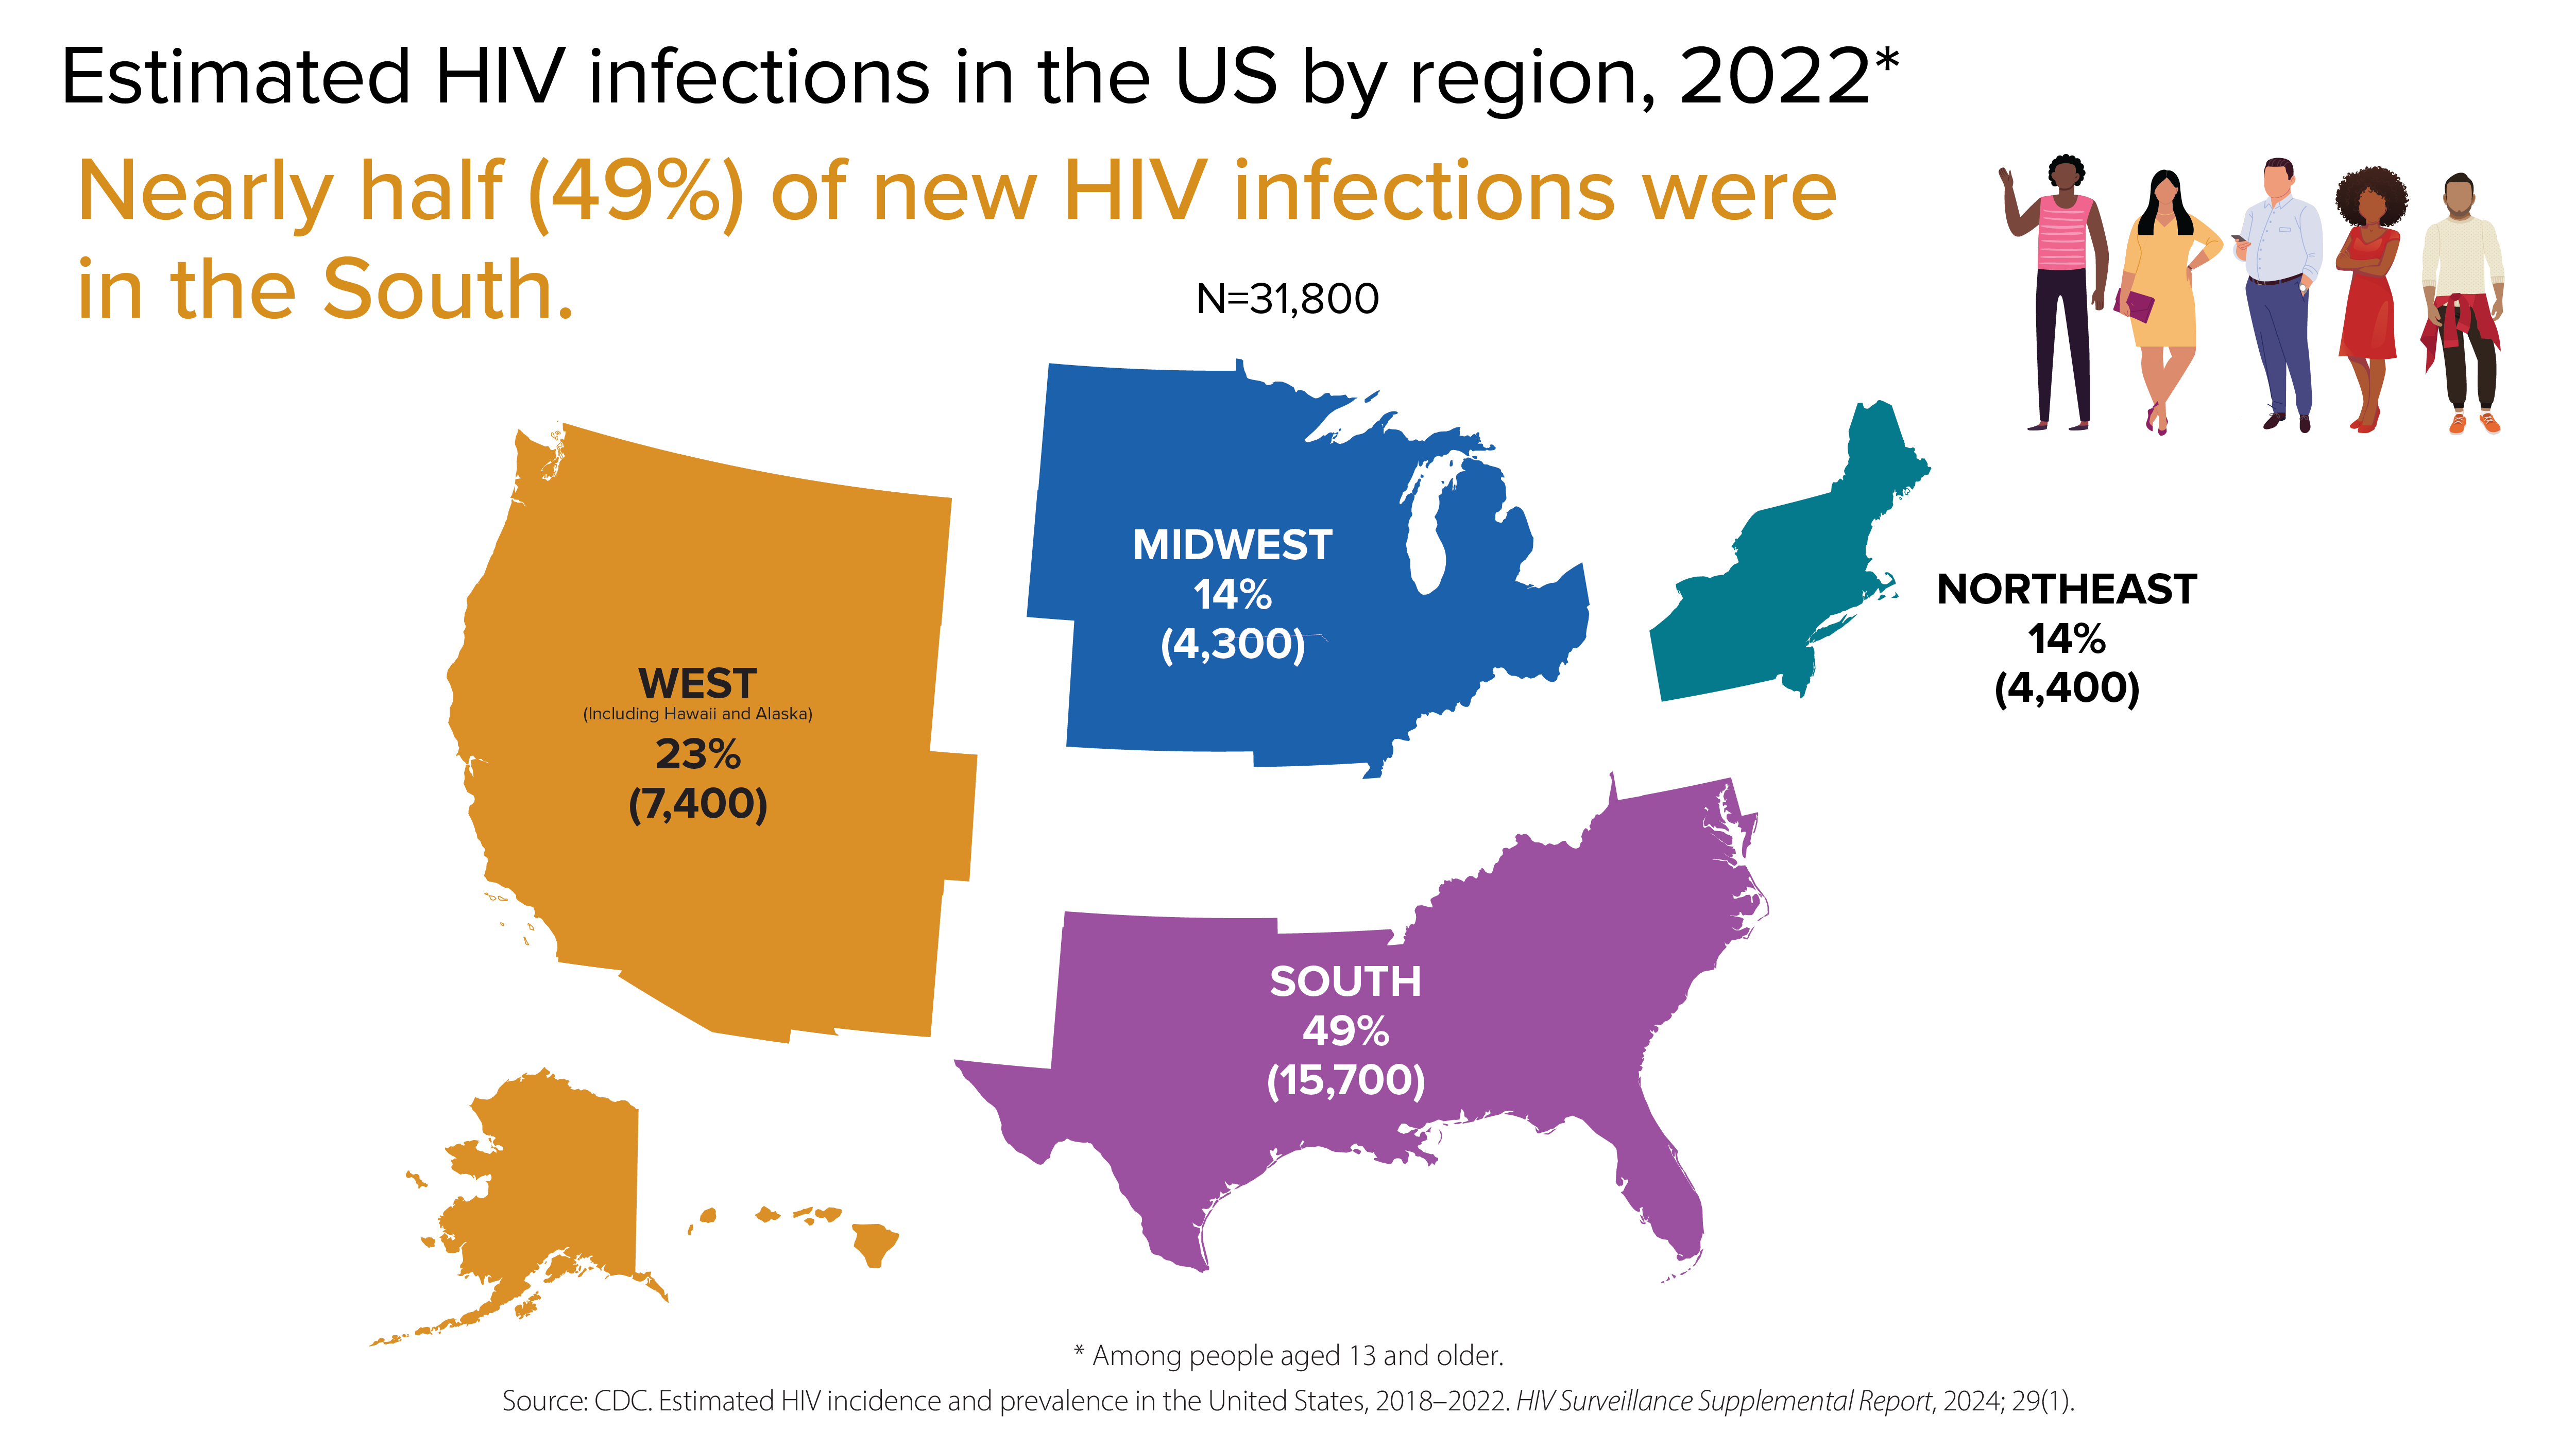
With respect to HIV infection in the US, nearly half (15,700, or 49%) of new HIV infections were in the South. Fourteen percent (4,400) were in the Northeast, fourteen percent (4,300) were in the Midwest; and twenty-three percent (7,400) were in the West.
Estimated HIV infections in the US by region.

HIV diagnoses

HIV diagnoses refers to the number of people who received an HIV diagnosis during a given year.
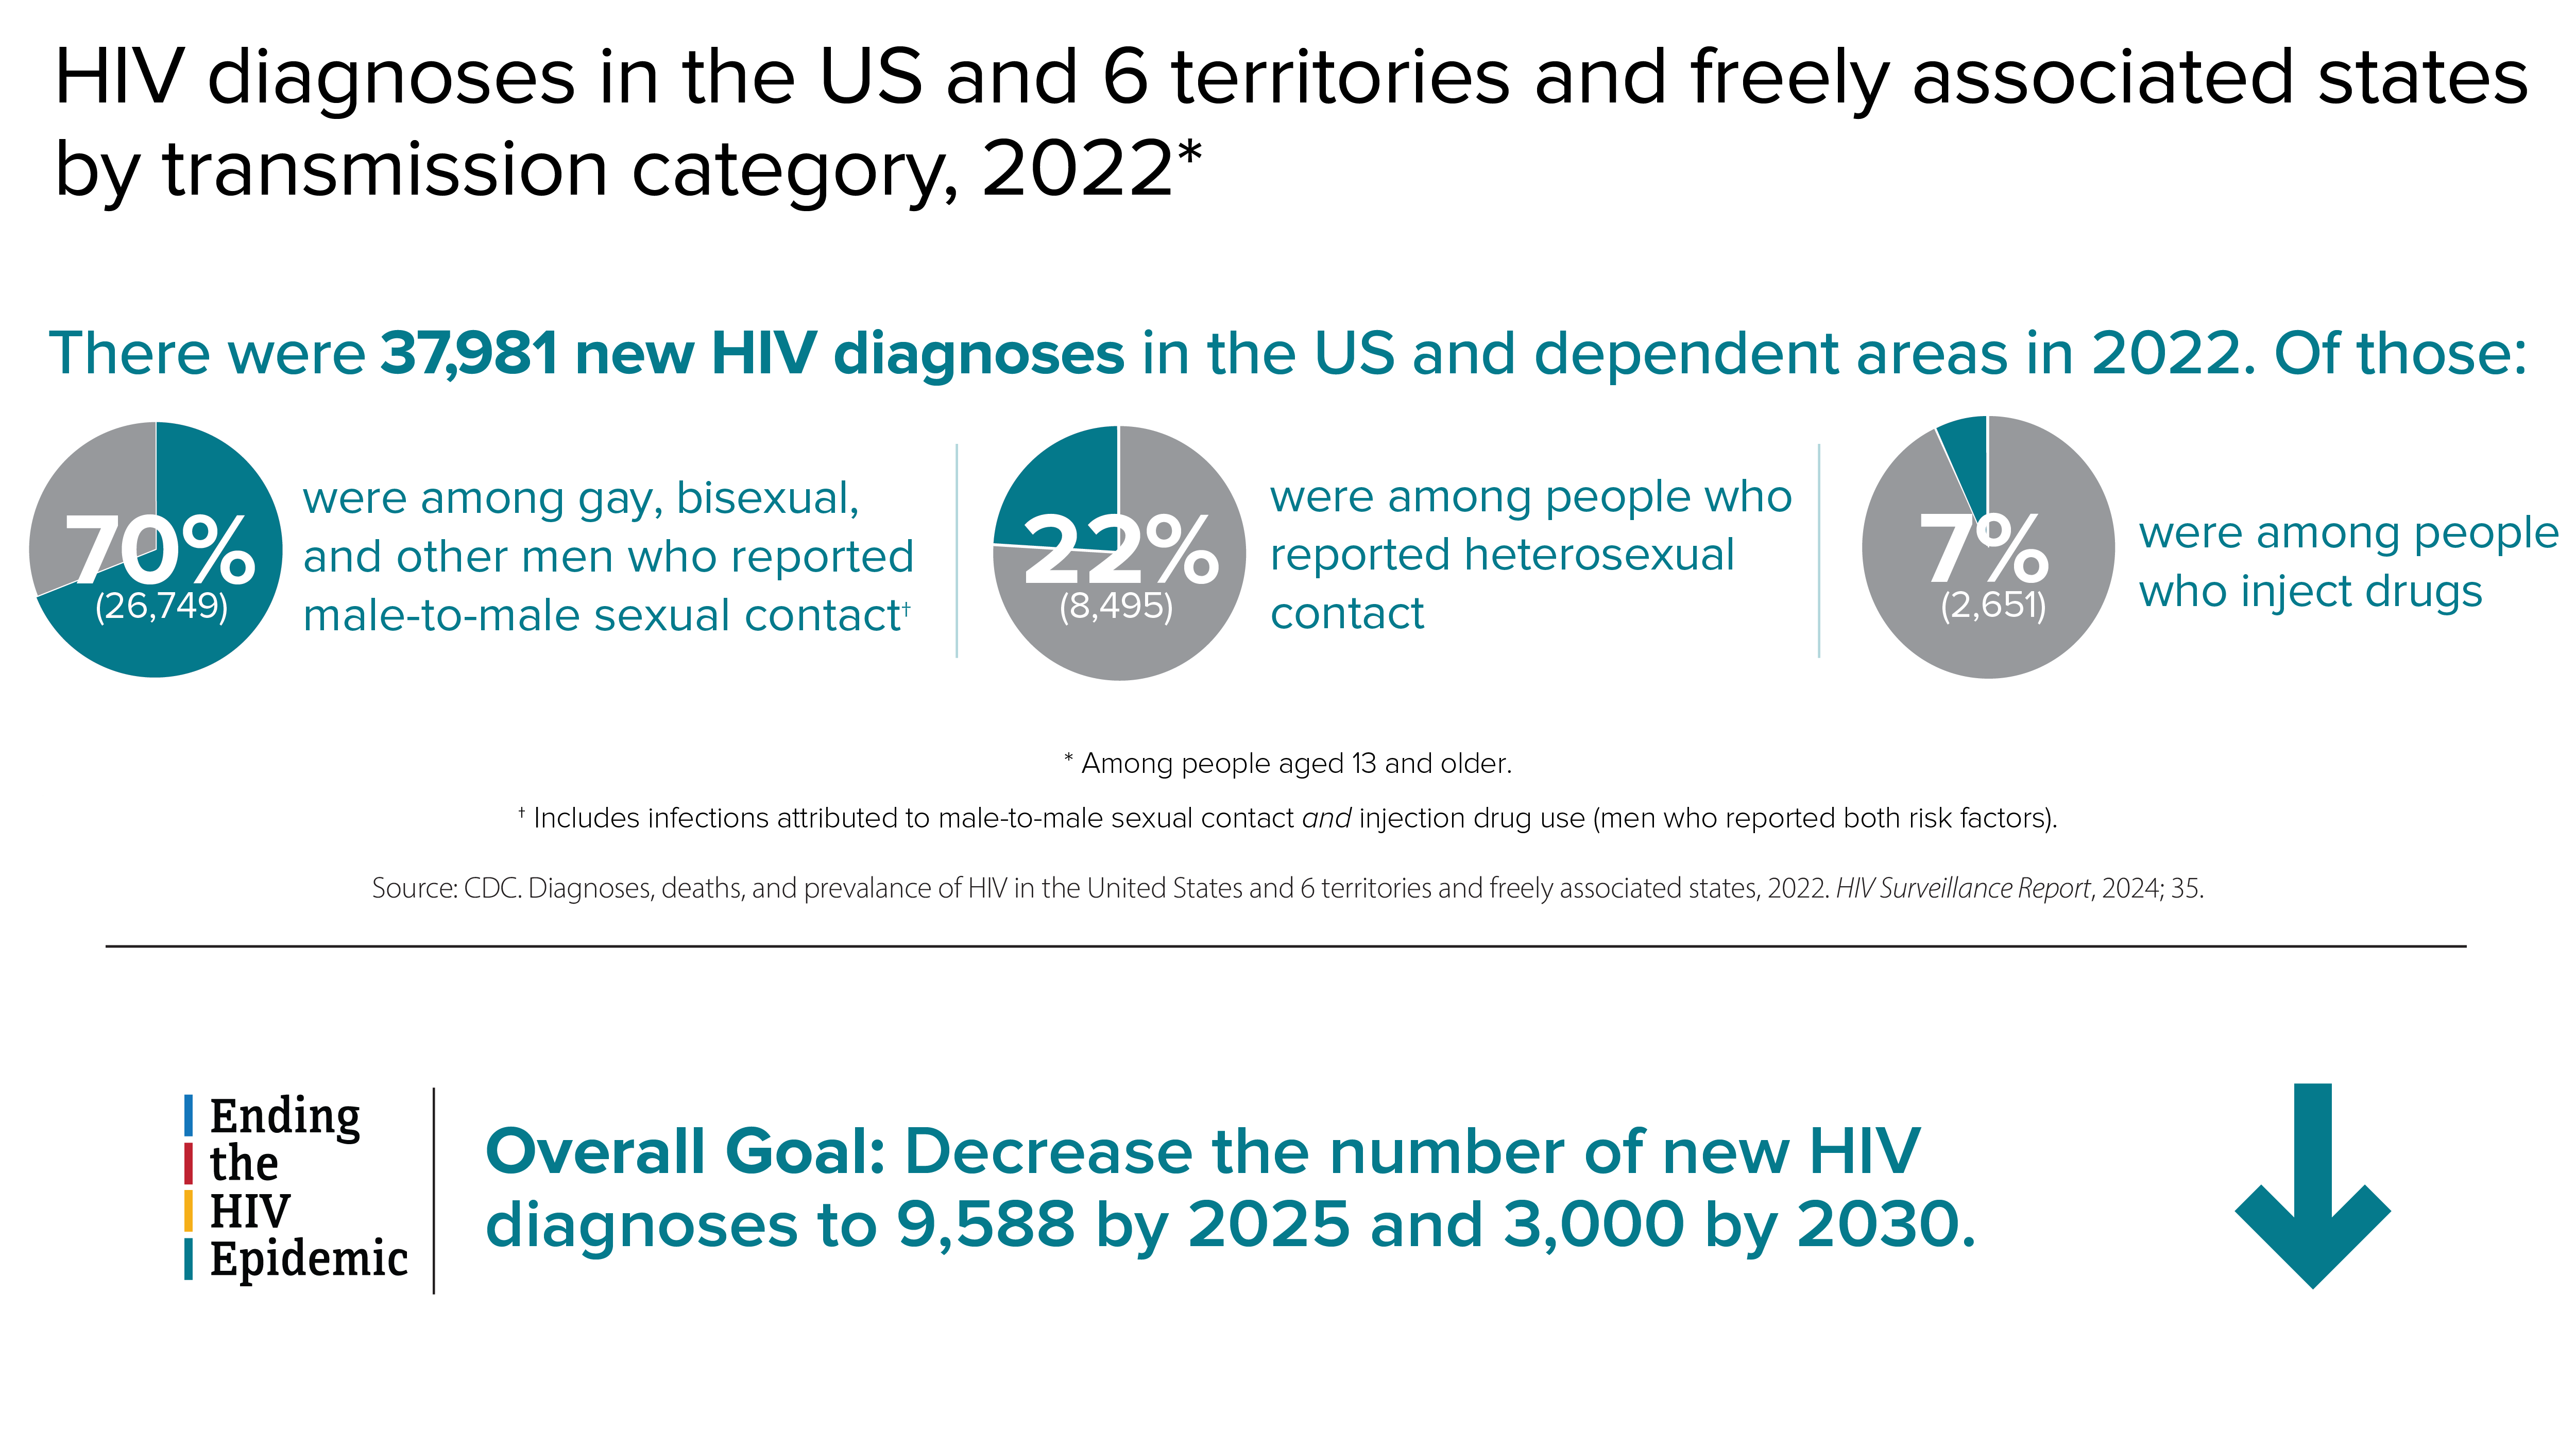
There were 37,981 new HIV diagnoses in the US and dependent areas in 2022. Of those: 70% (26,749) were among gay, bisexual, and other men who reported male-to-male sexual contact; 22% (8,495) were among people who reported heterosexual contact; and 7% (2,651) were among people who inject drugs. The overall goal of the Ending the HIV Epidemic in the US campaign is to decrease the number of new HIV diagnoses to 9,588 by 2025 and 3,000 by 2030.
HIV diagnoses in the US and 6 territories and freely associated states by transmission category.
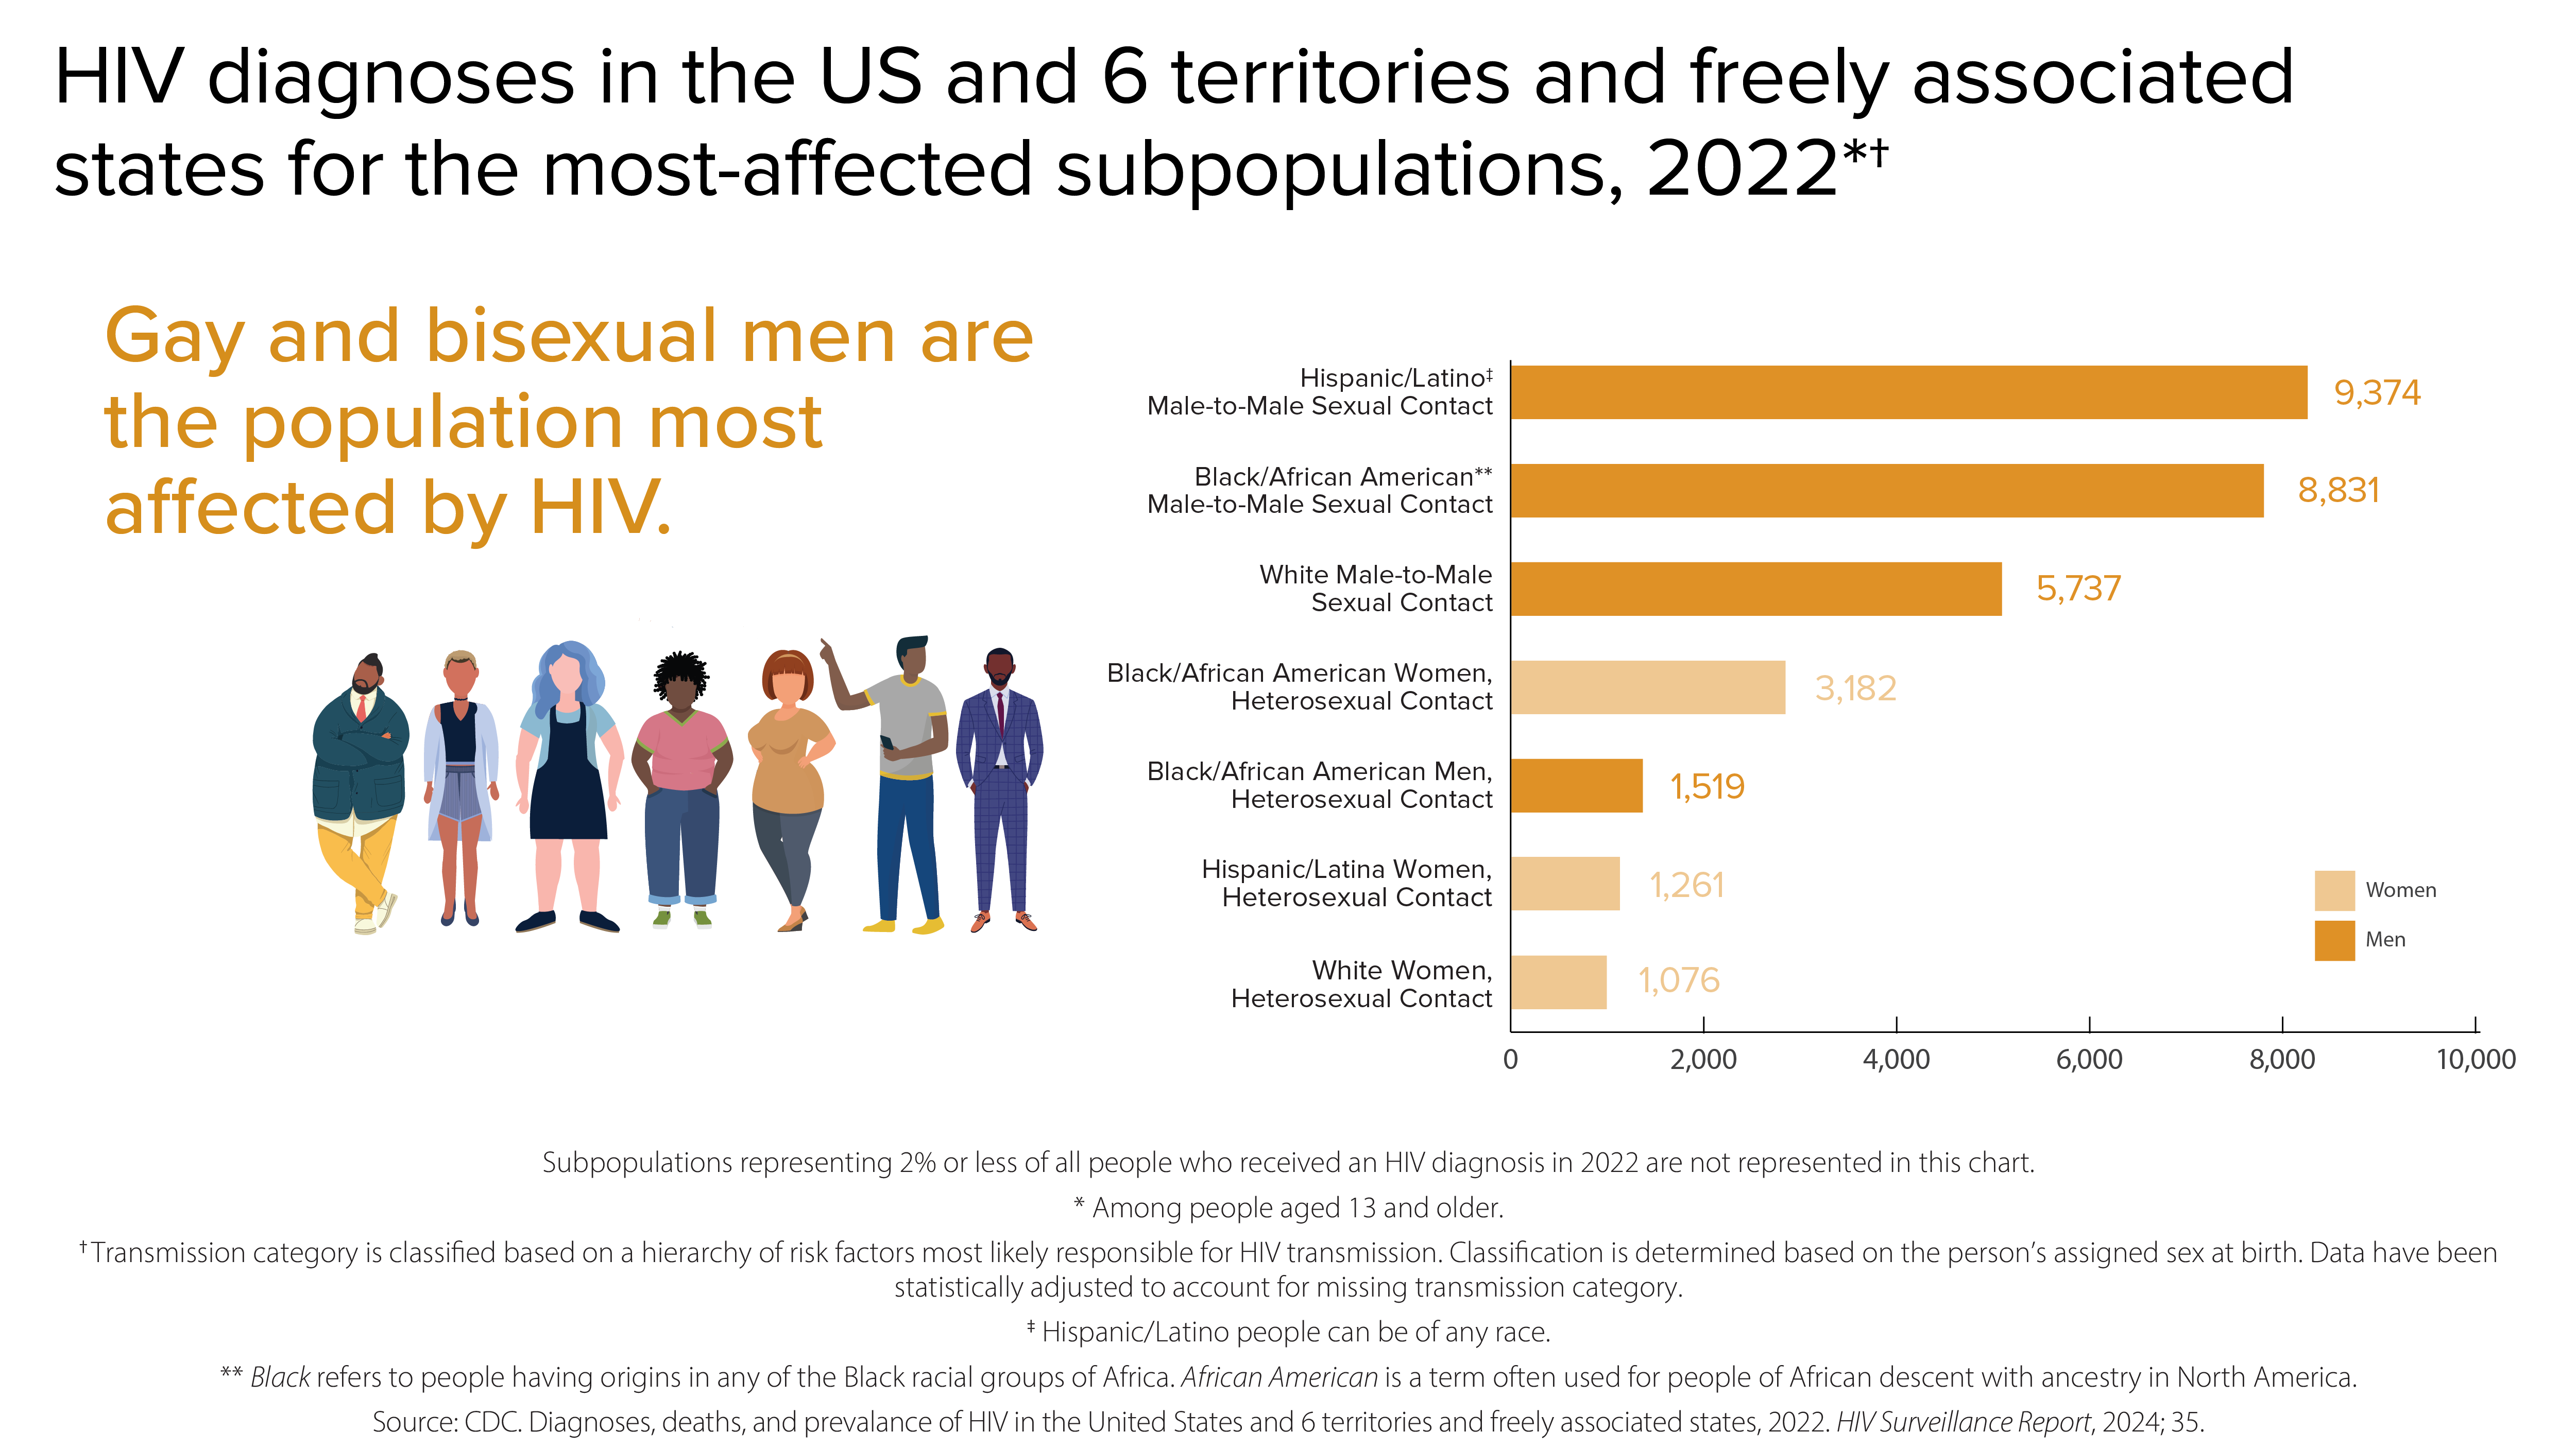
Gay and bisexual men are the population most affected by HIV. Of HIV diagnoses in the US and 6 territories and freely associated states, the most-affected subpopulations in 2022 were: 9,374 Hispanic/Latino men reporting male-to-male sexual contact, 8,831 Black/African American men reporting male-to-male sexual contact, 5,737 white men reporting male-to-male sexual contact, 3,182 Black/African American Women reporting heterosexual contact, 1,519 Black/African American men reporting heterosexual contact, 1,261 Hispanic/Latina women reporting heterosexual contact, and 1,076 white women reporting heterosexual contact.
HIV diagnoses in the US and 6 territories and freely associated states for the among the most-affected subpopulations.

HIV diagnoses among transgender people

In 2022, transgender people accounted for 2% (928) of the 37,981 new HIV diagnoses.

  • Transgender womenaccounted for 2% (869) of new HIV diagnoses.
  • Transgender menaccounted for less than 1% (59) of new HIV diagnoses.
Among transgender people who received an HIV diagnosis in 2022, racial and ethnic disparities continue to exist. Of the 928 transgender people diagnosed with HIV in the US and 6 territories and freely associated states in 2022, 41% (377) were Black/African American, 39% (358) were Hispanic/Latino, 14% (130) were White, 4% (38) were multiracial, 2% (15) were Asian, 1% (6) were American Indian/Alaska Native, and less than 1% (4) were Native Hawaiian and other Pacific Islander.
HIV diagnoses among transgender people by race and ethnicity.
With respect to HIV diagnoses among transgender people in the US and 6 territories and freely associated states, there was a 33% decrease in diagnoses among American Indian/Alaska Native people, followed by a 36% increase among Asian, a 13% increase among Black/African American, a 42% increase among Hispanic/Latino, a 100% increase among Native Hawaiian and other Pacific Islander, a 43% increase among White, and a 12% decrease among multiracial people.
Trends in HIV diagnoses among transgender people.

HIV diagnoses among gay and bisexual men

Gay, bisexual, and other men who reported male-to-male sexual contact are the population most affected by HIV. In 2022, gay and bisexual men accounted for 67% (25,482) of the 37,981 new HIV diagnoses and 86% of diagnoses among all men.
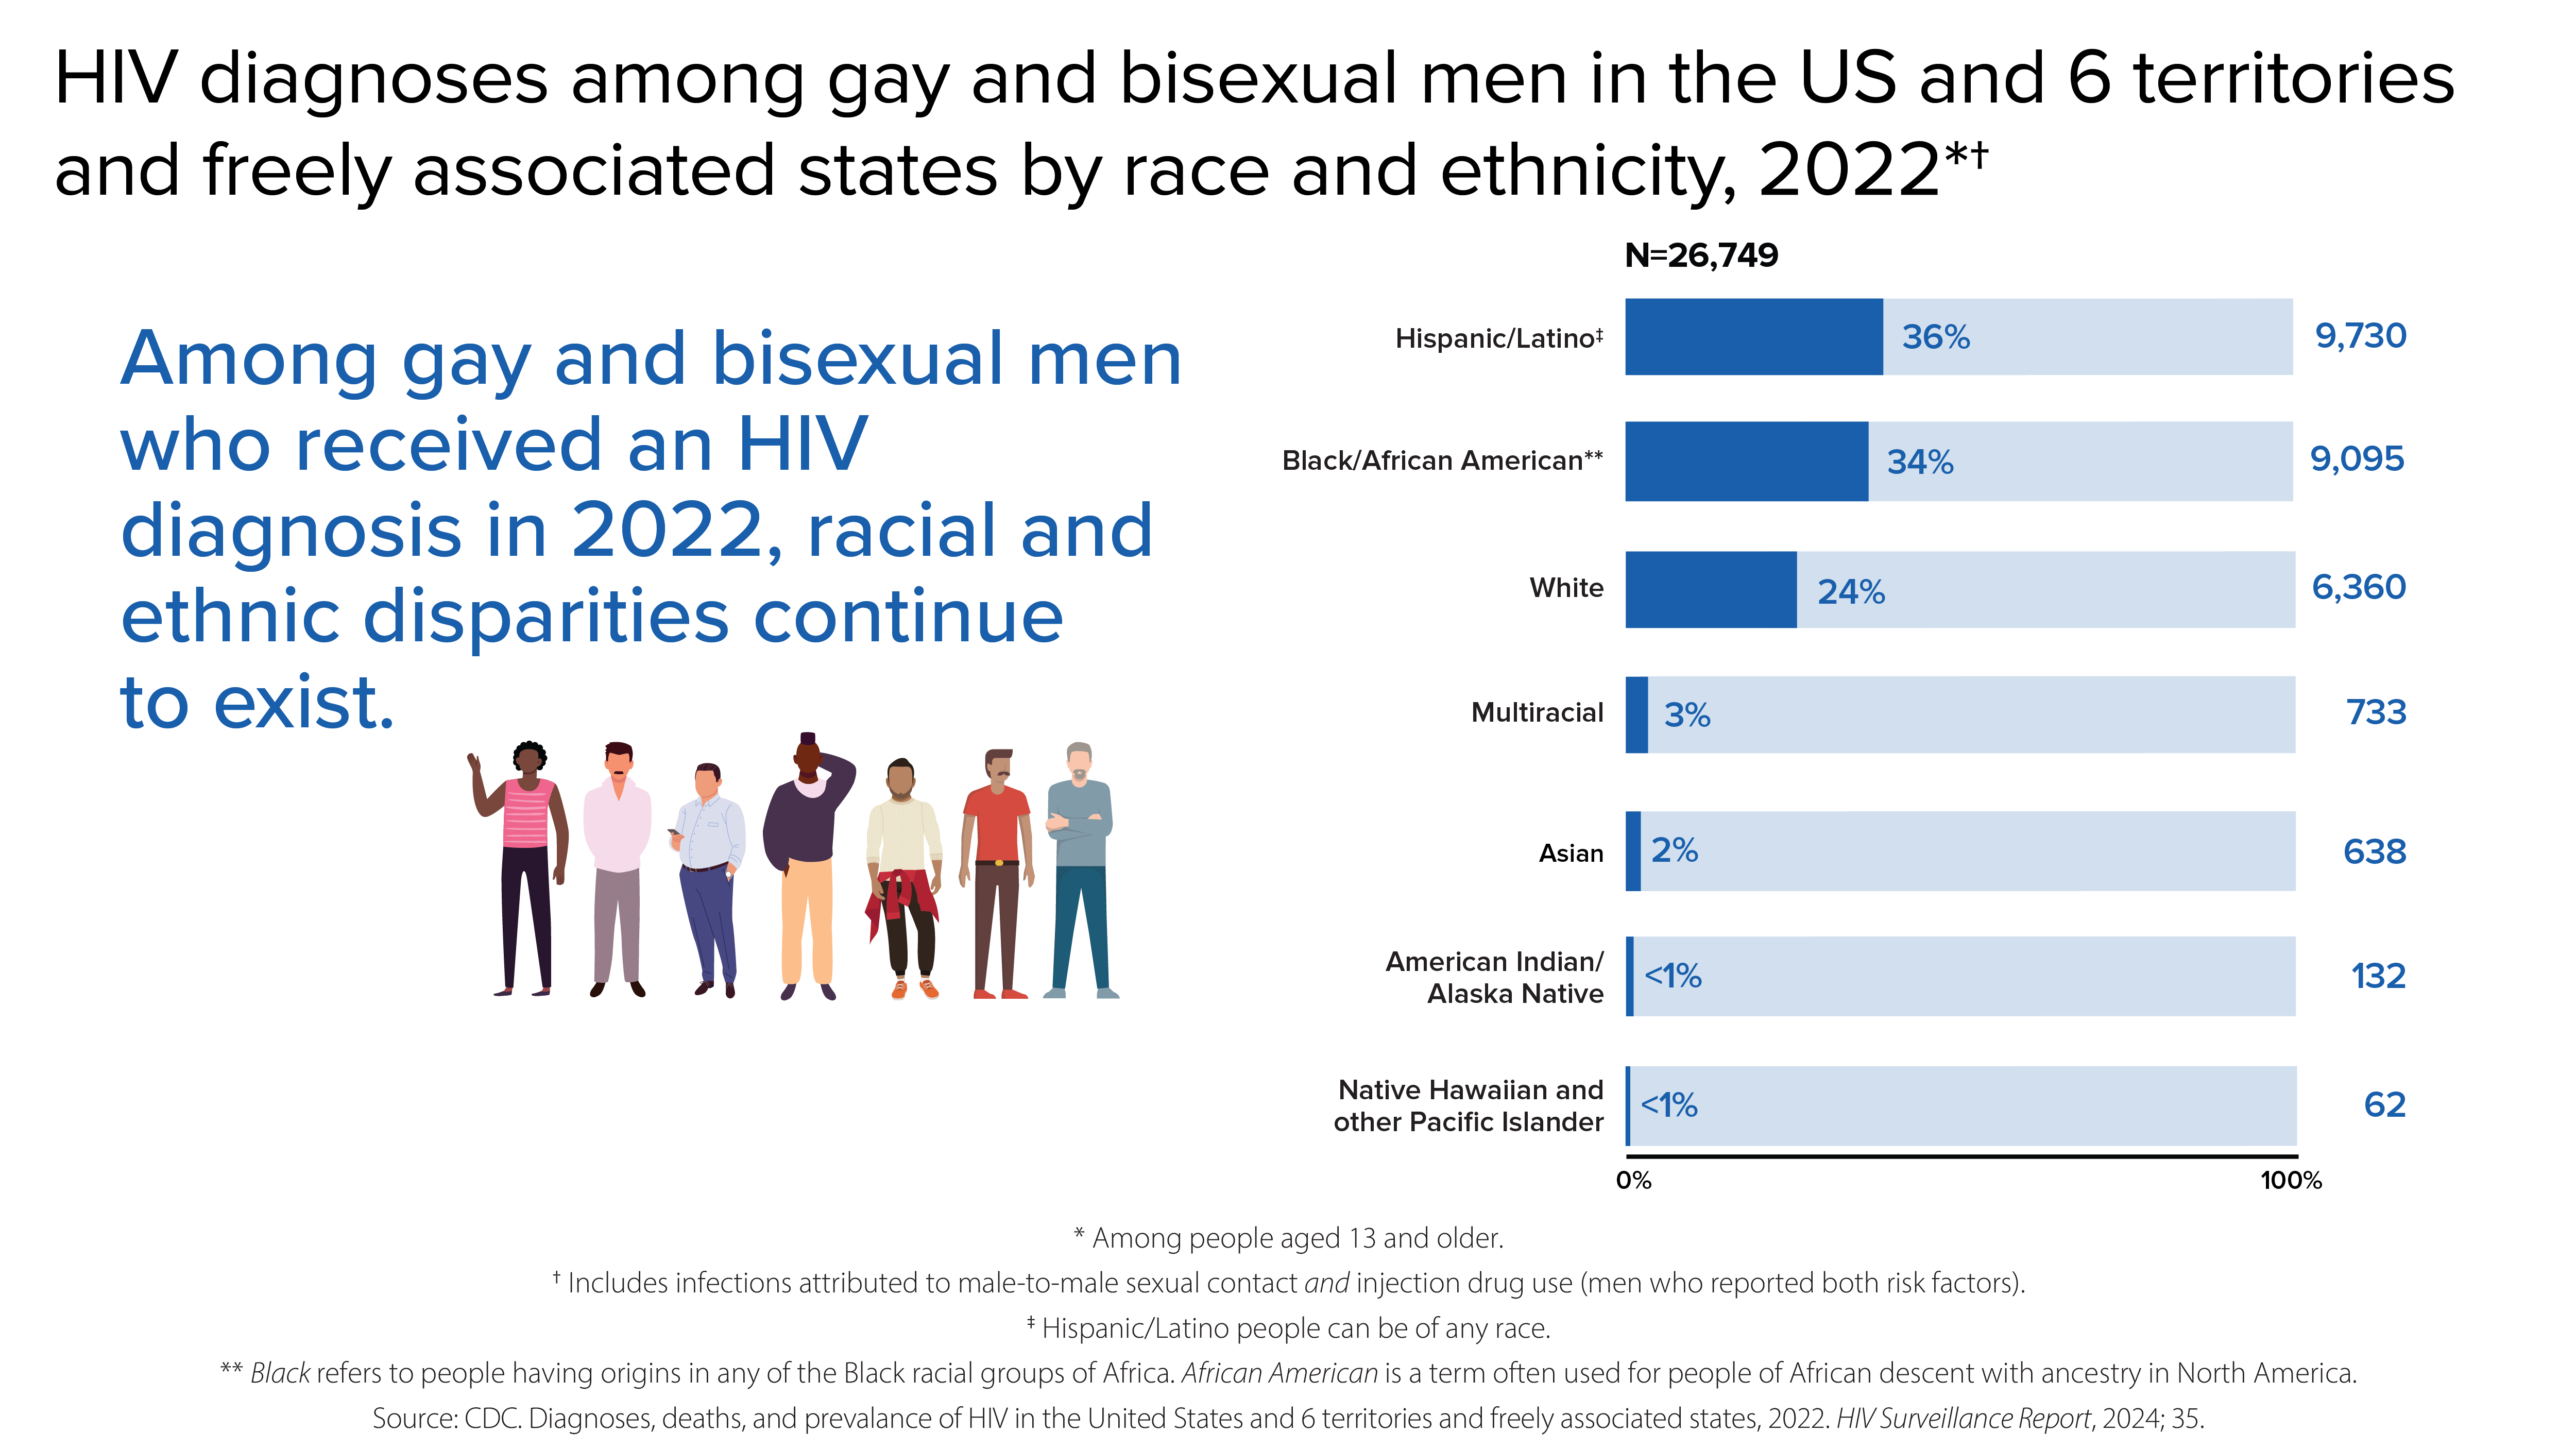
Among gay and bisexual men who received an HIV diagnosis in 2022, racial and ethnic disparities continue to exist. Among the 26,749 HIV diagnoses among gay and bisexual men in the US and 6 territories and freely associated states in 2022, 36% (9,730) were Hispanic/Latino, 34% (9,095) were Black/African American, 24% (6,360) were White, 3% (733) were multiracial, 2% (638) were Asian, less than 1% (132) were American Indian/Alaska Native, and less than 1% (62) were Native Hawaiian and other Pacific Islander people.
HIV diagnoses among gay and bisexual men by race and ethnicity.

From 2018 to 2022, HIV diagnoses were stable among gay and bisexual men overall. But trends varied for different groups of gay and bisexual men.
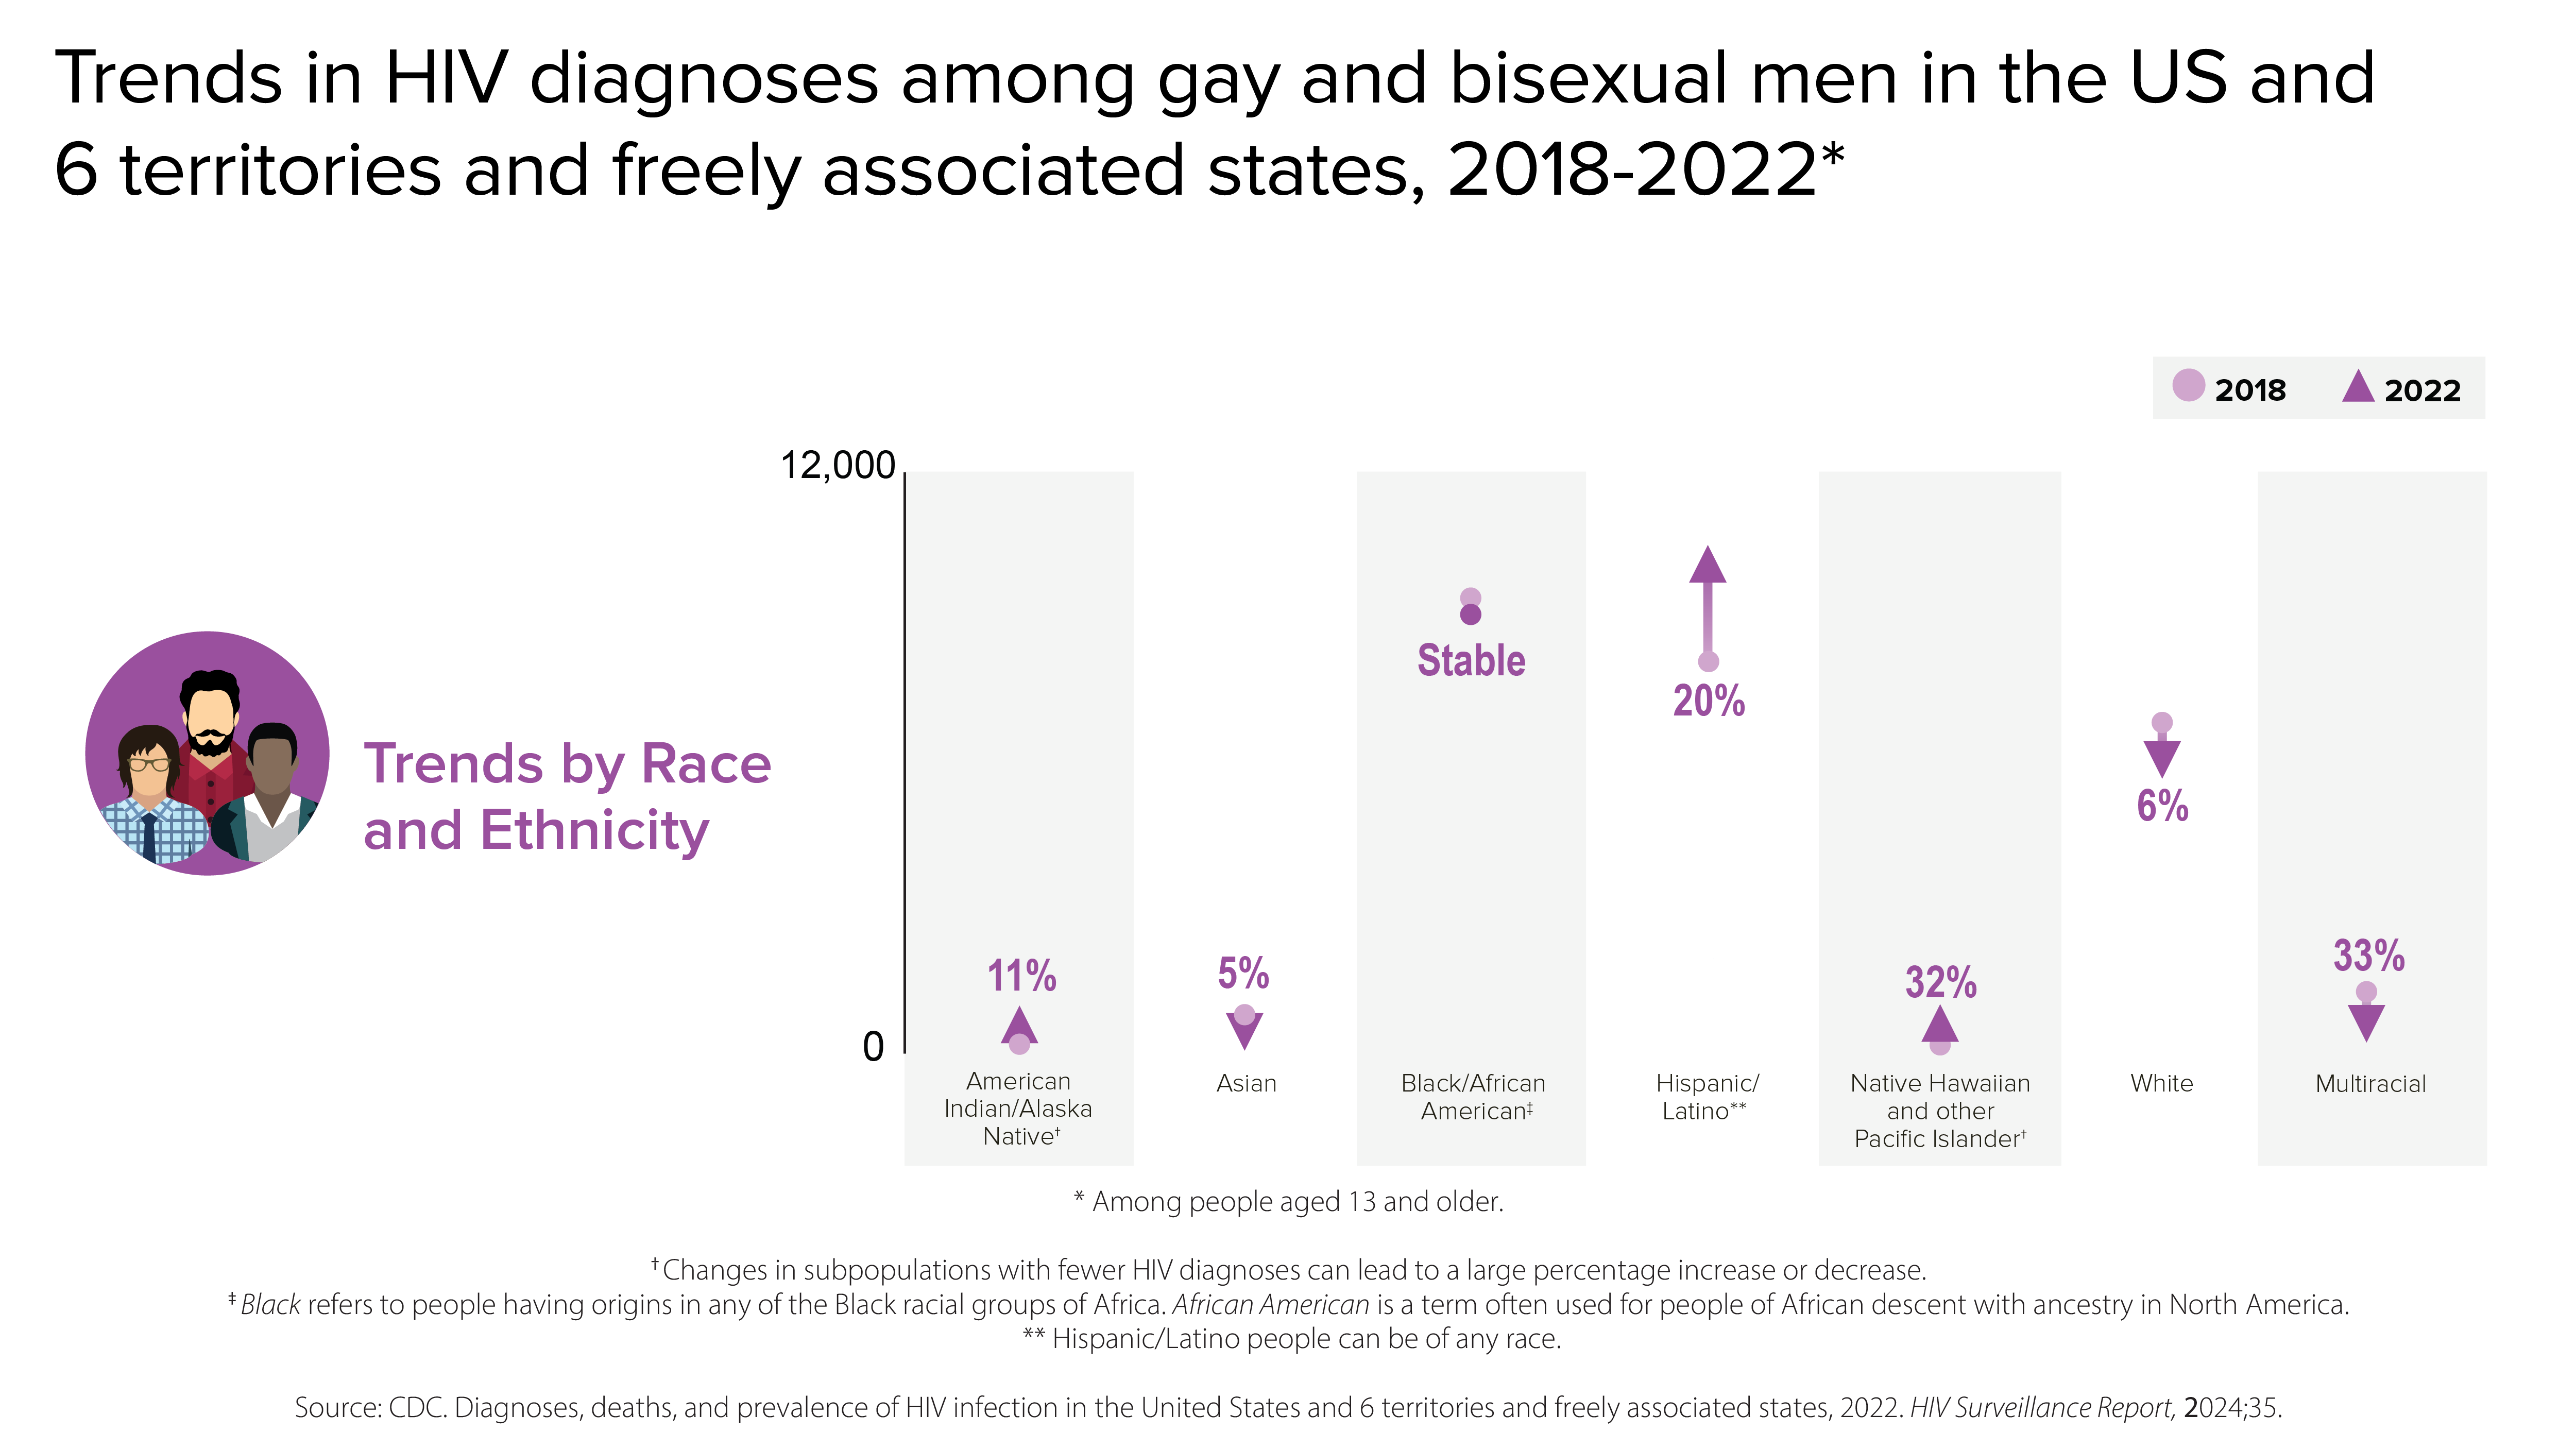
From 2018 to 2022, among gay and bisexual men in the US and 6 territories and freely associated states, HIV diagnoses increased by 11% among American Indian/Alaskan Native men, decreased by 5% among Asian men, were stable among Black/African American men, increased by 20% among Hispanic/Latino men, increased 32% among Native Hawaiian and other Pacific Islander men, decreased 6% among White men, and decreased by 33% among multiracial men.
Trends in HIV diagnoses among gay and bisexual men by race and ethnicity.

HIV diagnoses among people who reported heterosexual contact

Men and women who reported heterosexual contact continue to be affected by HIV. In 2022, people reporting heterosexual contact accounted for 22% (8,495) of the 37,981 new HIV diagnoses.

  • Men reporting heterosexual contact accounted for 7% (2,660) of new HIV diagnoses.
  • Women reporting heterosexual contact accounted for 15% (5,835) of new HIV diagnoses.
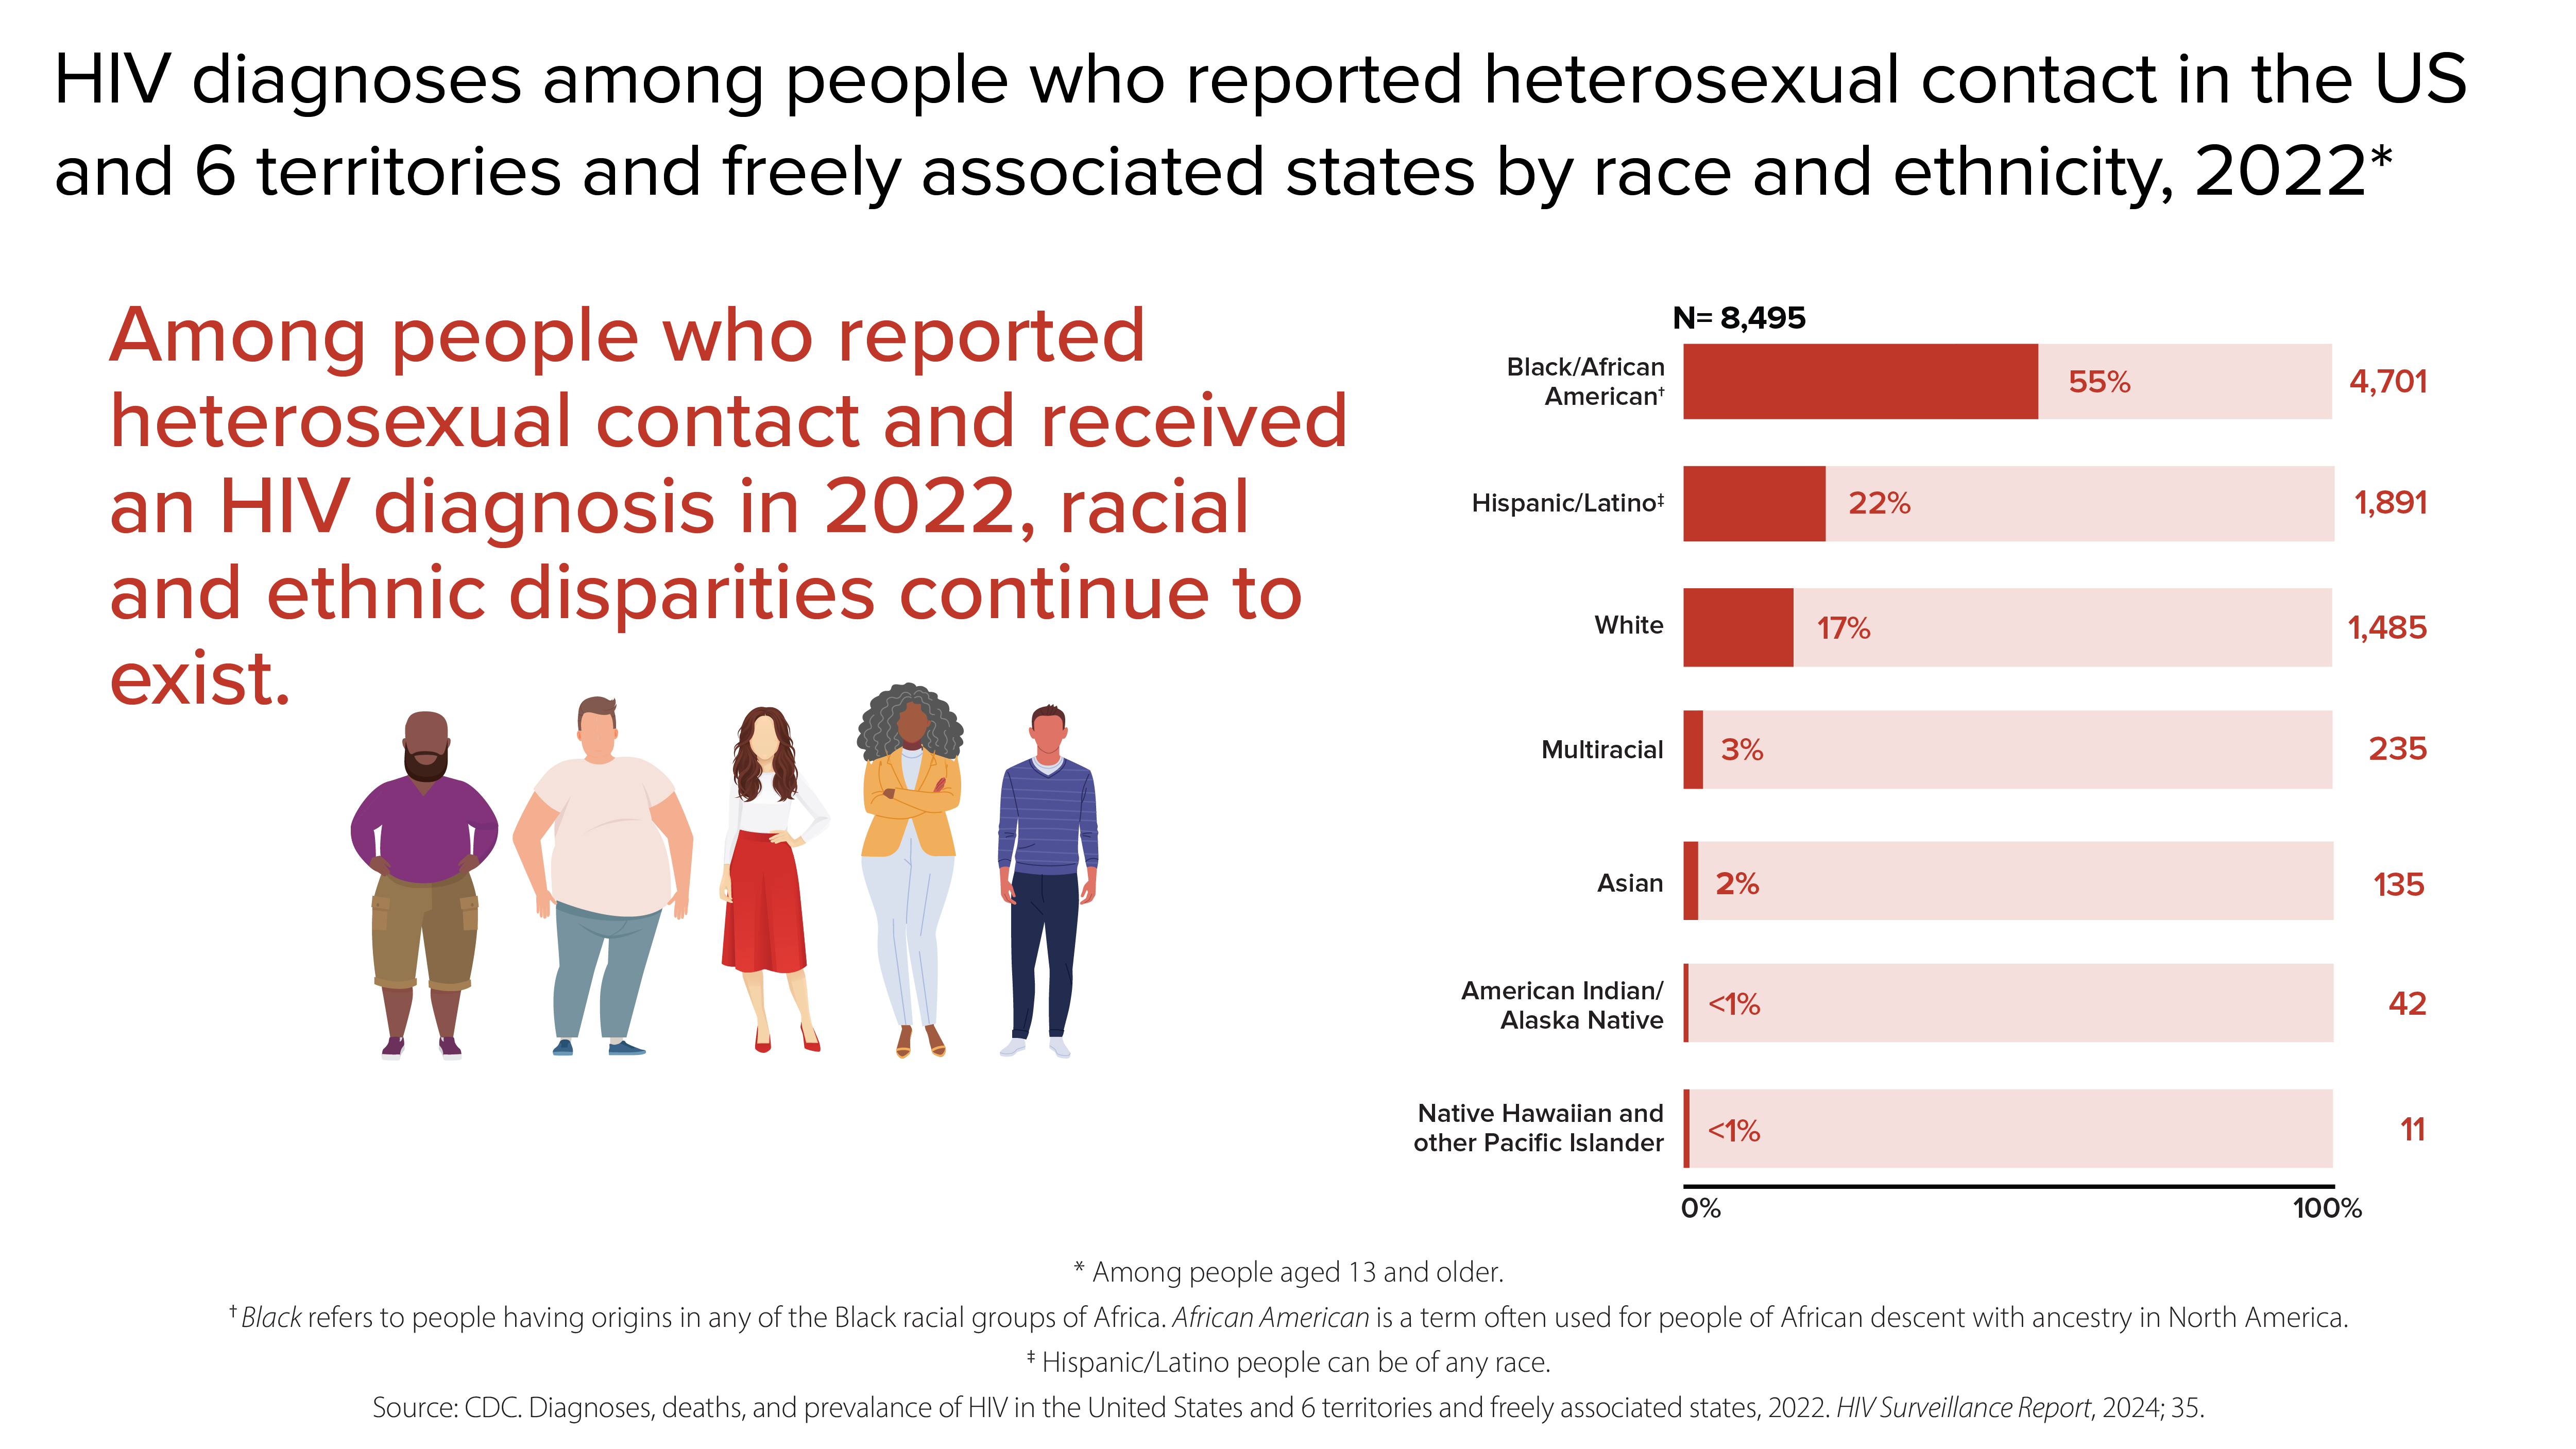
Among people who reported heterosexual contact and received and HIV diagnosis in 2022, racial and ethnic disparities continue to exist. Of the 8,495 HIV diagnoses among people who reported heterosexual contact in the US and 6 territories and freely associated states, 55% (4,701) were Black/African American, 22% (1,891) were Hispanic/Latino, 17% (1,485) were White, 3% (235) were multiracial, 2% (135) were Asian, less than 1% (42) were American Indian/Alaska Native, and less than 1% (11) were Native Hawaiian and other Pacific Islander.
HIV diagnoses among people who reported heterosexual contact by race and ethnicity.

From 2018 to 2022, HIV diagnoses from heterosexual contact remained stable overall.
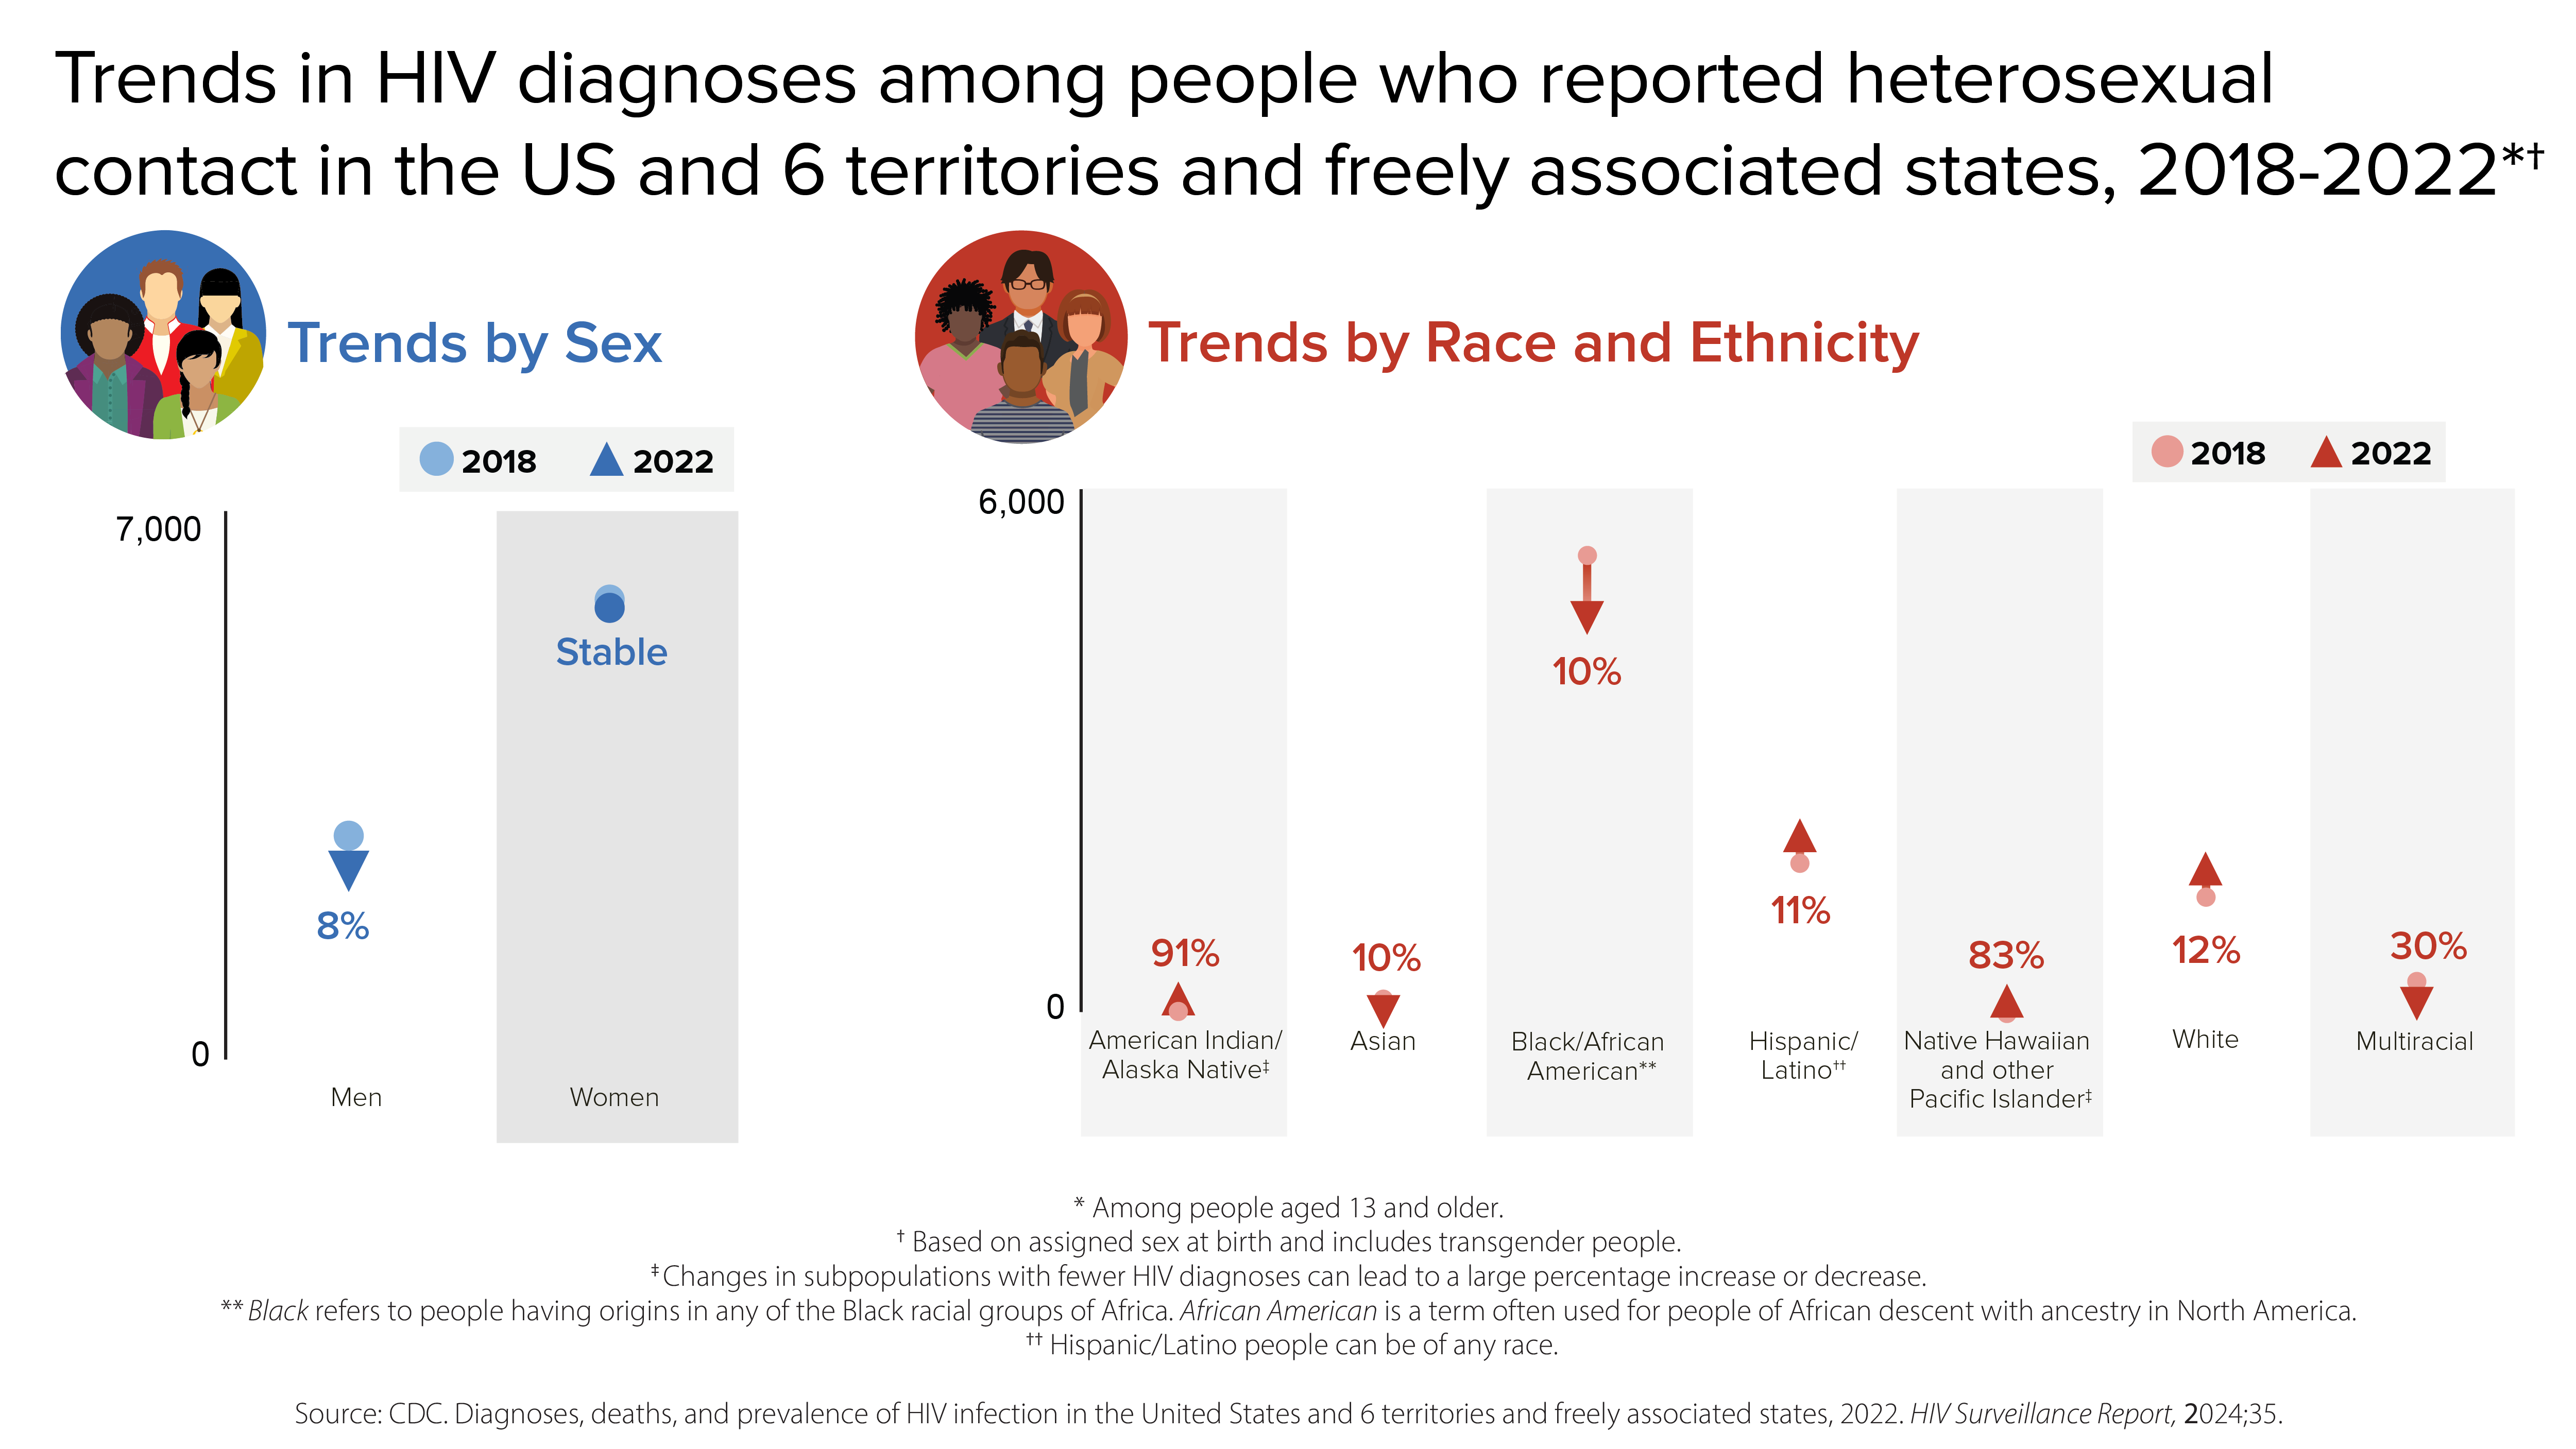
From 2018 to 2022, HIV diagnoses decreased among men by 8% and were stable among women. During that same period, with respect to HIV diagnoses, there was a 91% increase among American Indian/Alaska Native, a 10% decrease among Asian, a 10% decrease among Black/African American, an 11% increase among Hispanic/Latino, an 83% increase among Native Hawaiian and other Pacific Islander, a 12% increase among White, and a 30% decrease among multiracial people.
Trends in HIV diagnoses among people who reported heterosexual contact.

HIV diagnoses among people who inject drugs (PWID)

In 2022, PWID accounted for 7% (2,651) of the 37,981 new HIV diagnoses.

  • Men who inject drugs accounted for 4% (1,490) of new HIV diagnoses.
  • Women who inject drugs accounted for 3% (1,161) of new HIV diagnoses.
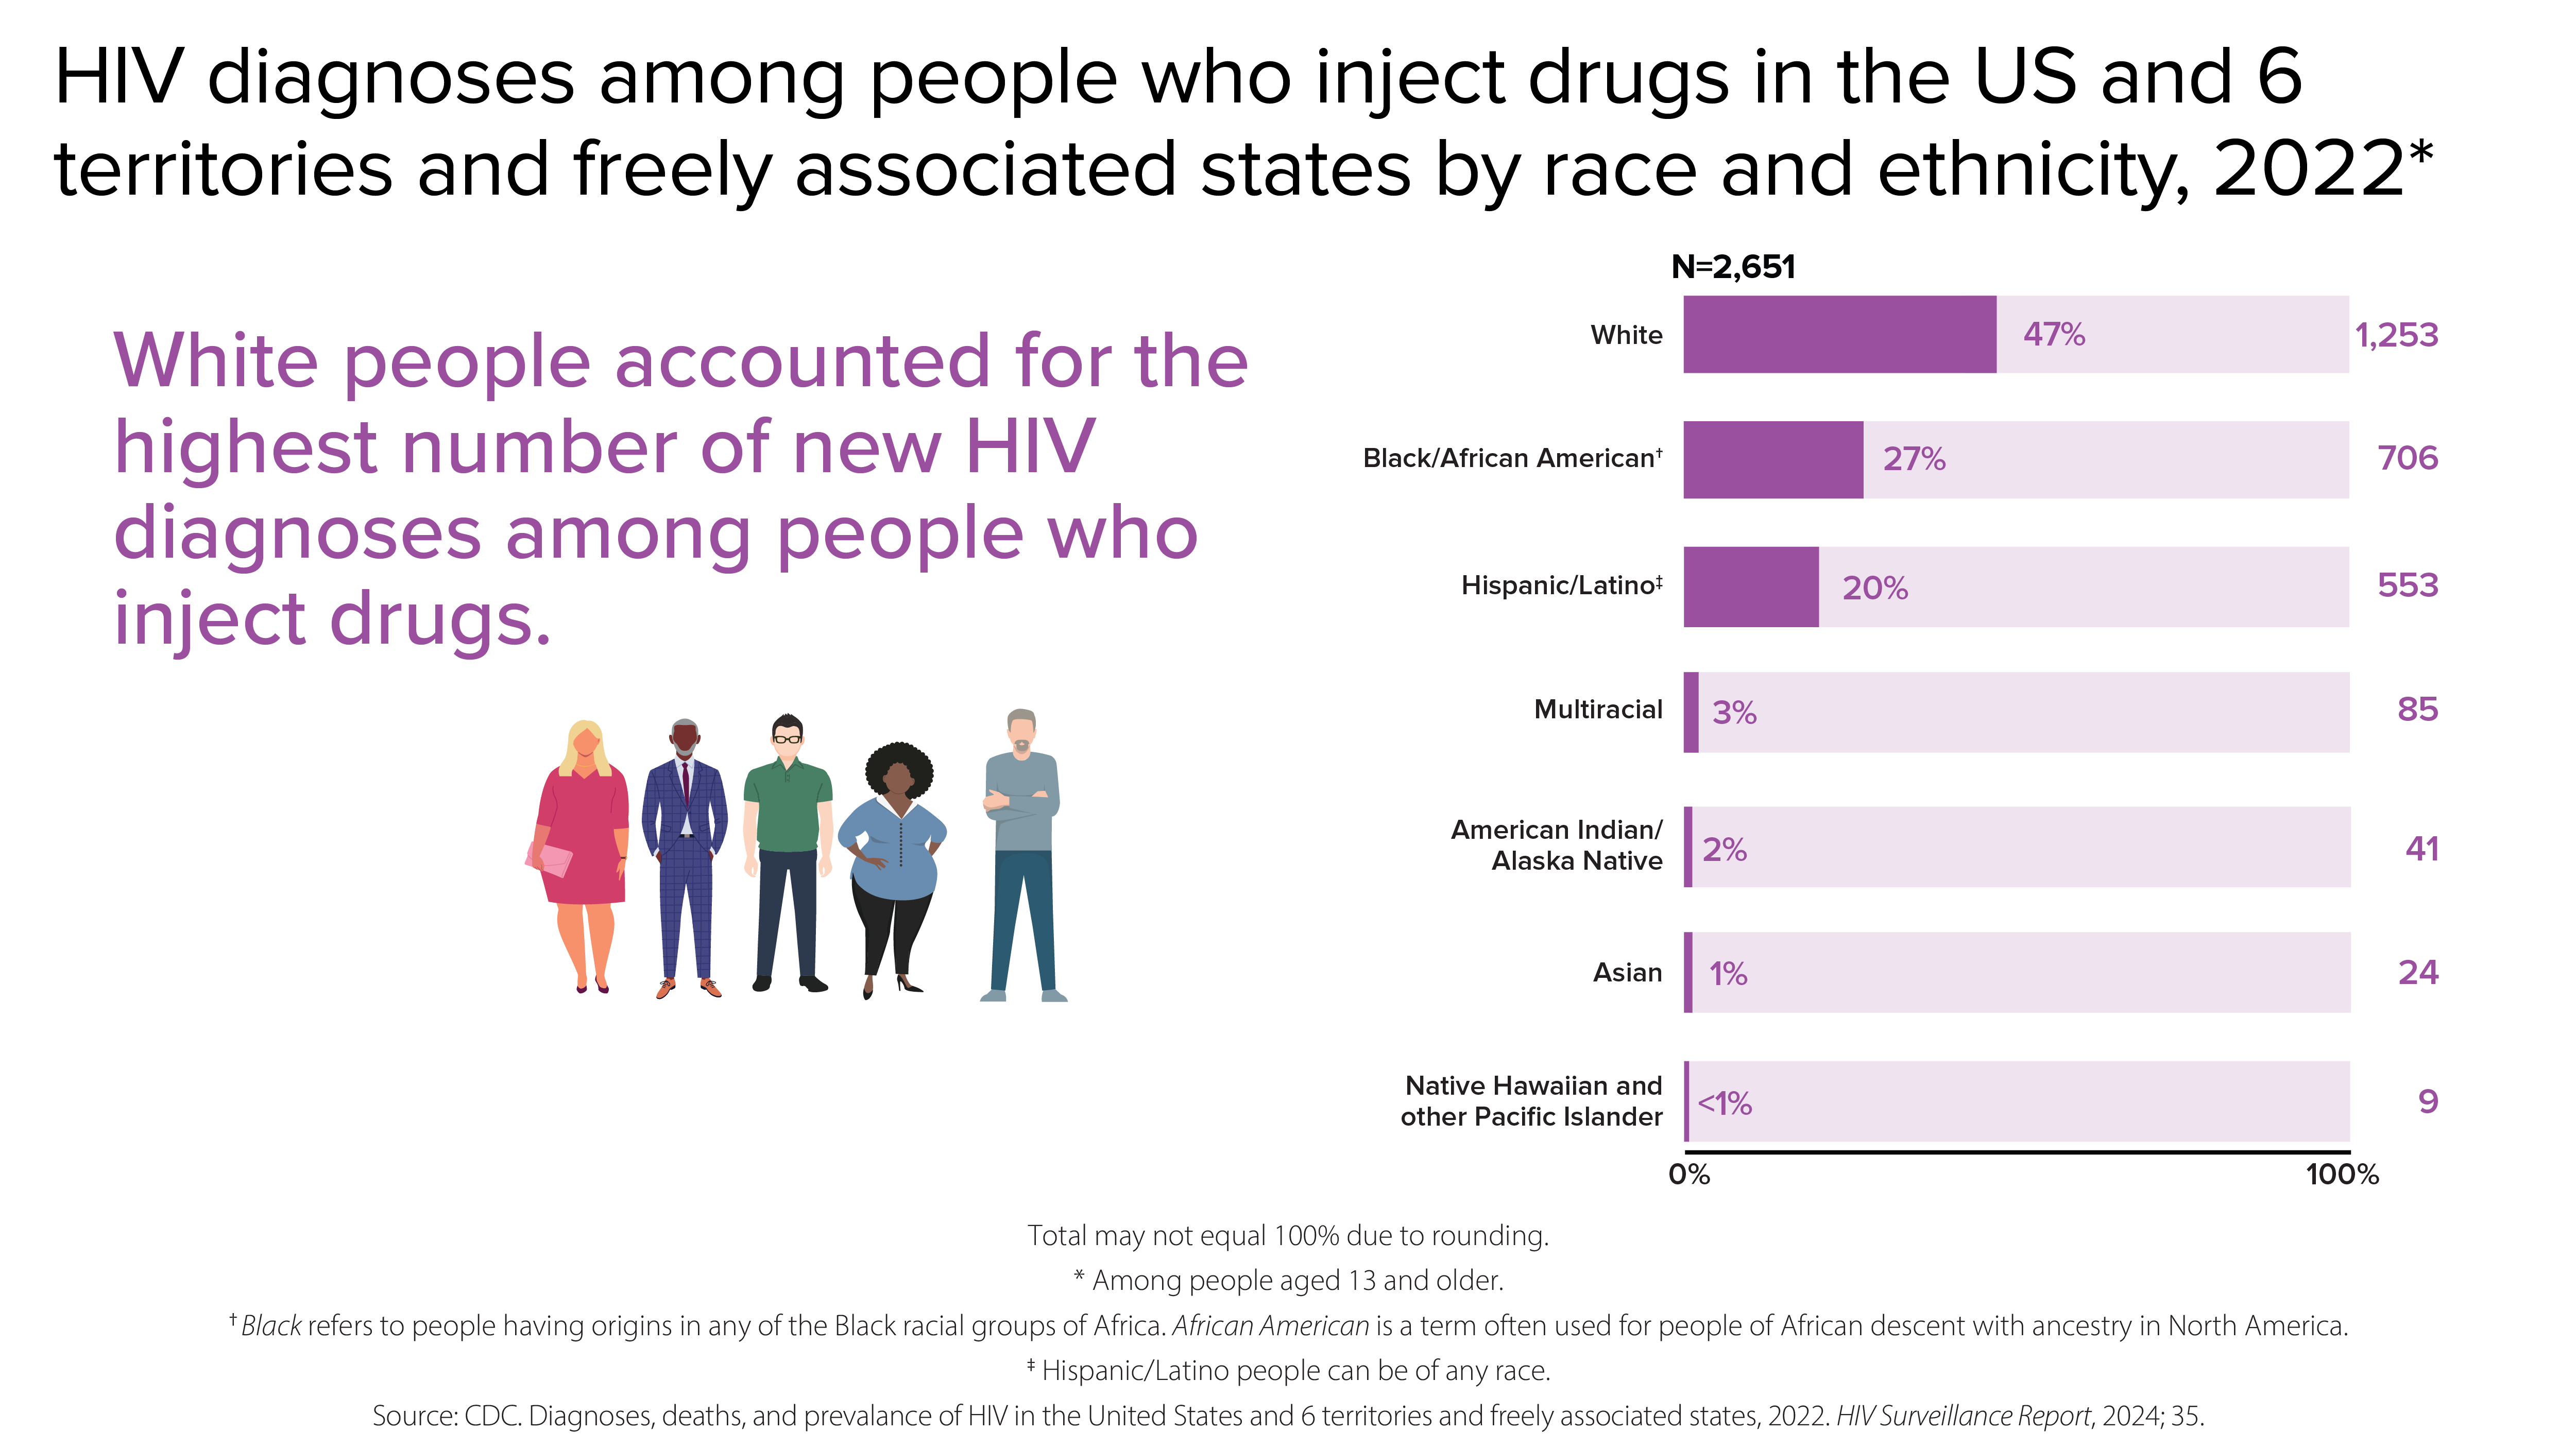
White people accounted for the highest number of new HIV diagnoses among people who inject drugs in 2022. That same year, of the 2,651 HIV diagnoses among people who inject drugs in the US and 6 territories and freely associated states, 47% (1,253) were among White, 27% (706) were among Black/African American, 20% (553) were among Hispanic/Latino, 3% (85) were among multiracial, 2%(41) were among American Indian/Alaska Native, 1% (24) were among Asian, and less than 1% (9) were among Native Hawaiian and other Pacific Islander people.
HIV diagnoses among people who inject drugs by race and ethnicity.

From 2018 to 2022, HIV diagnoses increased 5% among PWID overall.
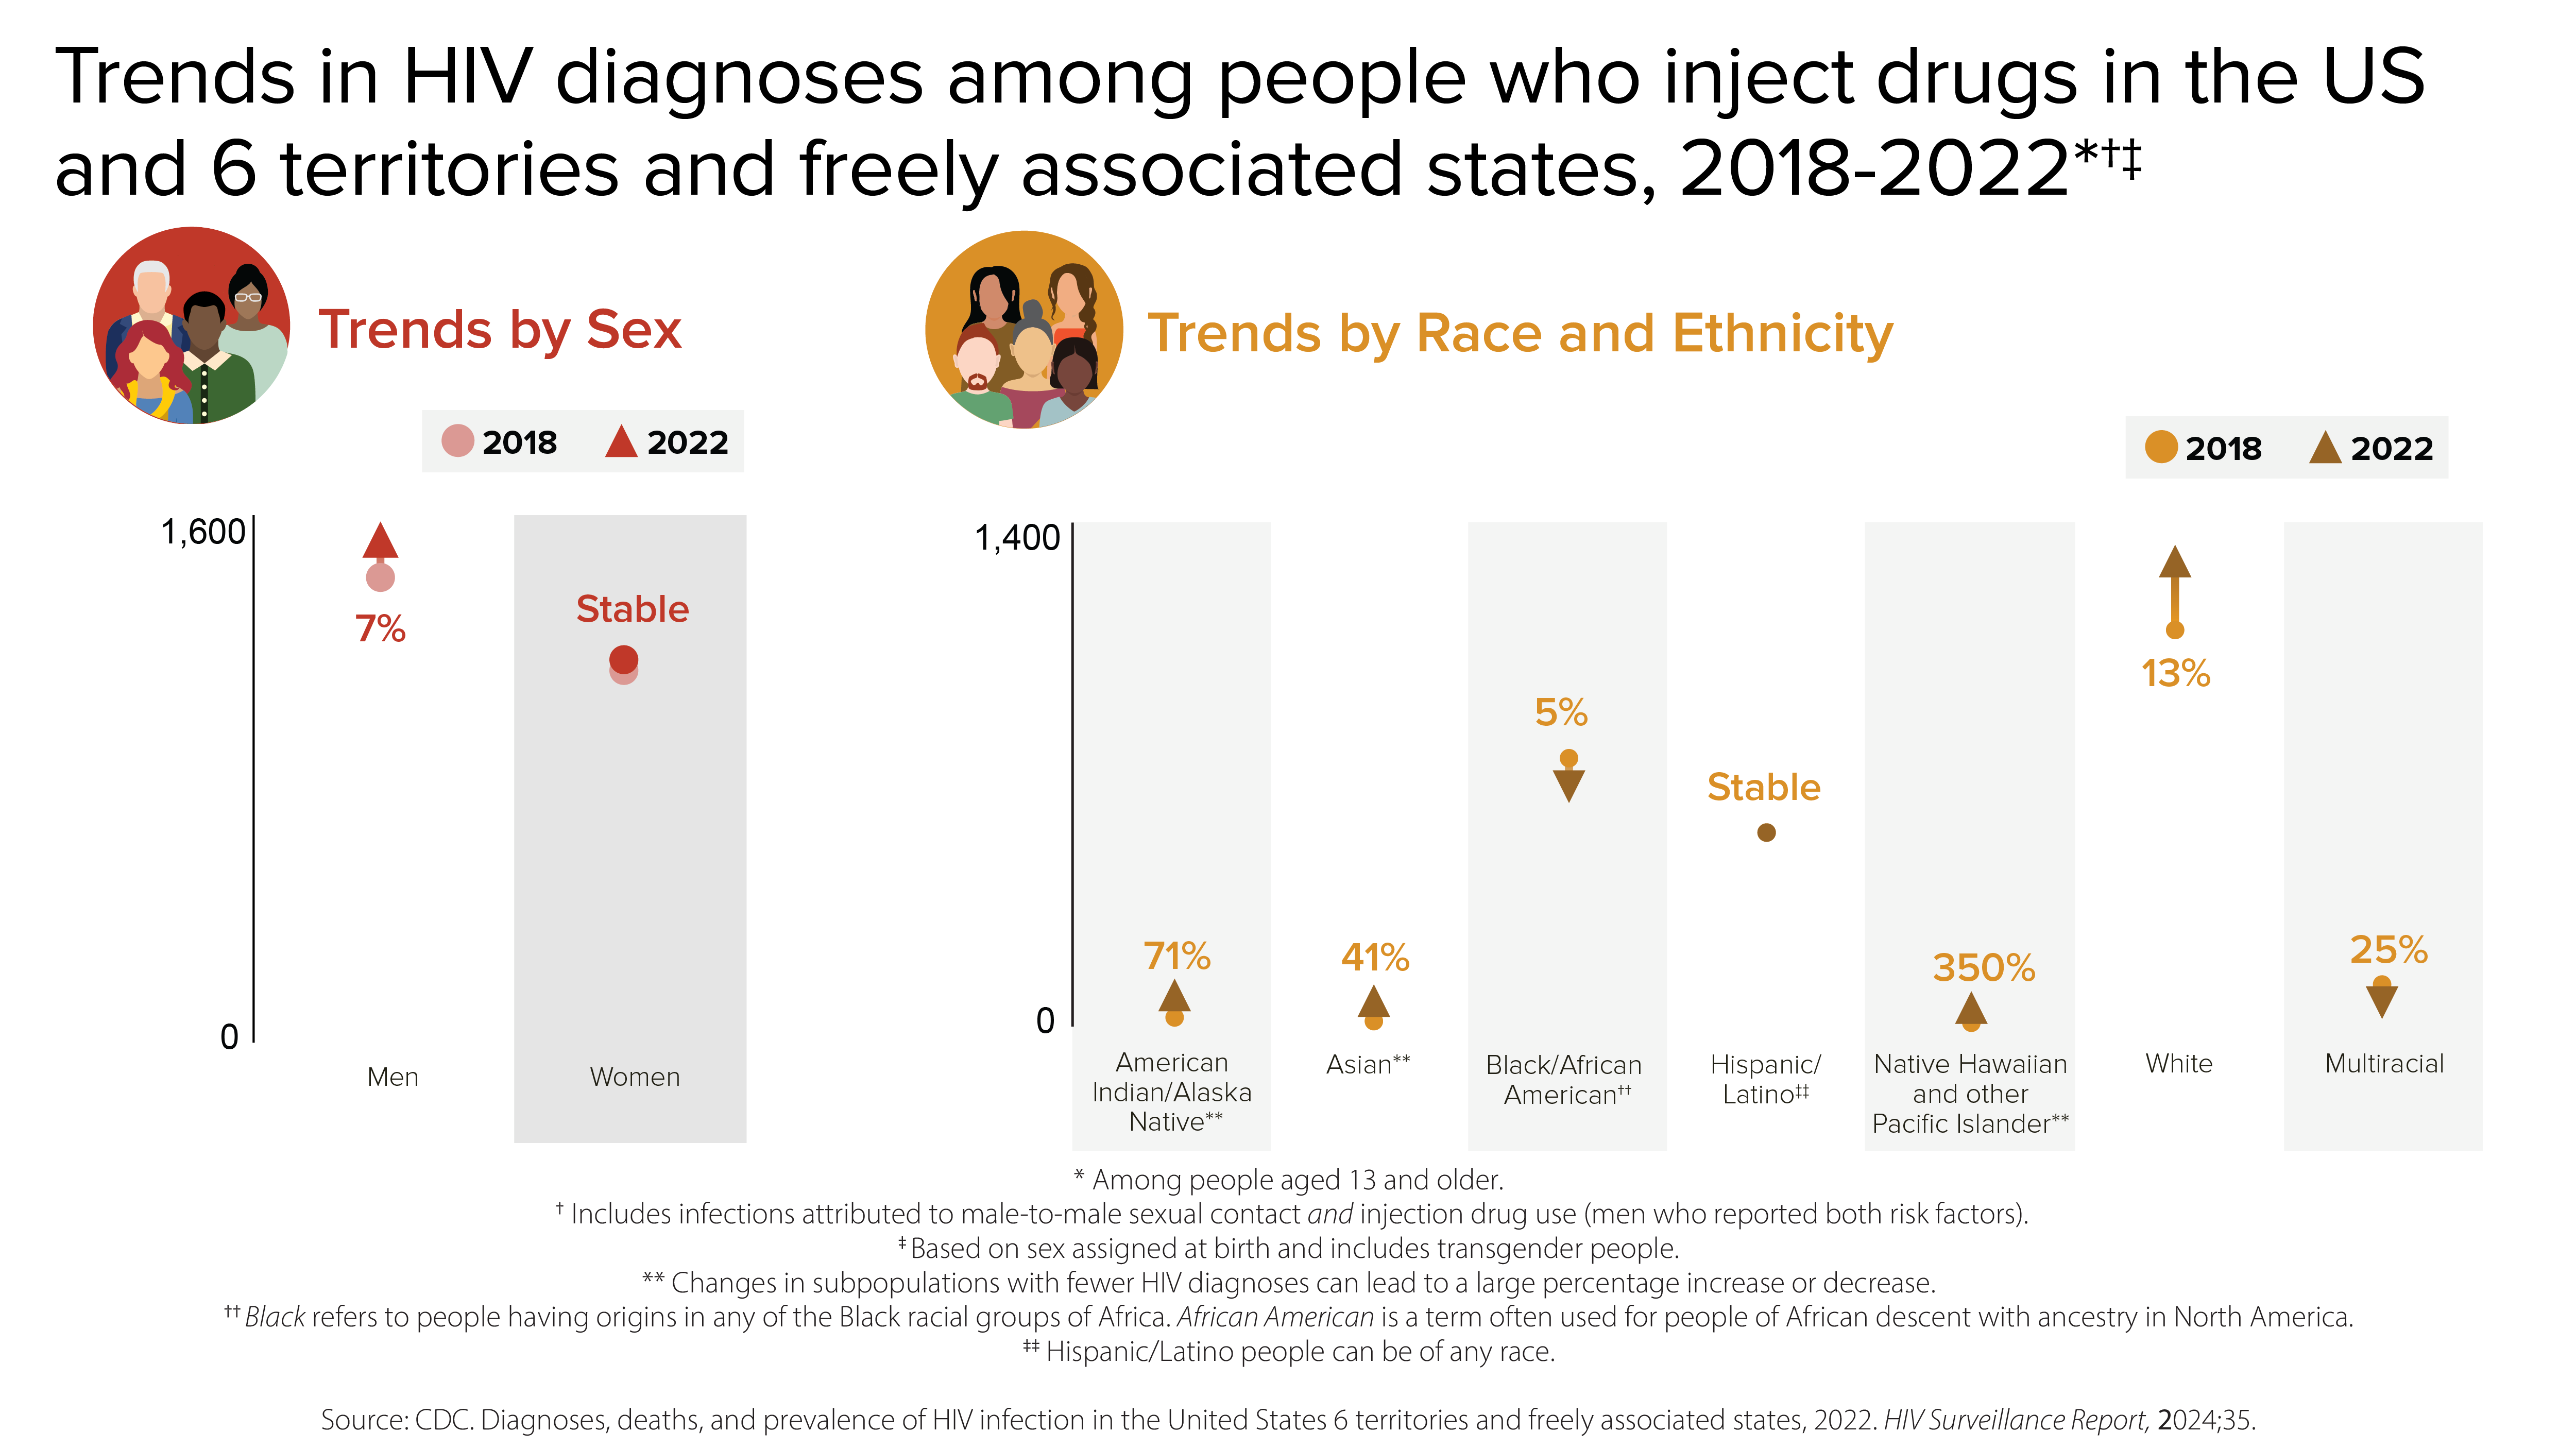
From 2018 to 2022, the HIV diagnoses among men who inject drugs increased by 7% but was stable among women. Over that same period, HIV diagnoses increased by 71% among American Indian/Alaskan Native people, increased by 41% among Asian people, decreased by 5% among Black/African American people, was stable among Hispanic/Latino people, increased by 350% among Native Hawaiian and other Pacific Islander people, rose by 13% among White people, and decreased by 25% among multiracial people.
Trends in HIV diagnoses among people who inject drugs.

HIV diagnoses by region

HIV diagnoses are not evenly distributed regionally in the US and 6 territories and freely associated states.
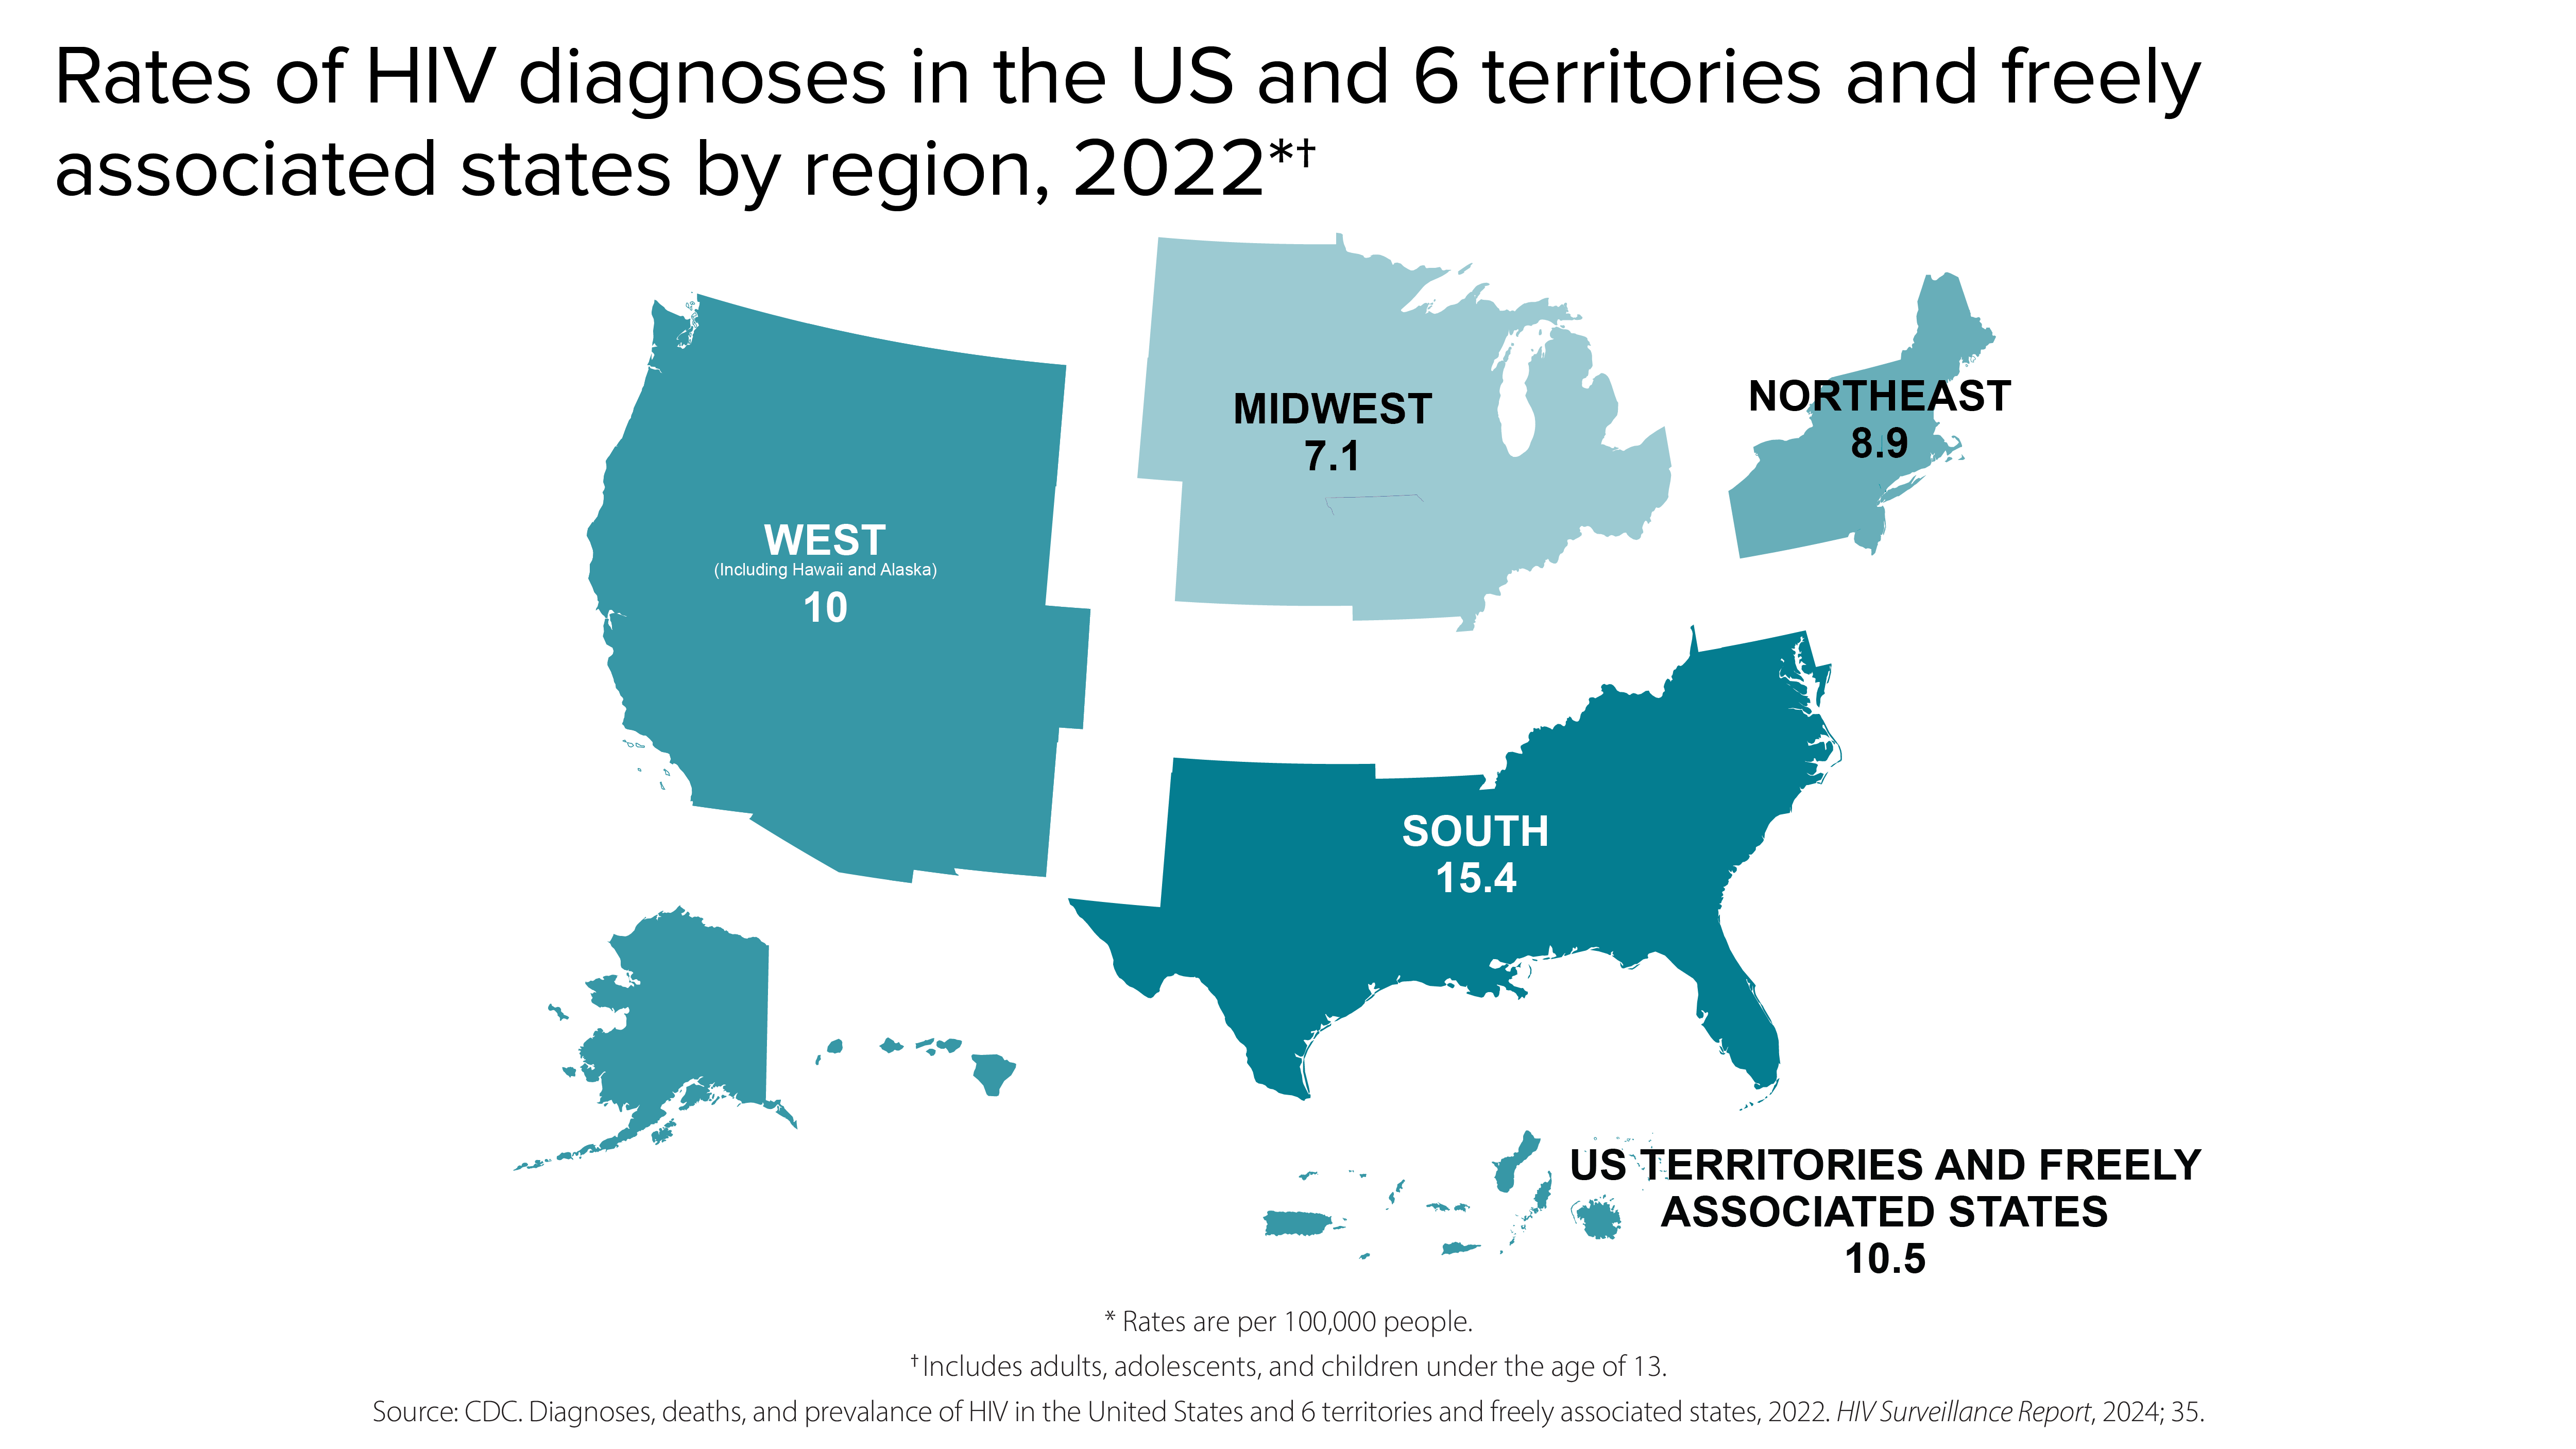
In 2022, rates of HIV diagnoses in the US and 6 territories and freely associated states by region was 15.4 in the South, 10.5 in the US territories and freely associated states, 10 in the West, 8.9 in the Northeast, and 7.1 in the Midwest.
Rates of HIV diagnoses by region.

Knowledge of status

Knowledge of status refers to the estimated percentage of people with HIV who have received an HIV diagnosis.
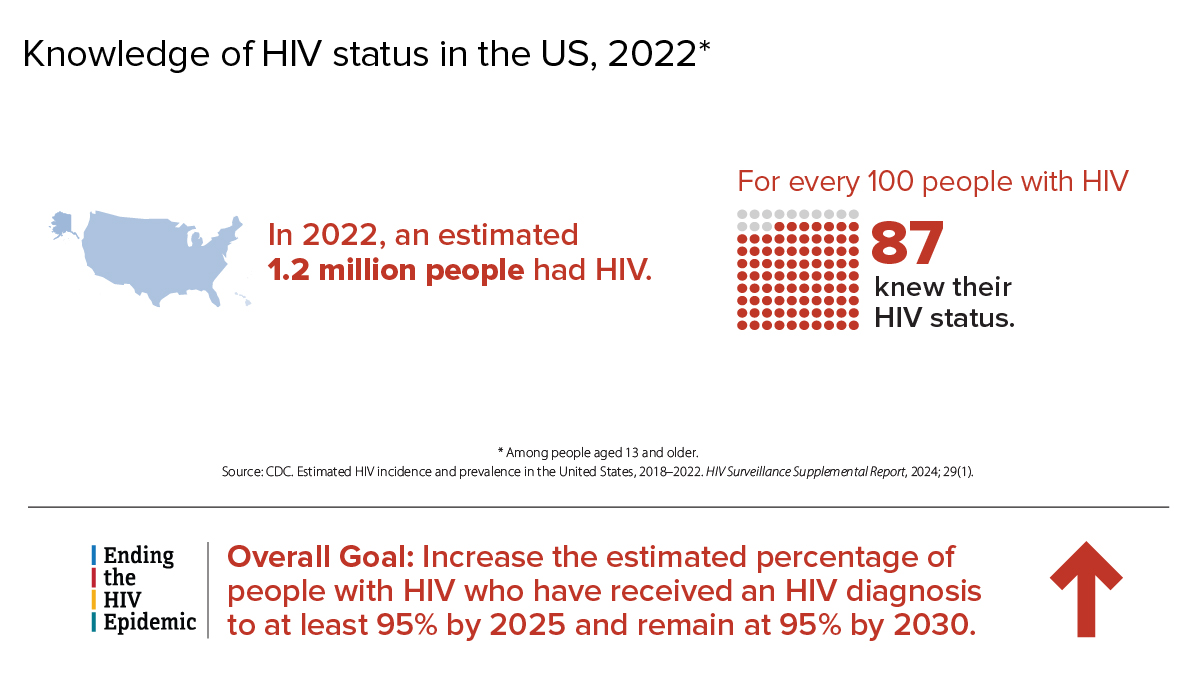
In 2022, an estimated 1.2 million people in the US had HIV. For every 100 people with HIV 87 knew their HIV status. The overall Ending the HIV Epidemic goal is to increase the estimated percentage of people with HIV who have received an HIV diagnosis to at least 95% by 2025 and remain at 95% by 2030.
Knowledge of HIV status in the US.
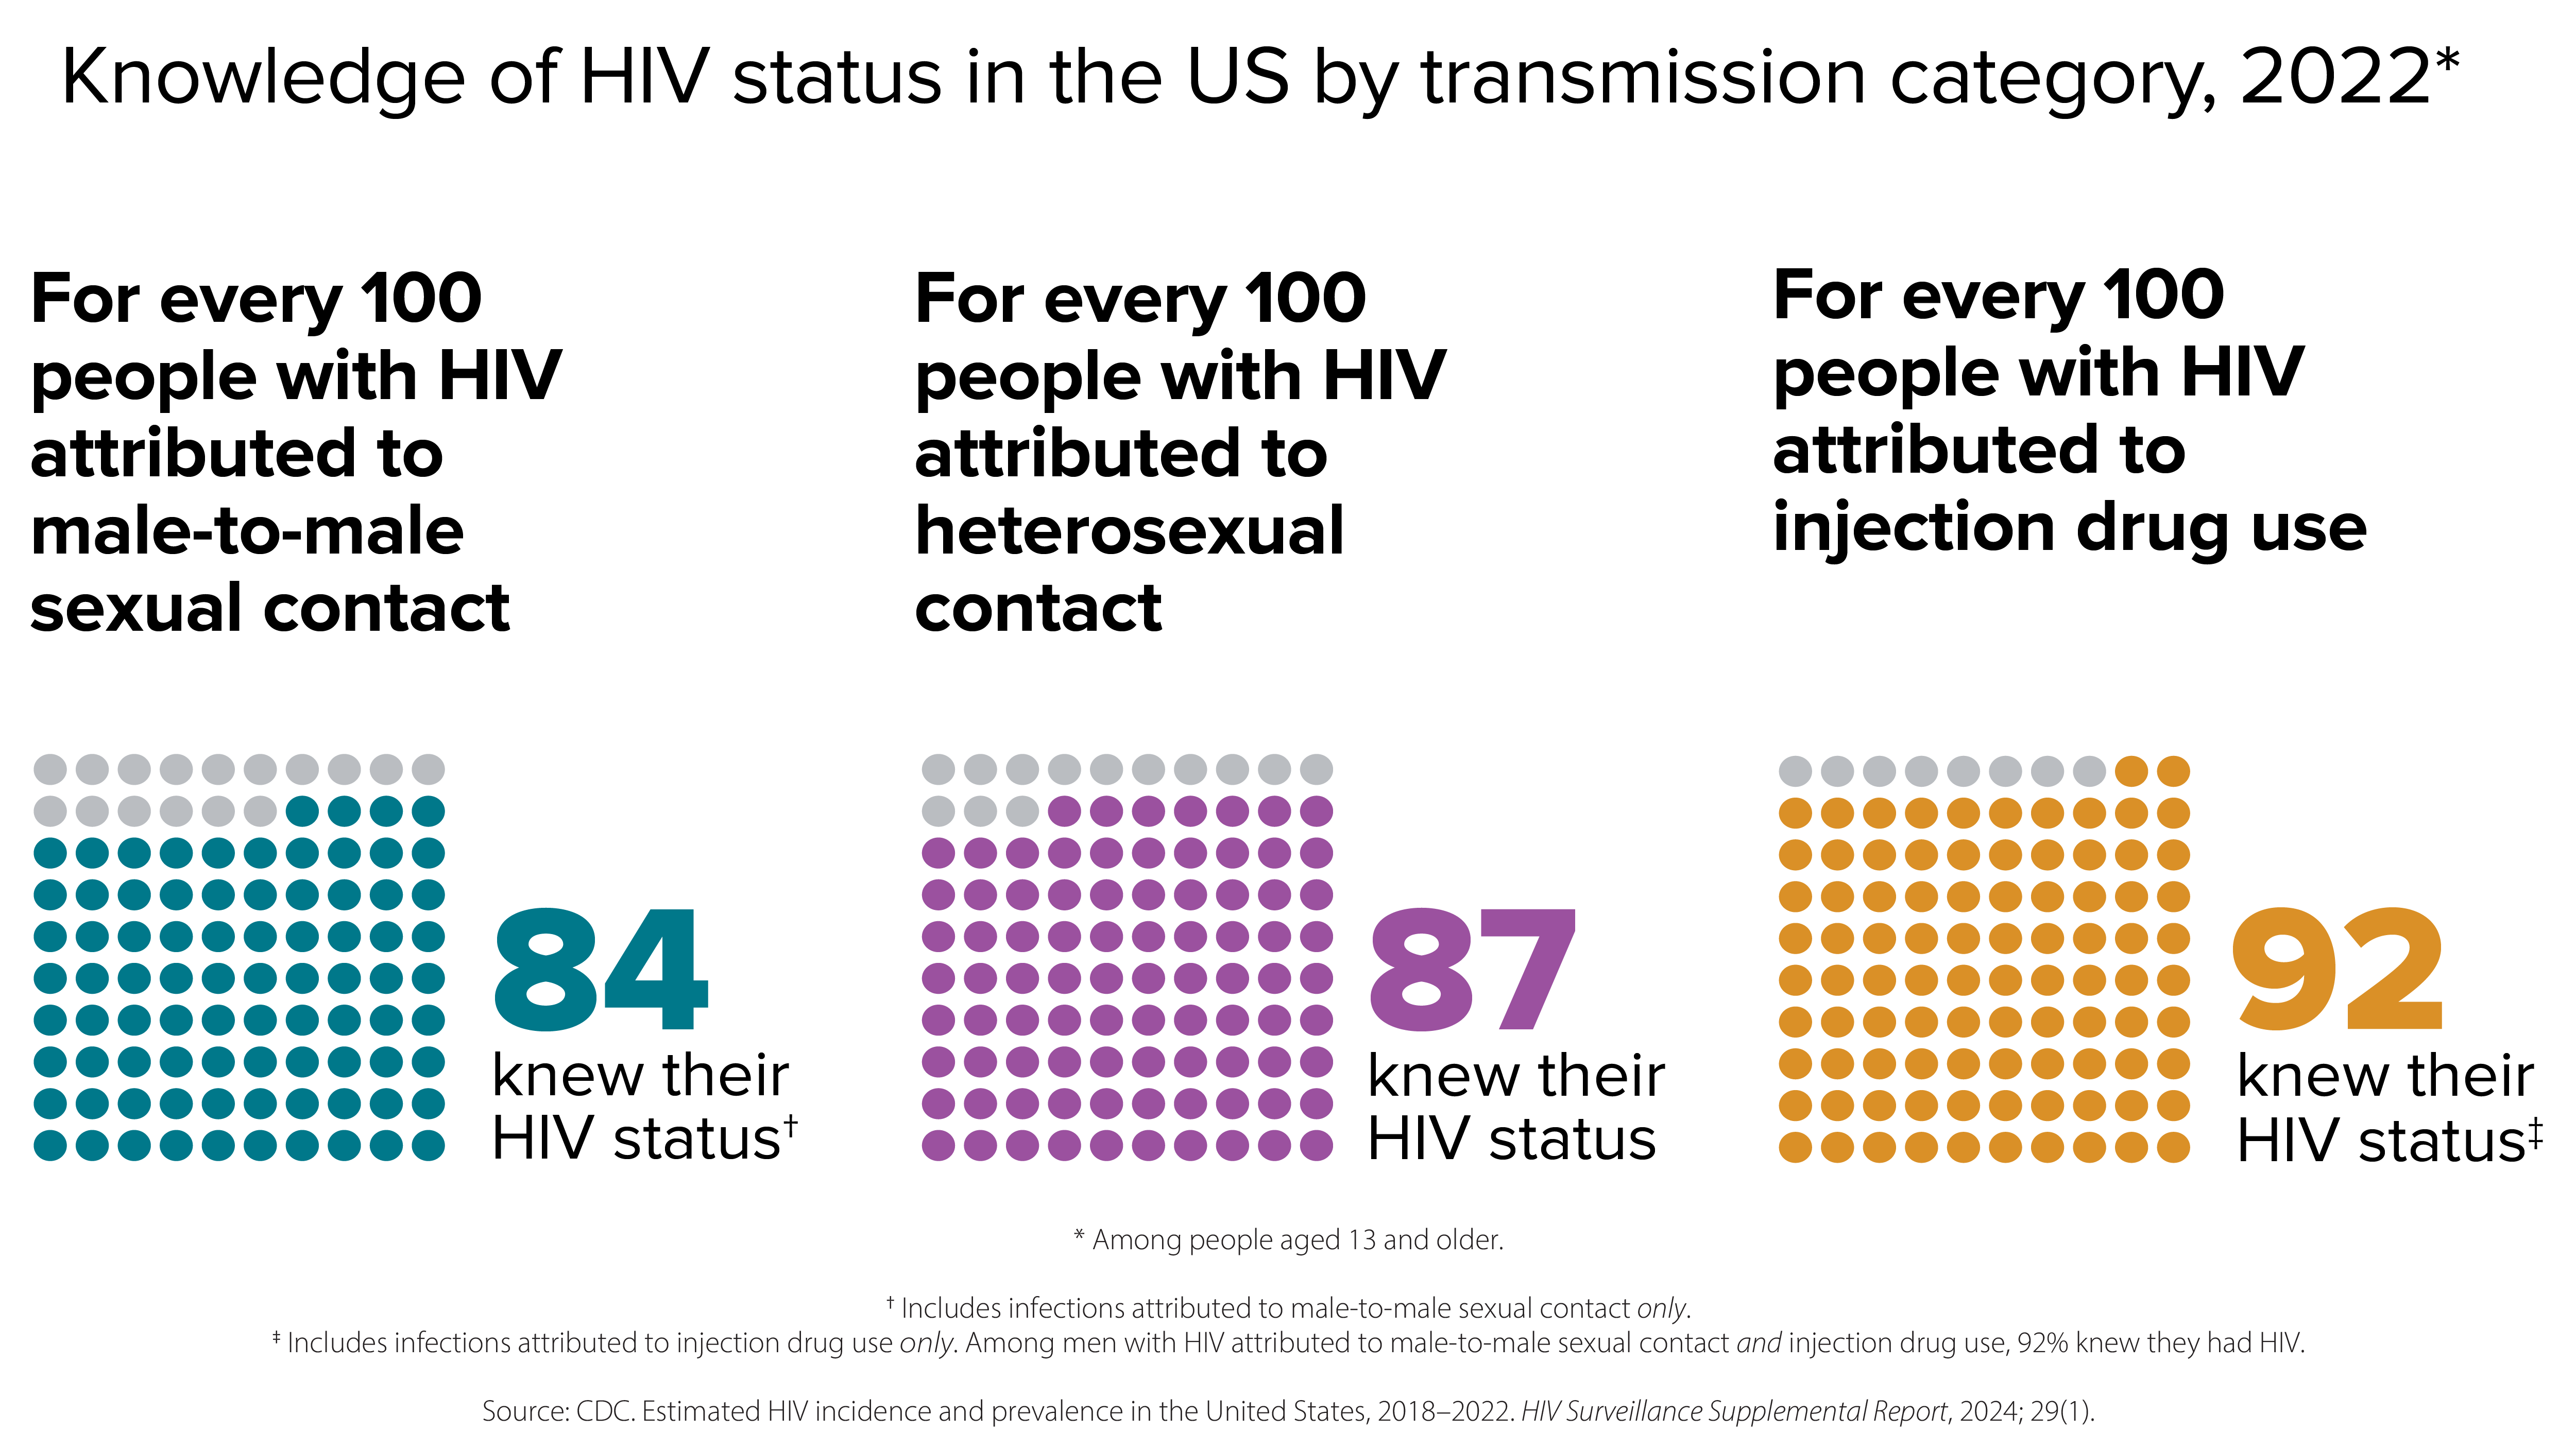
In 2022, for every 100 people with HIV attributed to male-to-male sexual contact, 84 knew their status; for every 100 people with HIV attributed to heterosexual contact, 87 knew their status; and for every 100 people with HIV attributed to injection drug use, 92 knew their status.
Knowledge of HIV status in the US by transmission category.
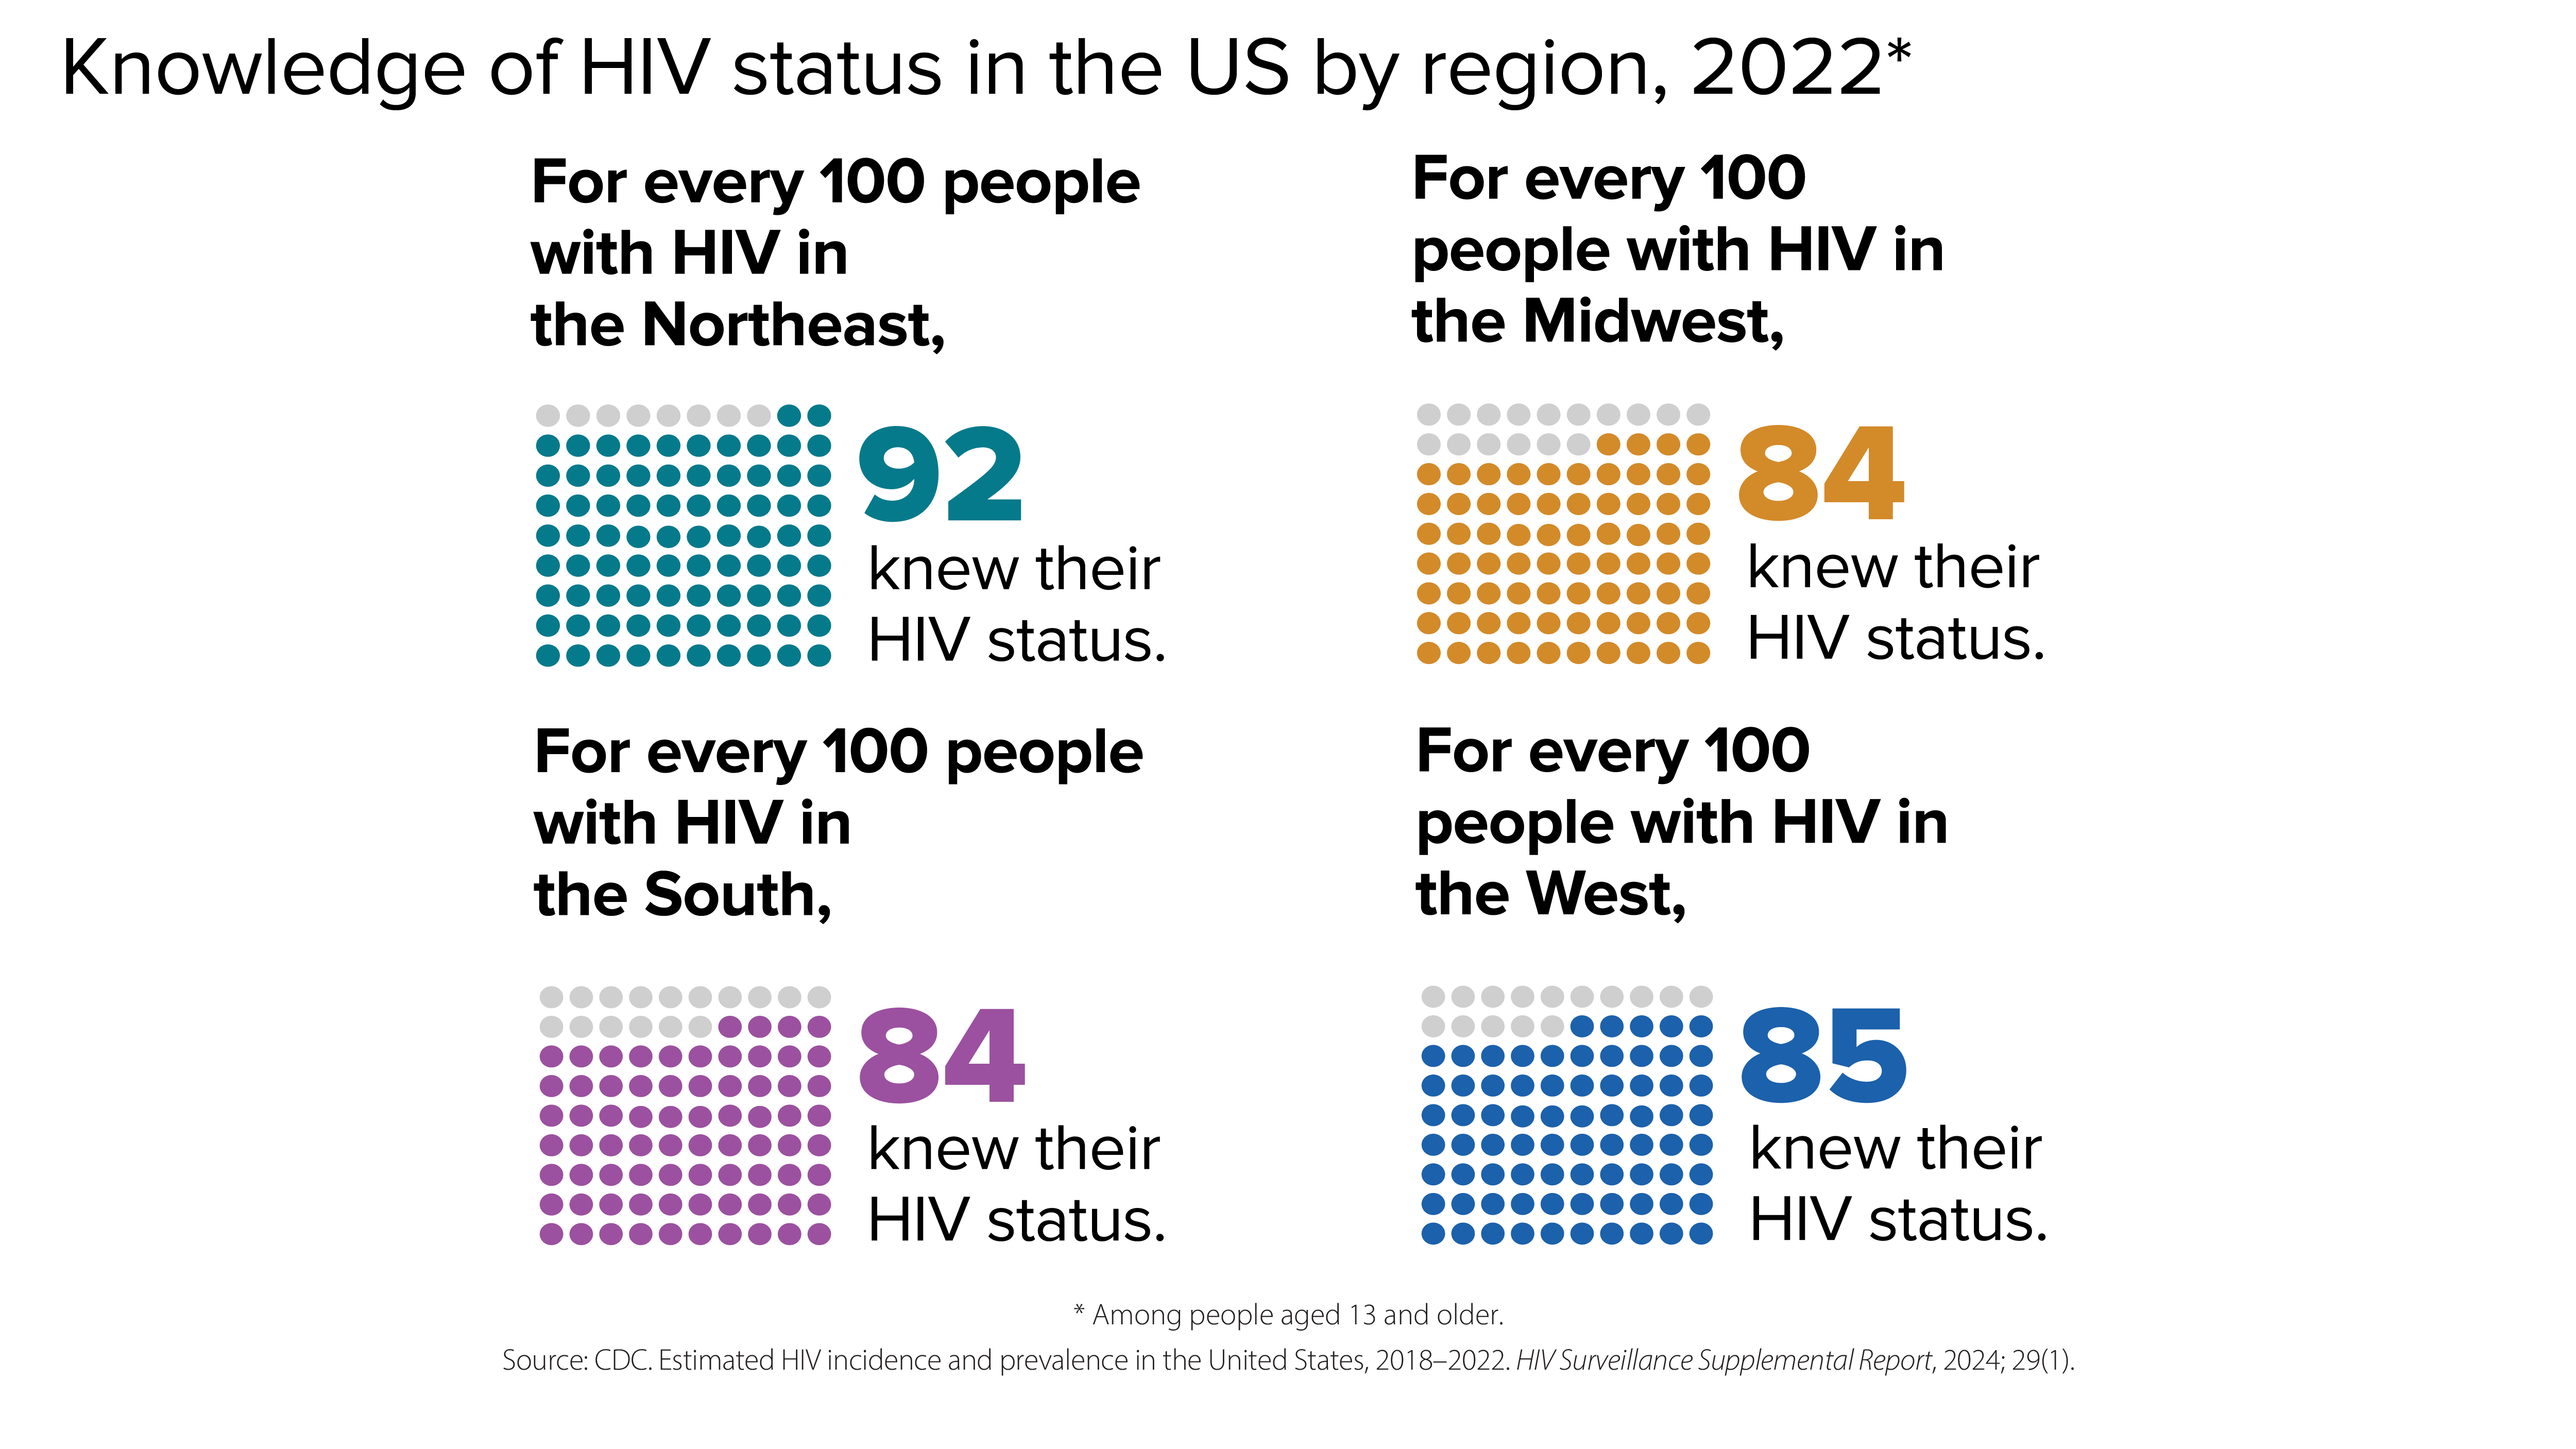
In 2022, for every 100 people with HIV in the Northeast, 92 knew their status; for every 100 people with HIV in the Midwest, 84 knew their status; for every 100 people with HIV in the South, 84 knew their status; and for every 100 people with HIV in the West, 85 knew their status.
Knowledge of HIV status in the US by region.

PrEP coverage

CDC has paused PrEP (pre-exposure prophylaxis) coverage reporting to determine the best methodology for calculating PrEP coverage, and to update PrEP coverage estimates using updated methods and sources. CDC plans to resume PrEP coverage reporting in the next HIV Monitoring Report for all demographic groups, currently scheduled for publication in June 2025. Until updated PrEP coverage estimates are published, CDC advises against citing specific PrEP coverage data points, as historical estimates will be updated.

Viral suppression and barriers to care

Viral suppression refers to the percentage of people with diagnosed HIV who have less than 200 copies of HIV per milliliter of blood.
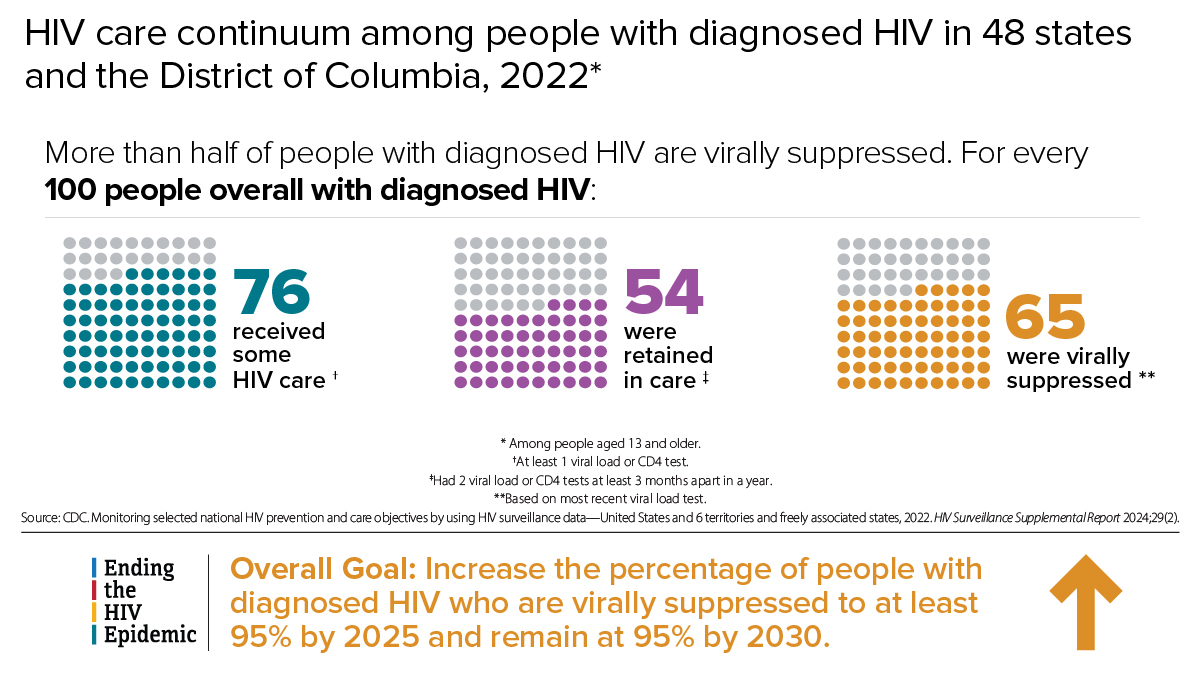
More than half of people with diagnosed HIV are virally suppressed. For every 100 people overall with diagnosed HIV, 76 received some care, 54 were retained in care, and 65 were virally suppressed. The overall Ending the HIV Epidemic goal is to increase the percentage of people with diagnosed HIV who are virally suppressed to at least 95% by 2025 and remain at 95% by 2030.
HIV care among people with diagnosed HIV.
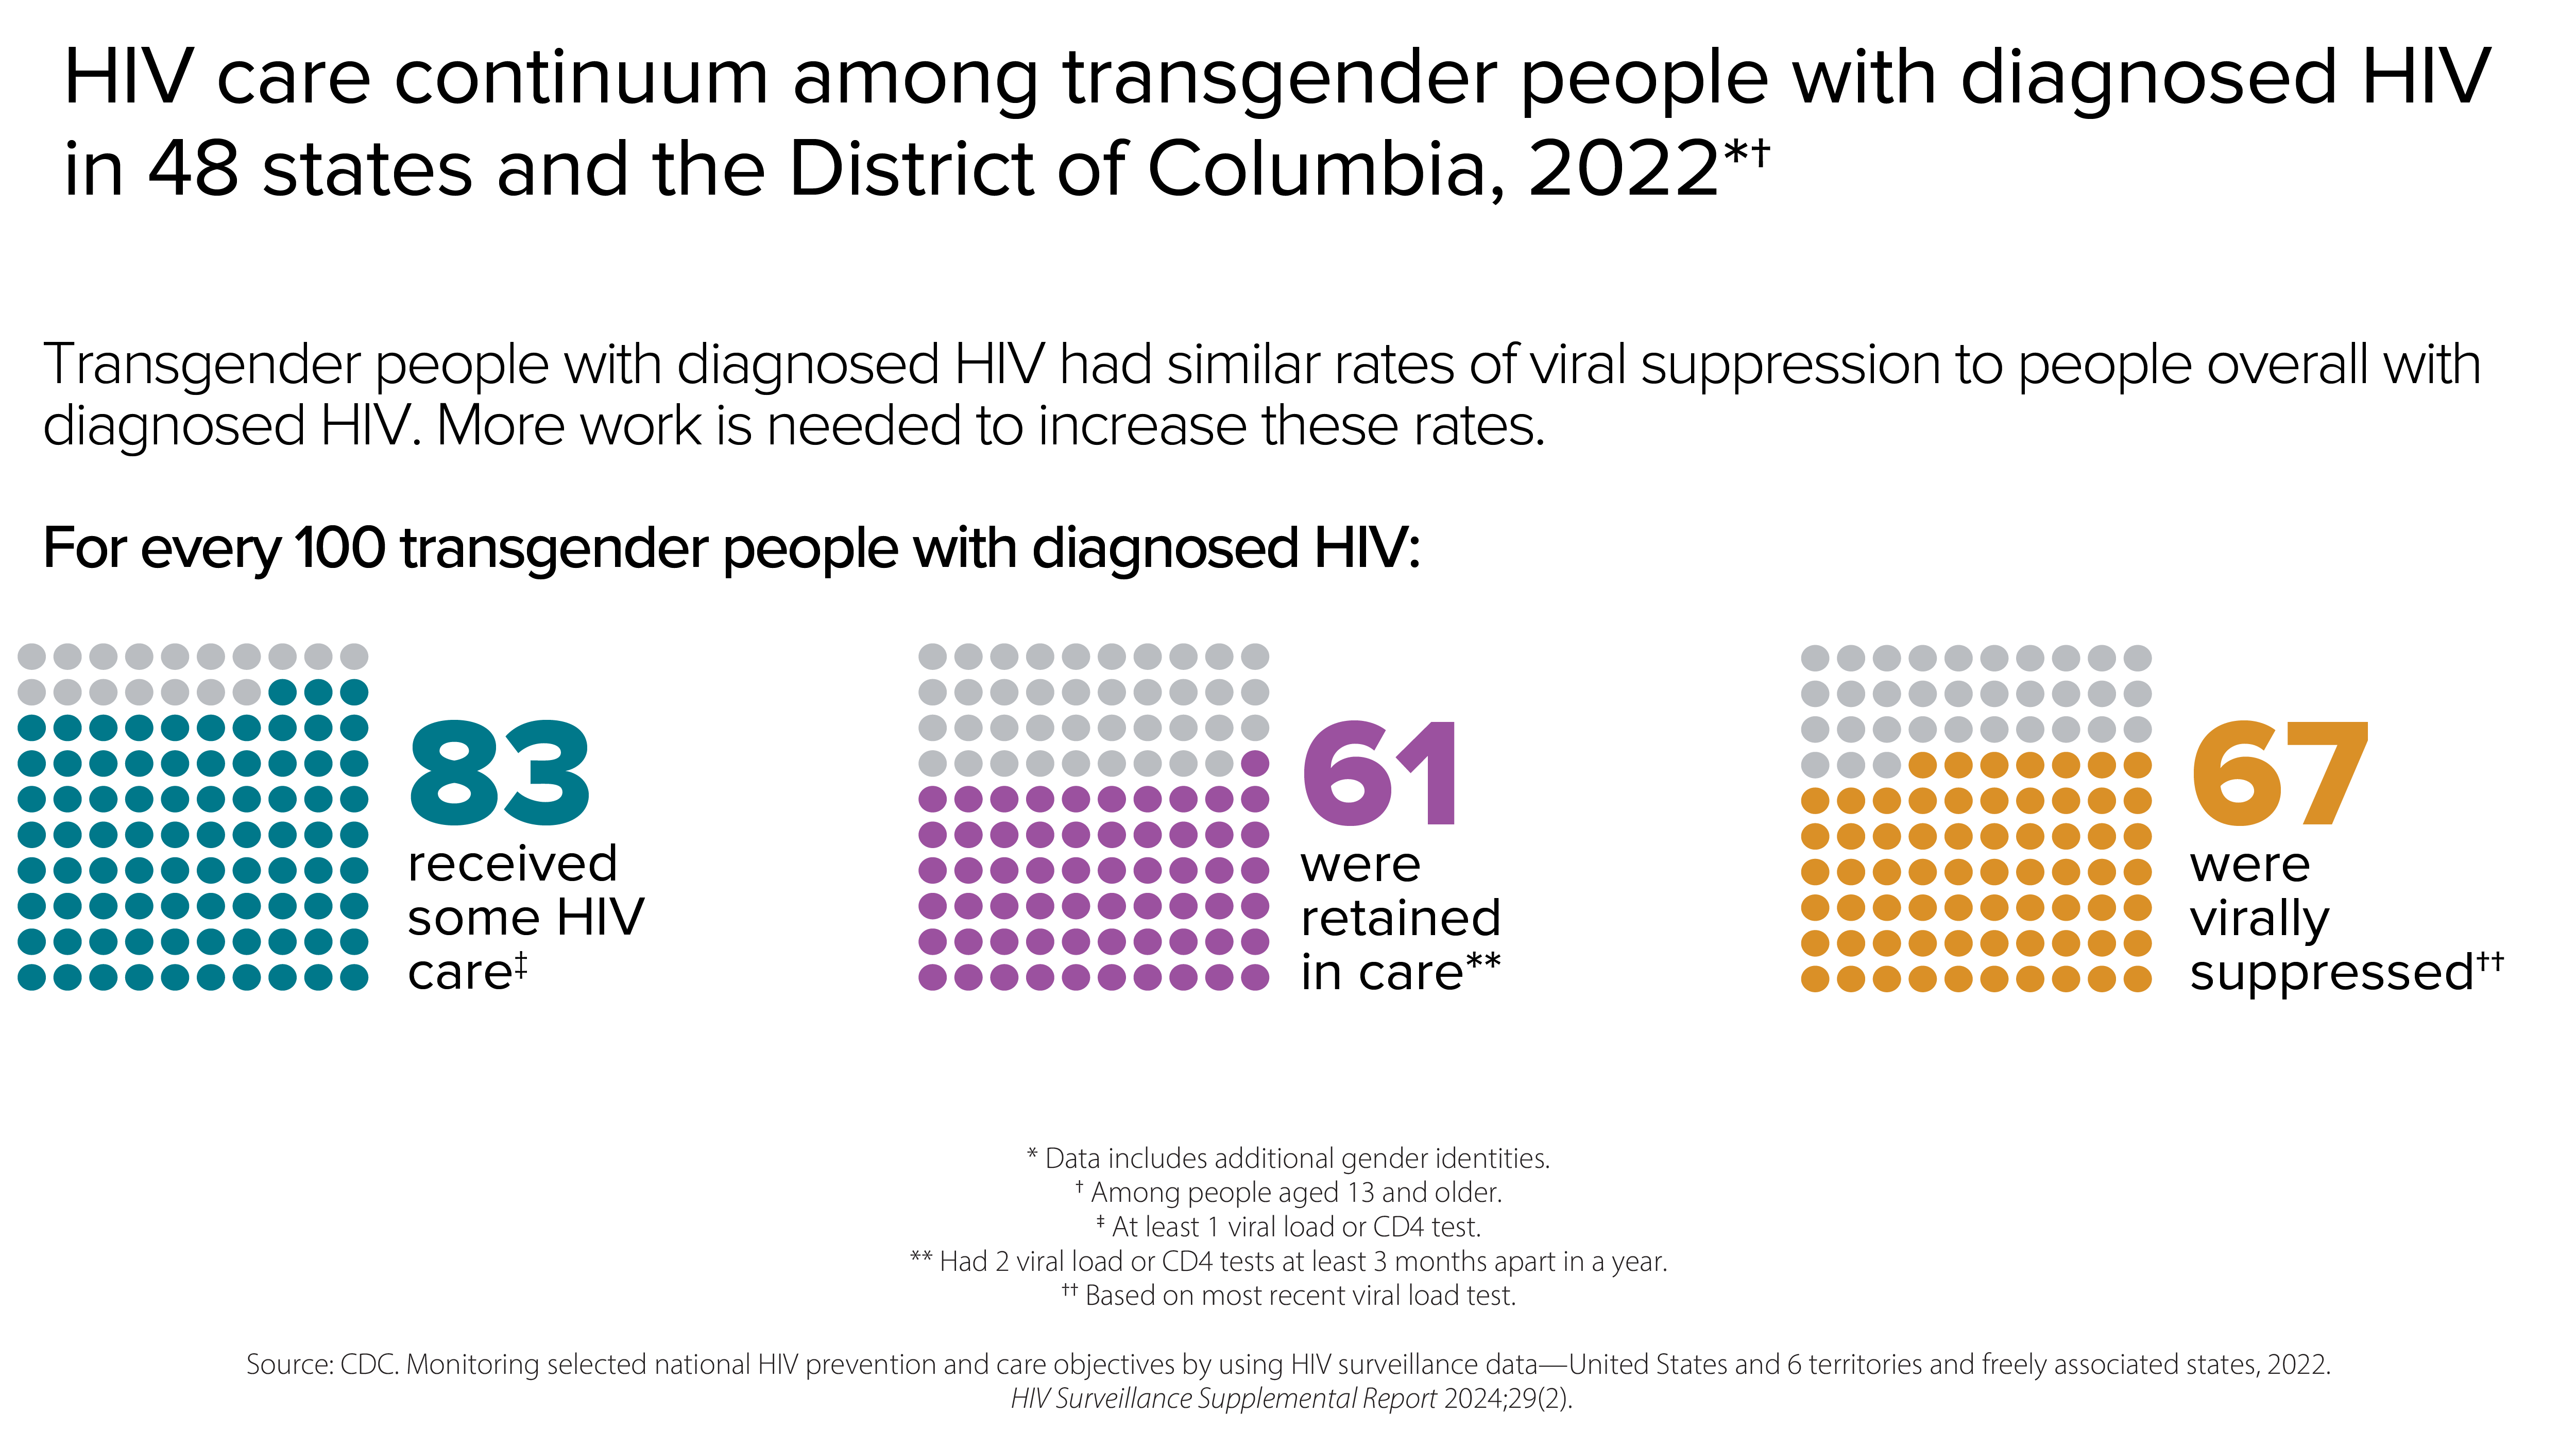
In 2022, transgender people with diagnosed HIV had similar rates of viral suppression to people overall with diagnosed HV. More work is needed to increase these rates. That year, for every 100 transgender people with diagnosed HIV, 83 received some HIV care, 61 were retained in care, and 67 were virally suppressed.
HIV care among transgender people with diagnosed HIV.
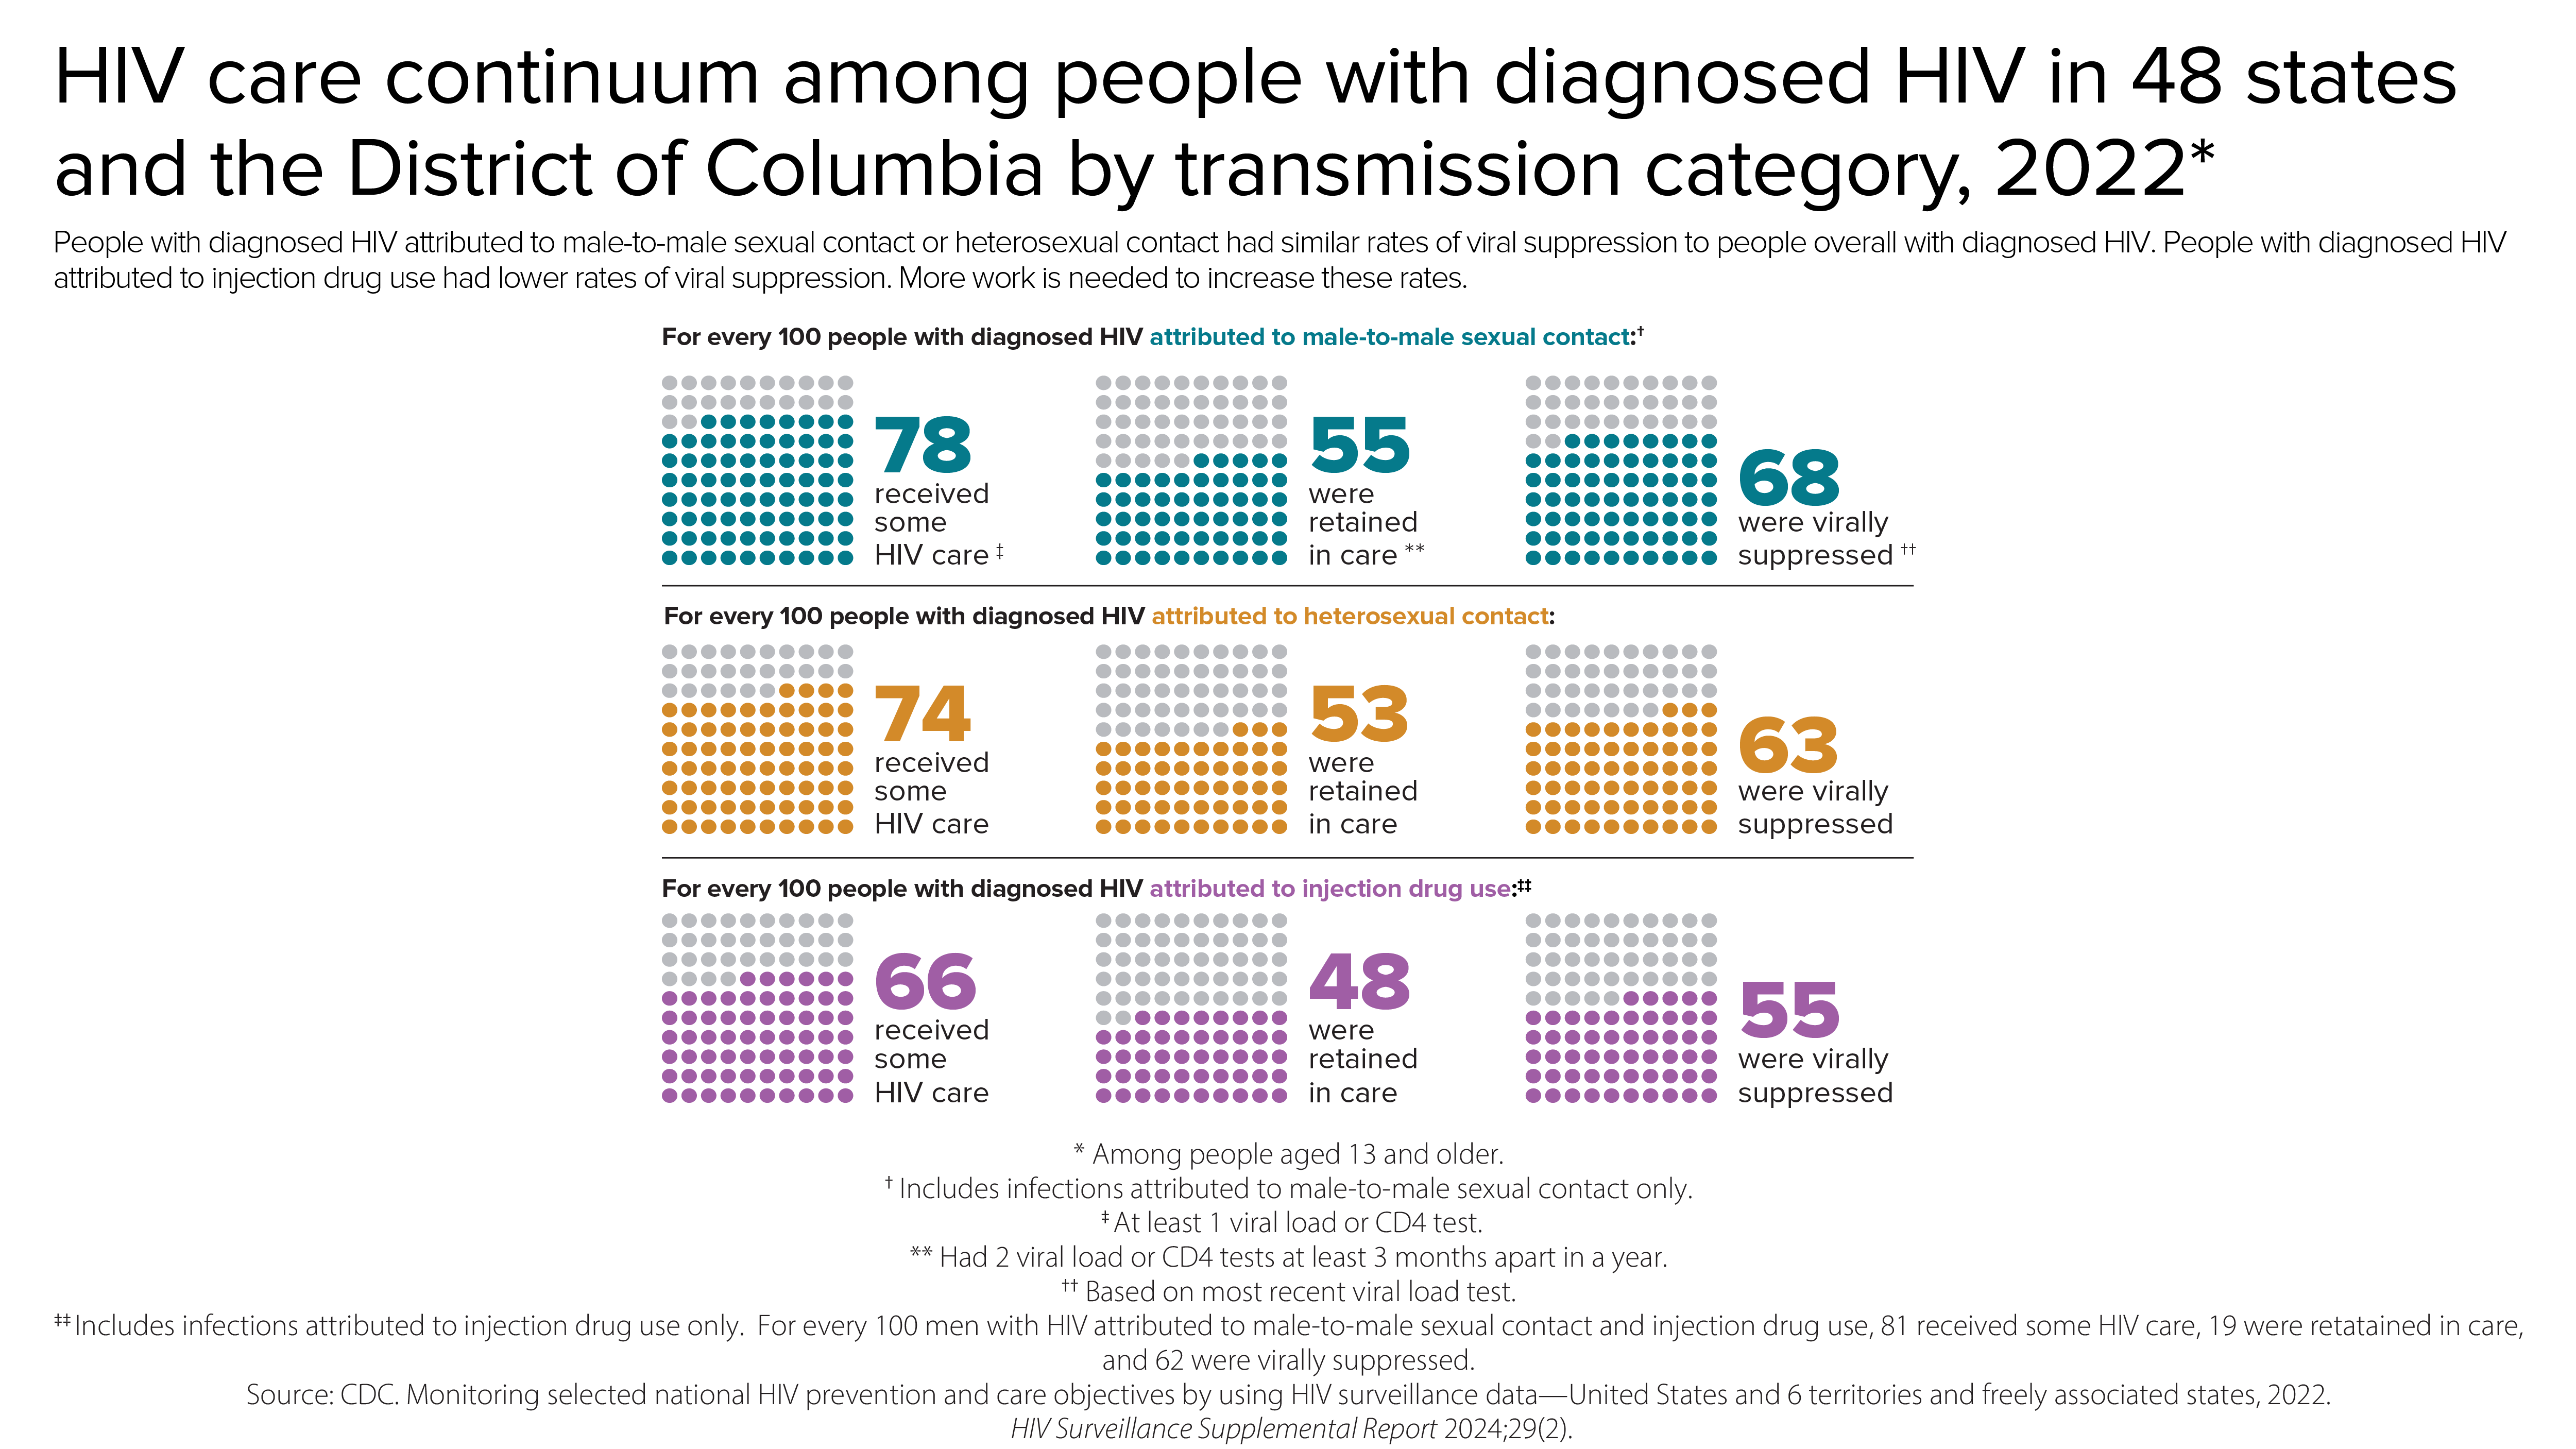
In 2022, for every 100 people with diagnosed HIV attributed to male-to-male sexual contact, 78 received some HIV care, 55 were retained in care, and 68 were virally suppressed; for every 100 people with diagnosed HIV attributed to heterosexual contact, 74 received some HIV care, 53 were retained in care, and 63 were virally suppressed; and for every 100 people with diagnosed HIV attributed to injection drug use, 66 received some HIV care, 48 were retained in care, and 55 were virally suppressed.
HIV care among with diagnosed HIV by transmission category.
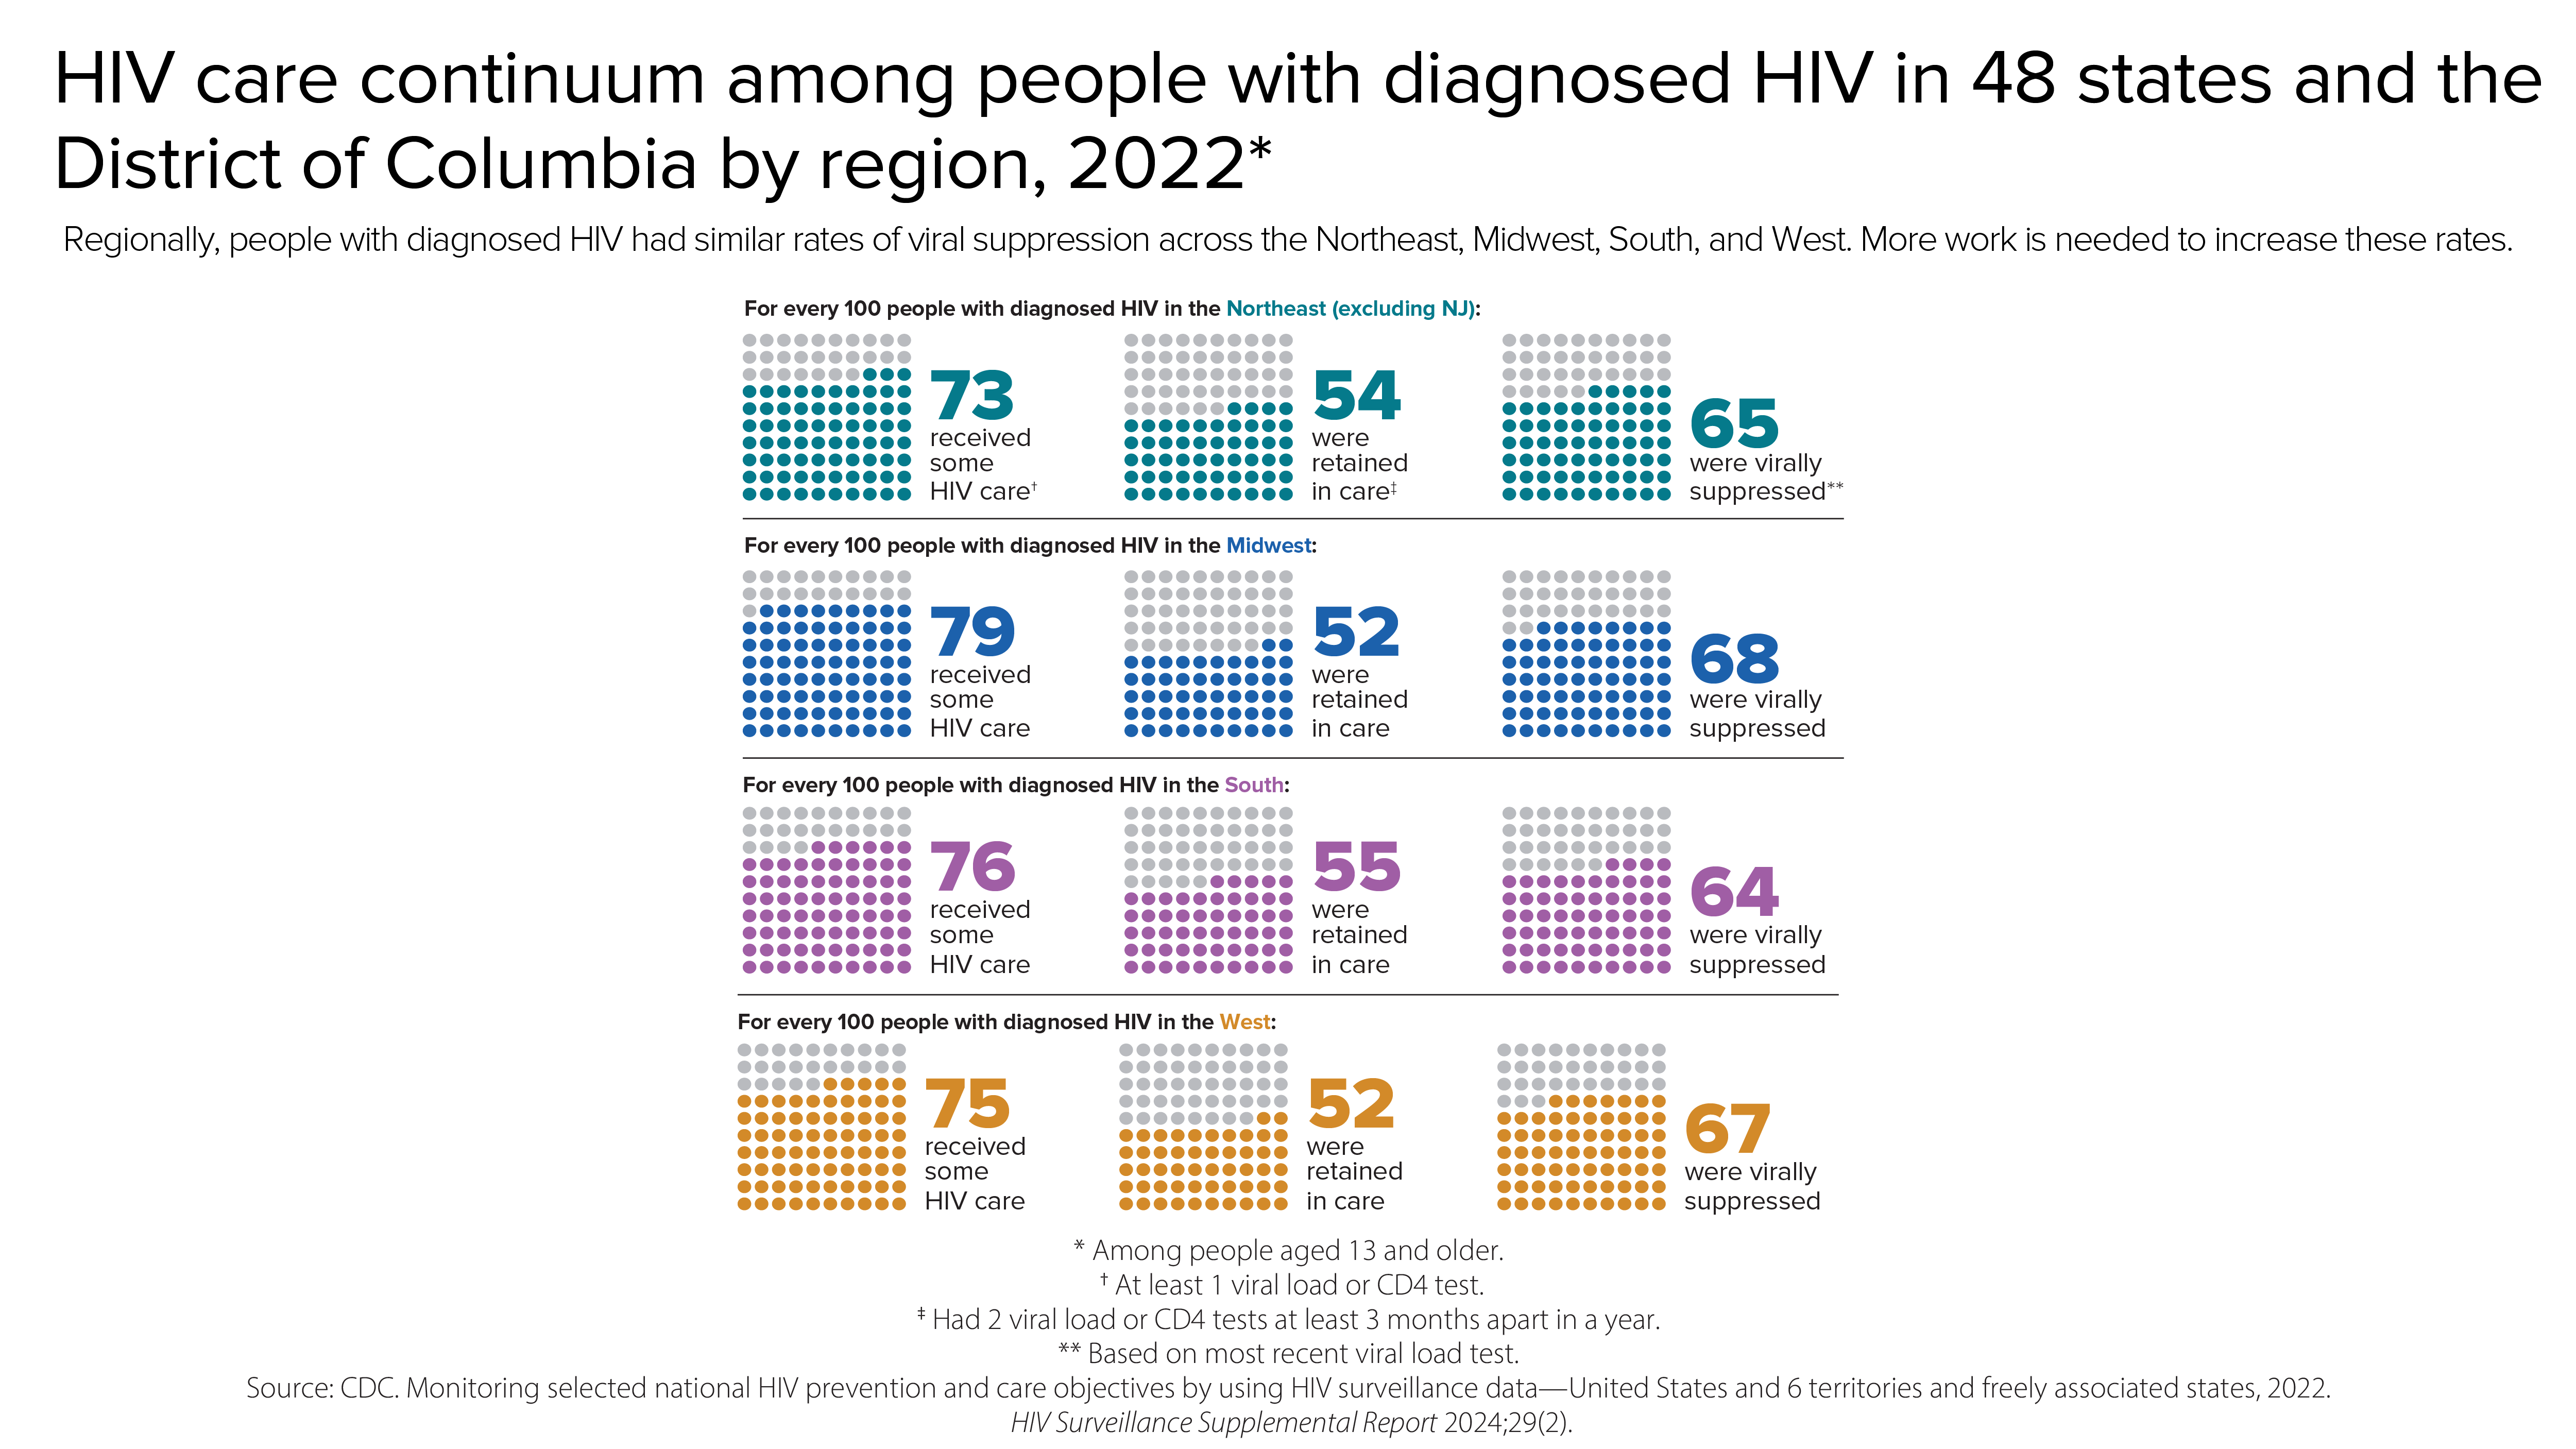
In 2022, for every 100 people with diagnosed HIV in the Northeast, 73 received some HIV care, 54 were retained in care, and 65 were virally suppressed; for every 100 people with diagnosed HIV in the Midwest, 79 received some HIV care, 52 were retained in care, and 68 were virally suppressed; for every 100 people with diagnosed HIV in the South, 76 received some HIV care, 55 were retained in care, and 64 were virally suppressed; and for every 100 people with diagnosed HIV in the West, 75 received some HIV care, 52 were retained in care, and 67 were virally suppressed.
HIV care among people with diagnosed HIV by region.
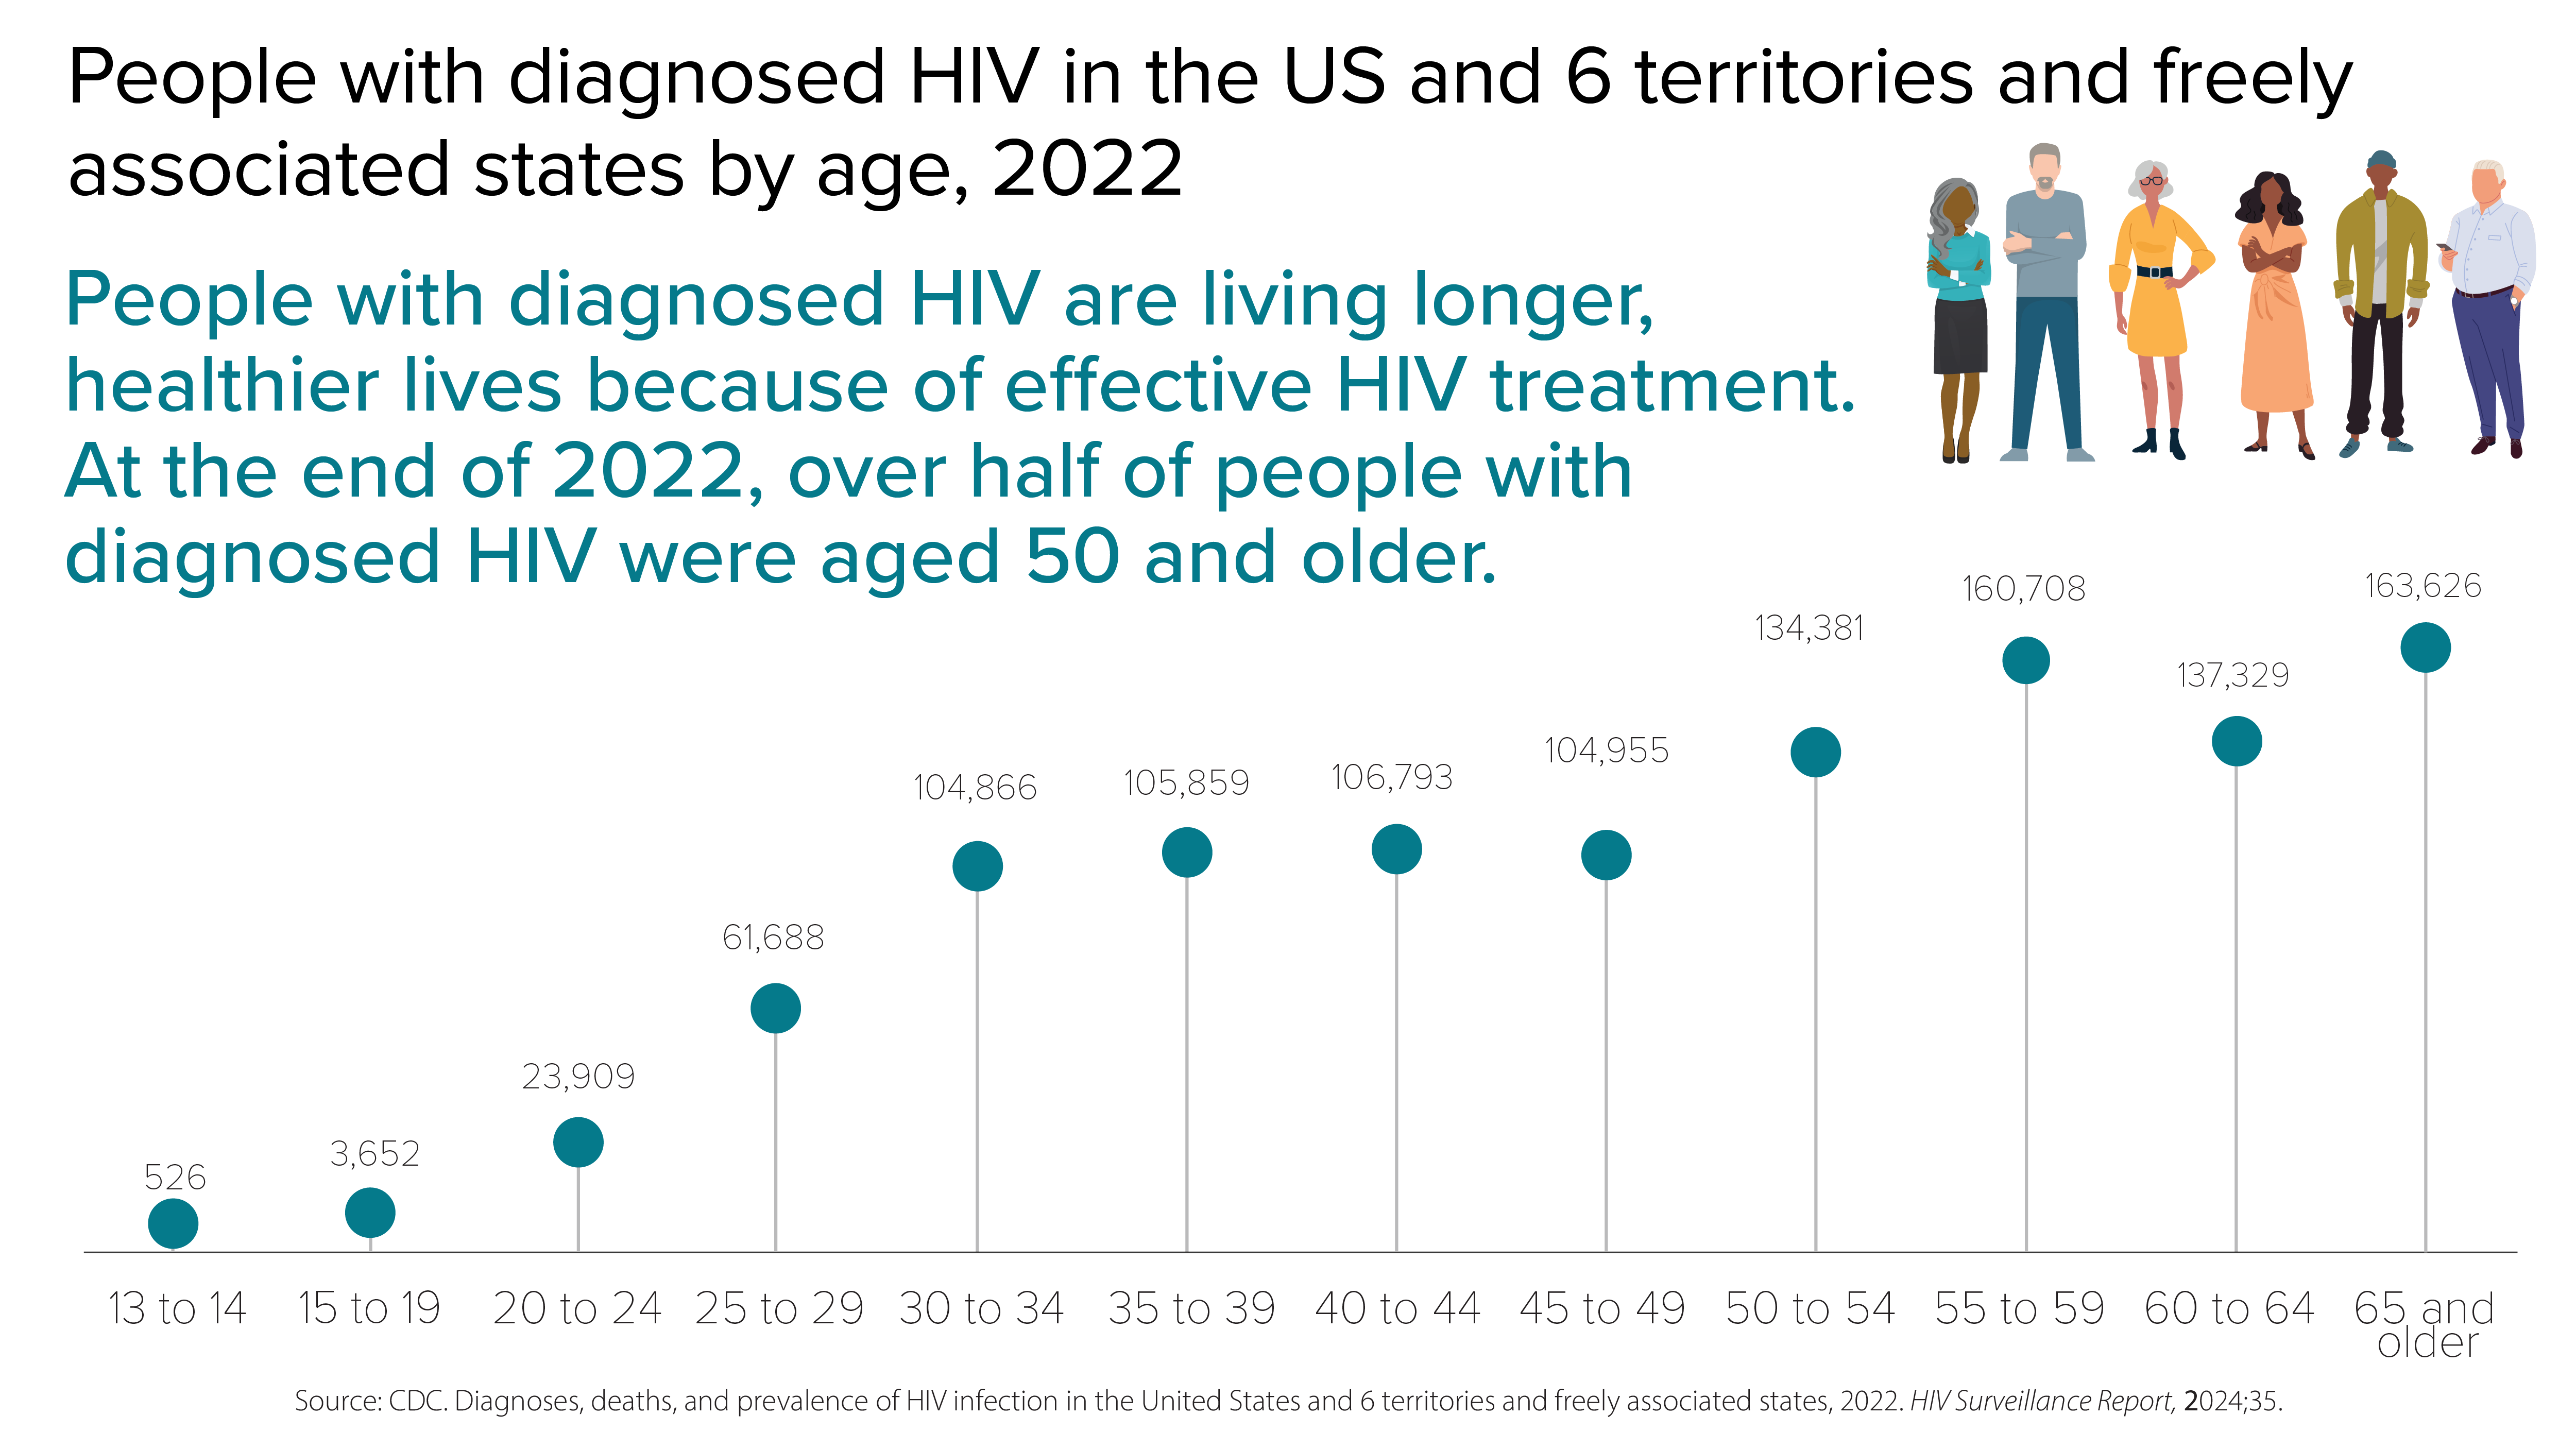
People with diagnosed HIV are living longer, healthier lives because of effective HIV treatment. At the end of 2022, over half of people with diagnosed HIV were aged 50 and older. Of people aged 13 to 14, 526 were diagnosed with HIV; of people aged 15 to 19, 3,652 were diagnosed with HIV; of people aged 20 to 24, 23,909 were diagnosed with HIV; of people aged 25 to 29, 61,688 were diagnosed with HIV; of people aged 30 to 34, 104,866 were diagnosed with HIV; of people aged 35 to 39, 105,859 were diagnosed with HIV; of people aged 40 to 44, 106,793 were diagnosed with HIV; of people aged 45 to 49, 104,955 were diagnosed with HIV; of people aged 50 to 54, 134,381 were diagnosed with HIV; of people aged 55 to 59, 160,708 were diagnosed with HIV; of people aged 60 to 64, 137,329 were diagnosed with HIV; and of people aged 65 and older, 163,626 were diagnosed with HIV.
People with diagnosed HIV by age.

Most HIV cases occur in metropolitan areas with 500,000 or more people. The South has the highest number of people with HIV, but if population size is taken into account, the Northeast has the highest rate of people with HIV.
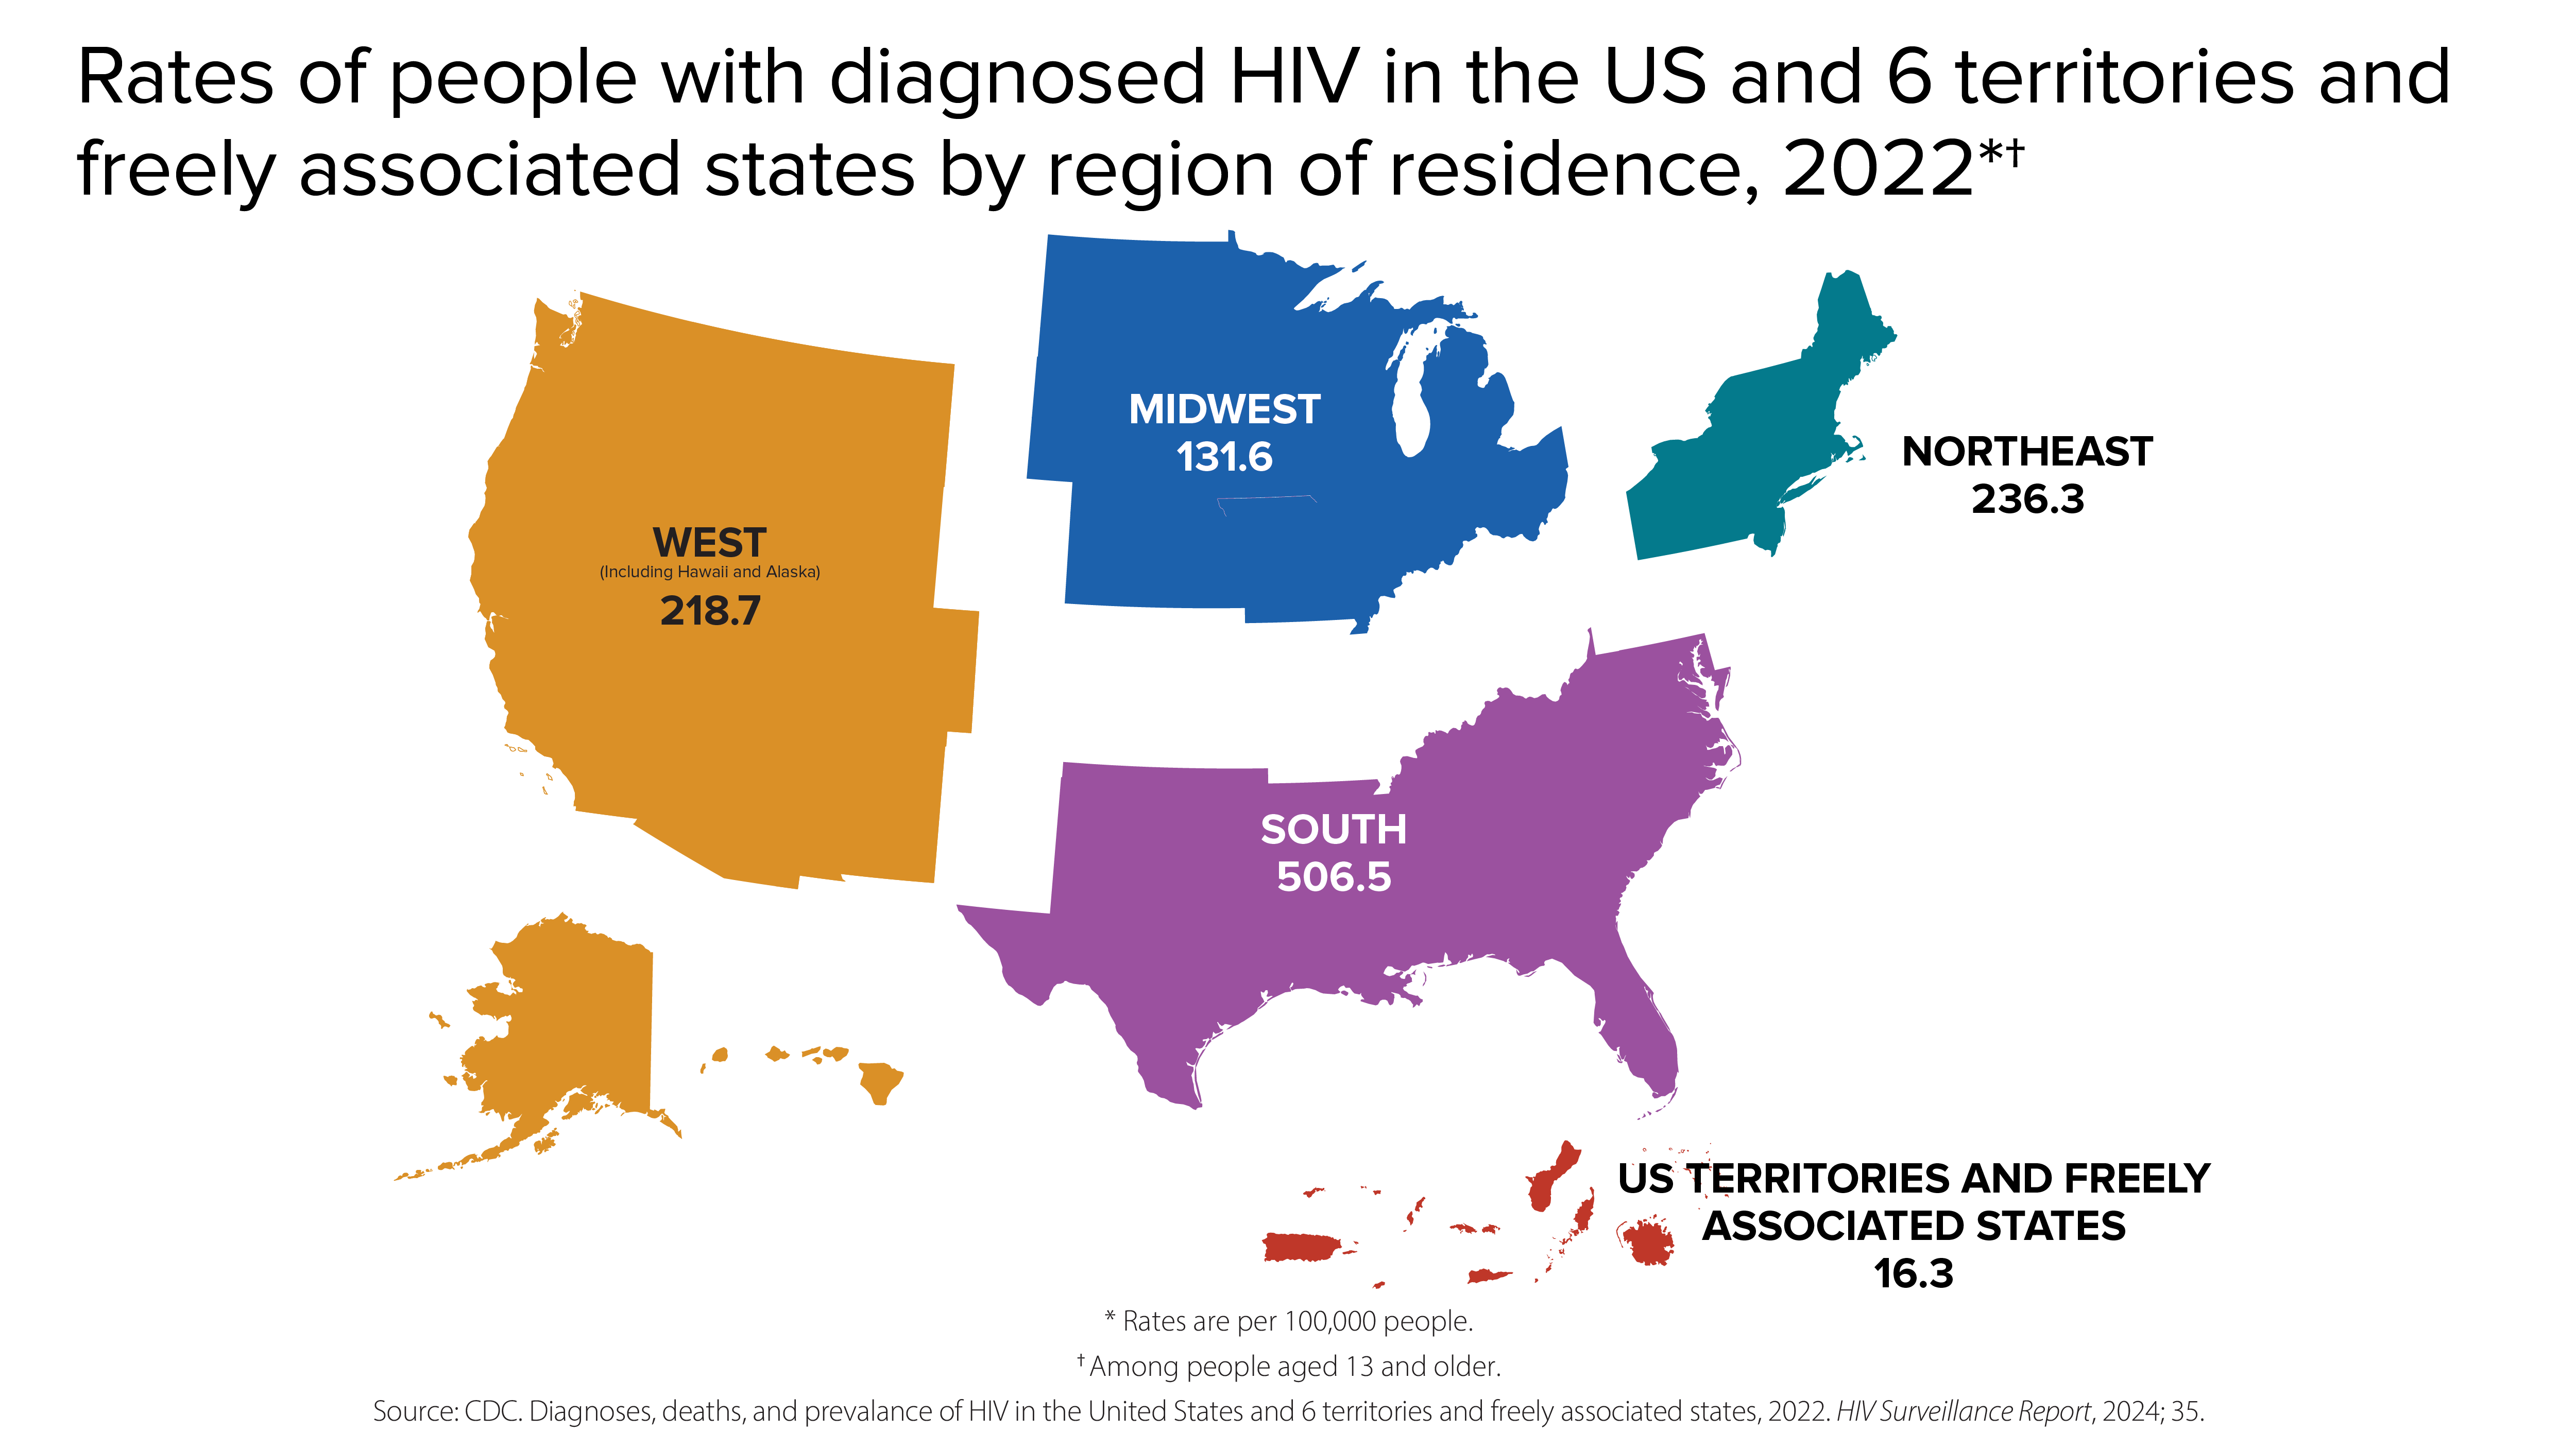
In 2022, the rates of people with diagnosed HIV in the US and 6 territories and freely associated states by region varied: The rate of HIV diagnosis in the South was 506.5, the rate in the Northeast was 236.3, the rate in the West was 218.7, the rate in the Midwest was 131.6, and the rate in the US territories and freely associated states was 16.3.
Rates of people with diagnosed HIV by region of residence.

Although many people taking HIV medicine are virally suppressed, some people with HIV are currently not virally suppressed or do not maintain viral suppression over time. Some challenges with achieving and maintaining viral suppression include HIV stigma, physical health, mental health, and structural issues—such as food insecurity, unemployment, and unstable housing or homelessness.
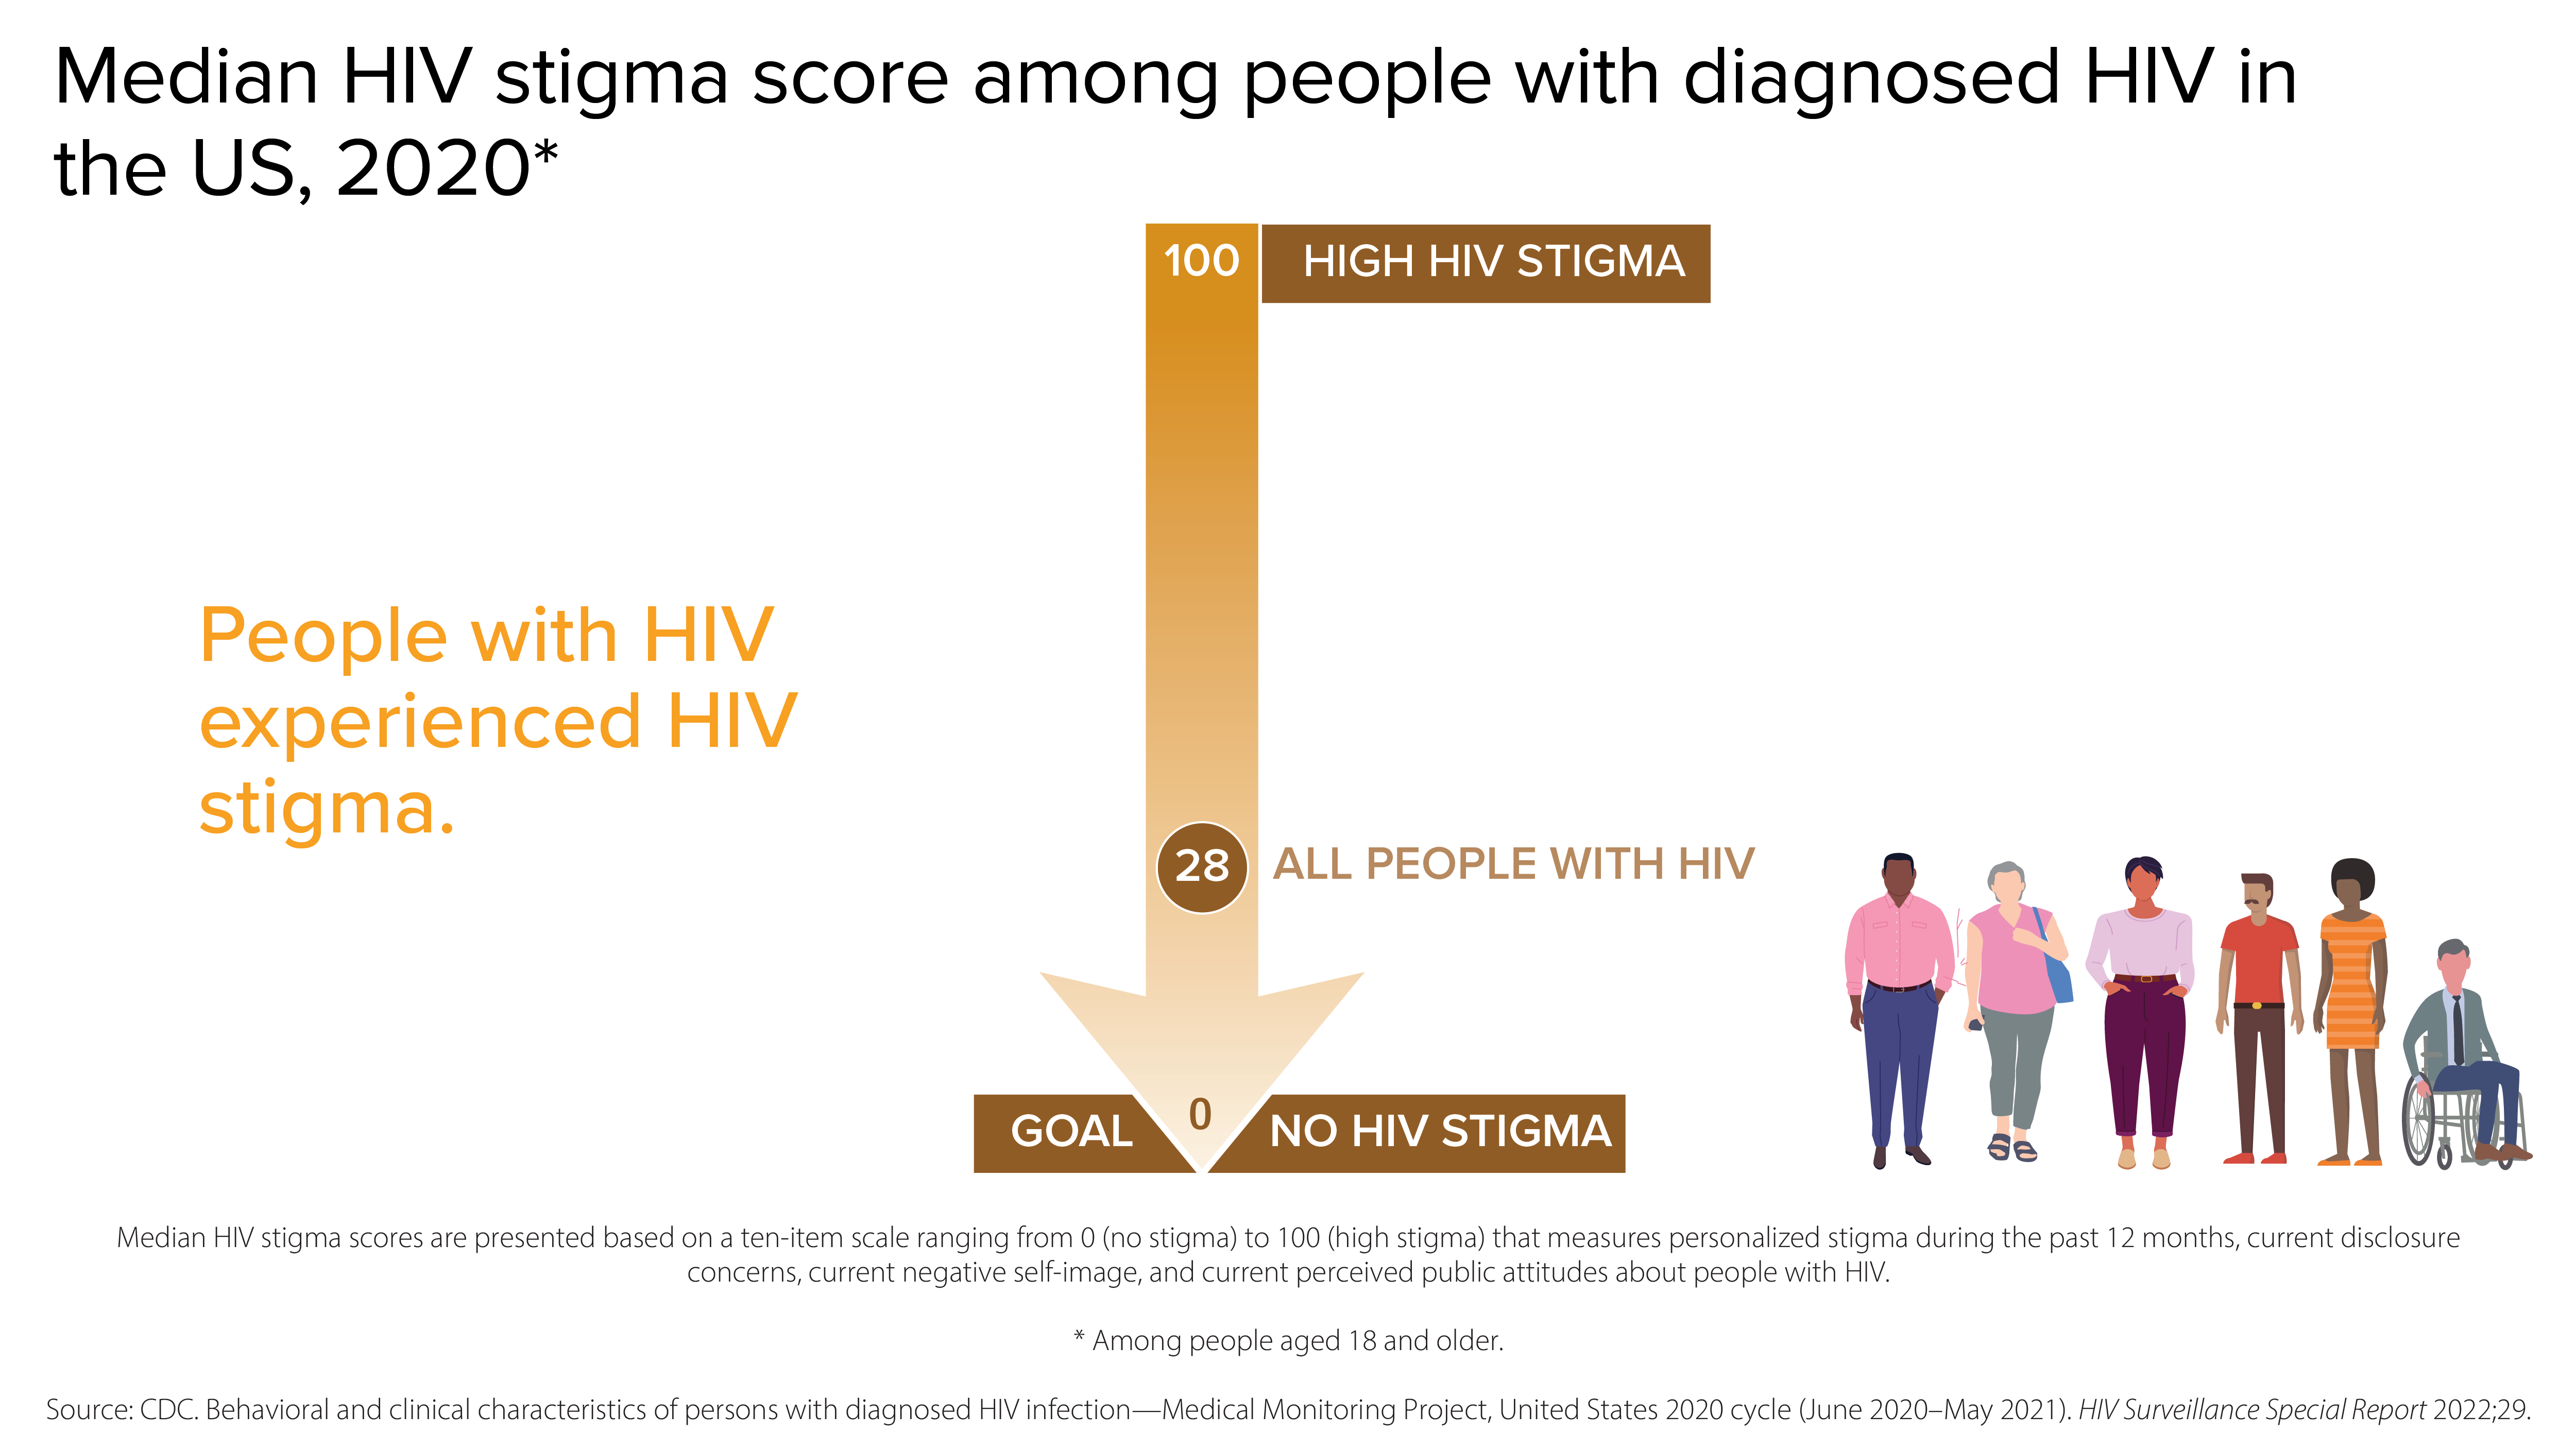
People with HIV experienced HIV stigma. Among people with diagnosed HIV in the US in 2020, on a scale where 100 represents high HIV stigma and 0 represents no HIV stigma, all people with HIV experienced HIV stigma at a median score of 28.
Median HIV stigma score among people with diagnosed HIV.
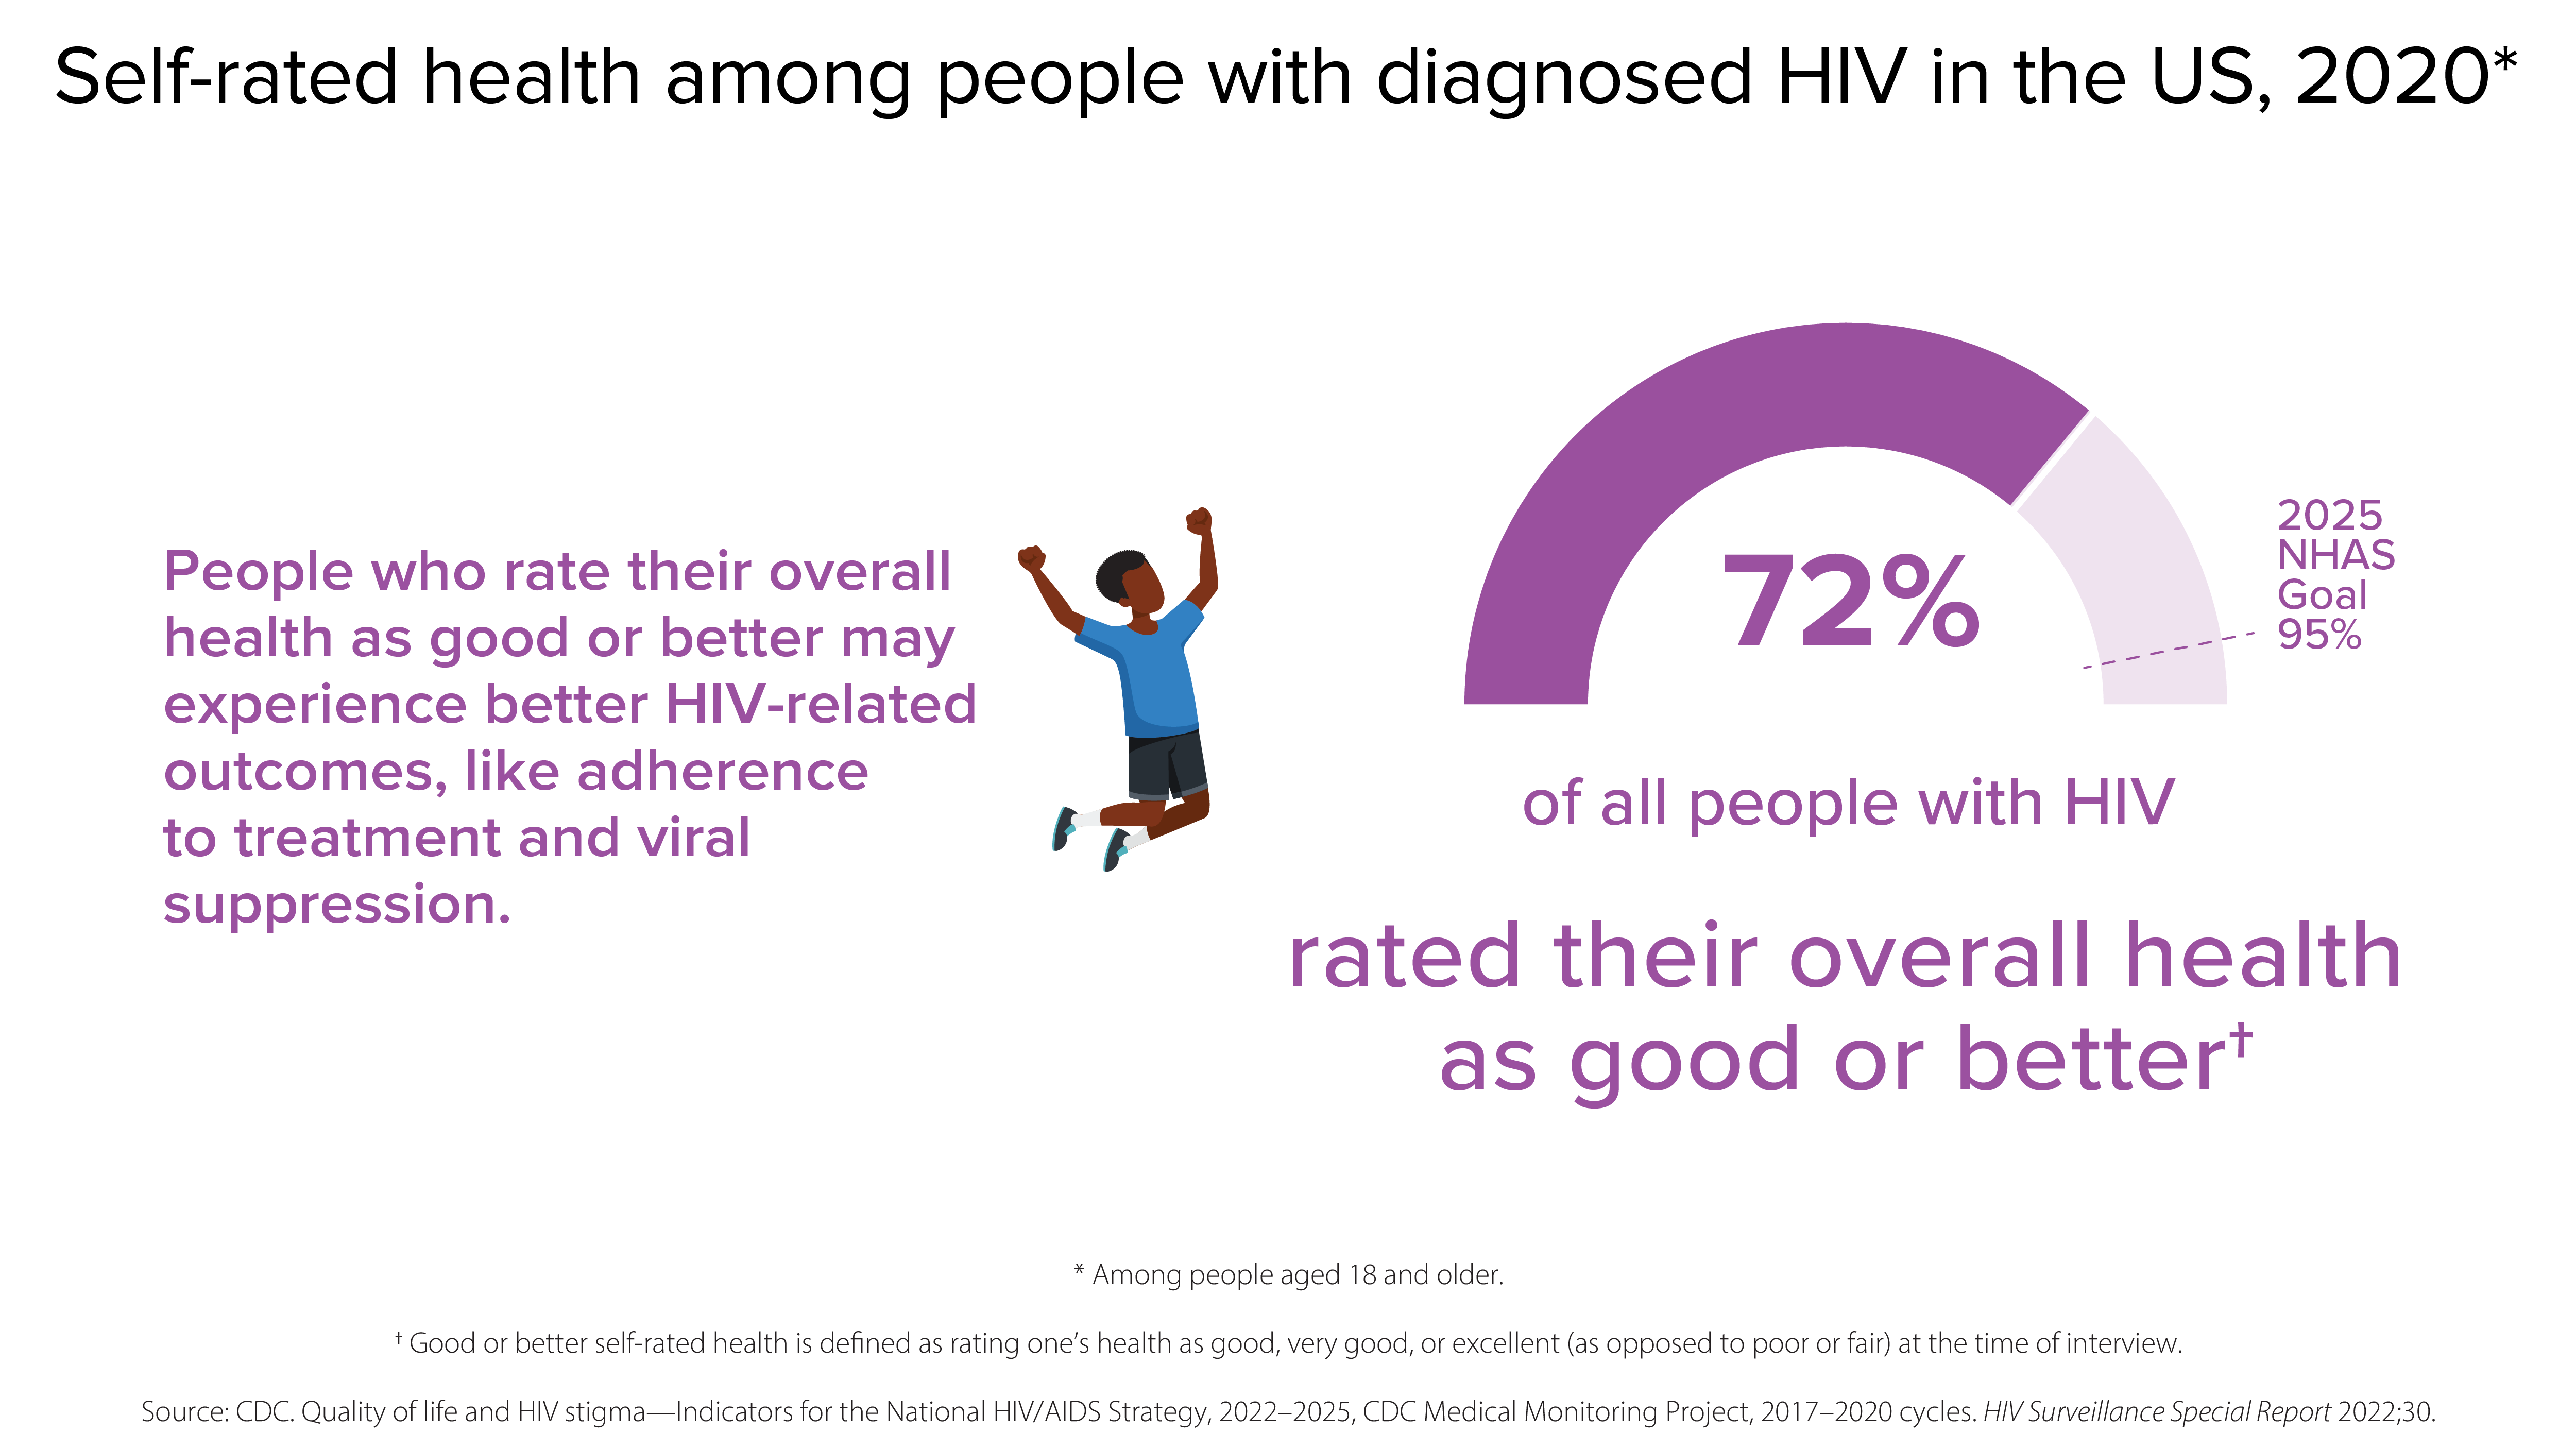
People who rate their overall health as good or better may experience better HIV-related outcomes, like adherence to treatment and viral suppression. In 2020, 72% of all people with HIV rated their overall health as good or better, compared to the 2025 NHAS goal of 95%.
Self-rated health among people with diagnosed HIV.
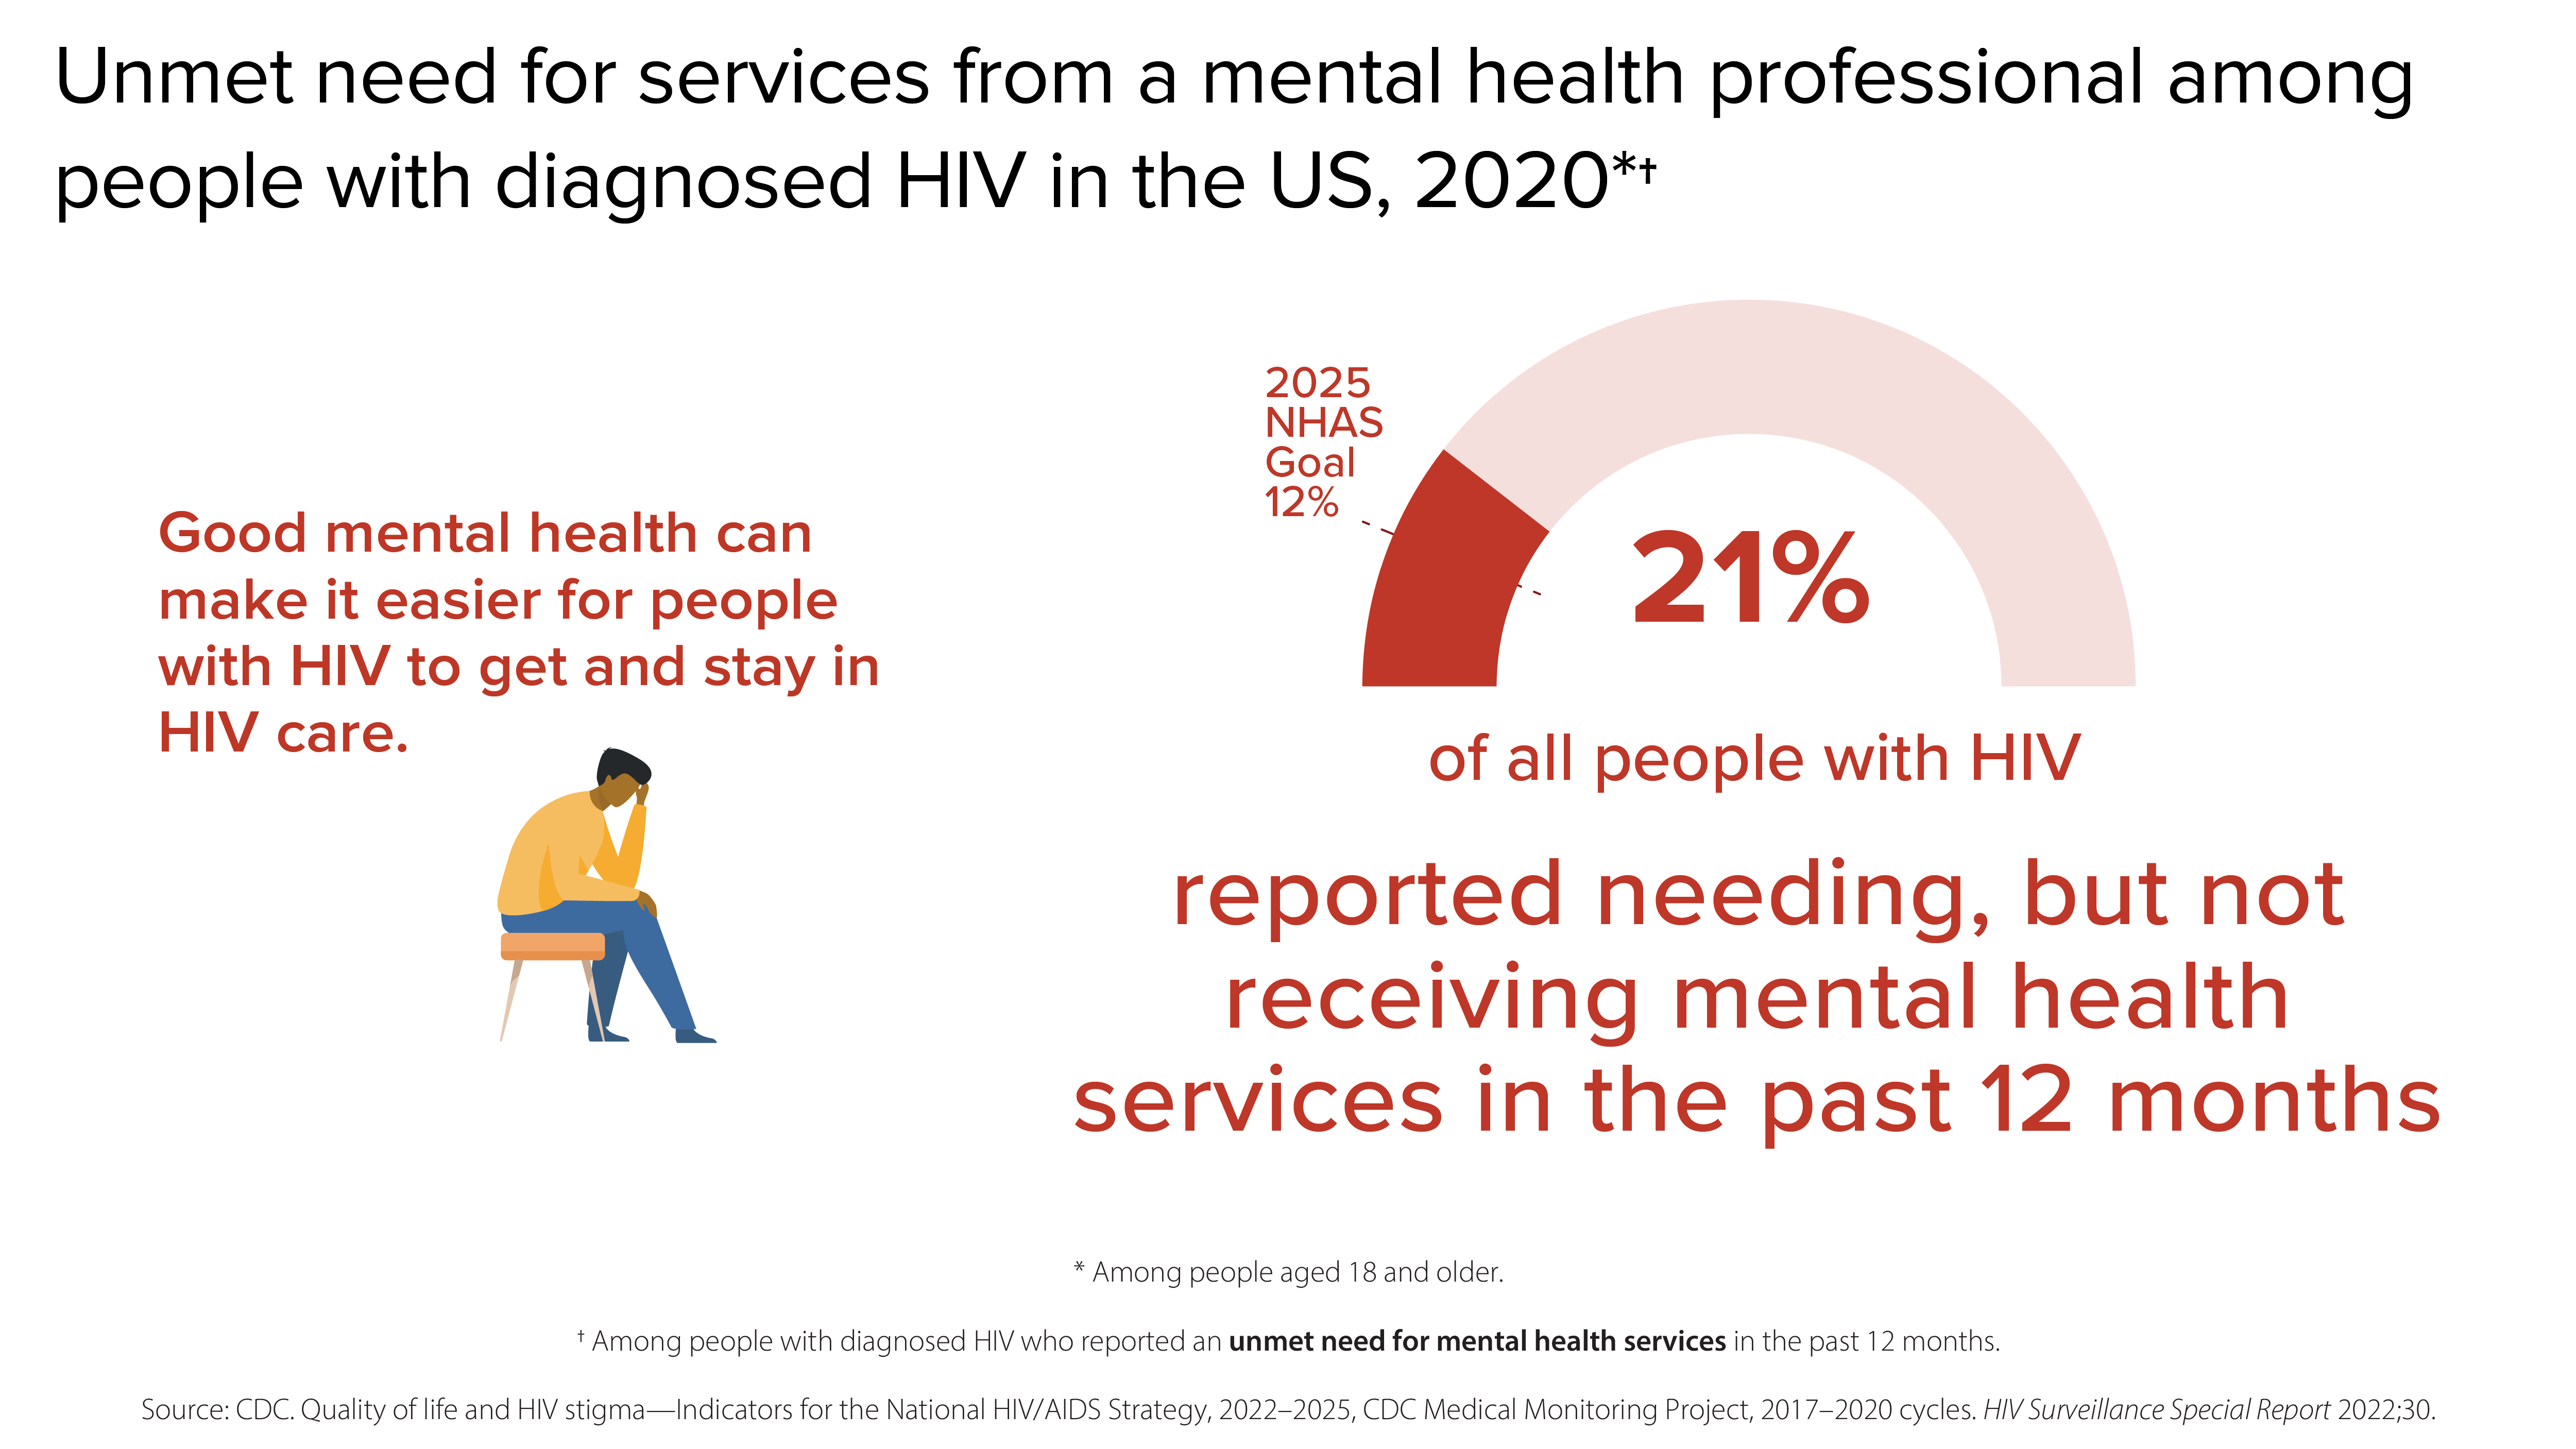
Good mental health can make it easier for people with HIV to get and stay in HIV care. In 2020, 21% of all people with HIV reported needing, but not receiving mental health services in the past 12 months, compared to the 2025 NHAS goal of 12%.
People with diagnosed HIV who reported needing, but not receiving, mental health services.
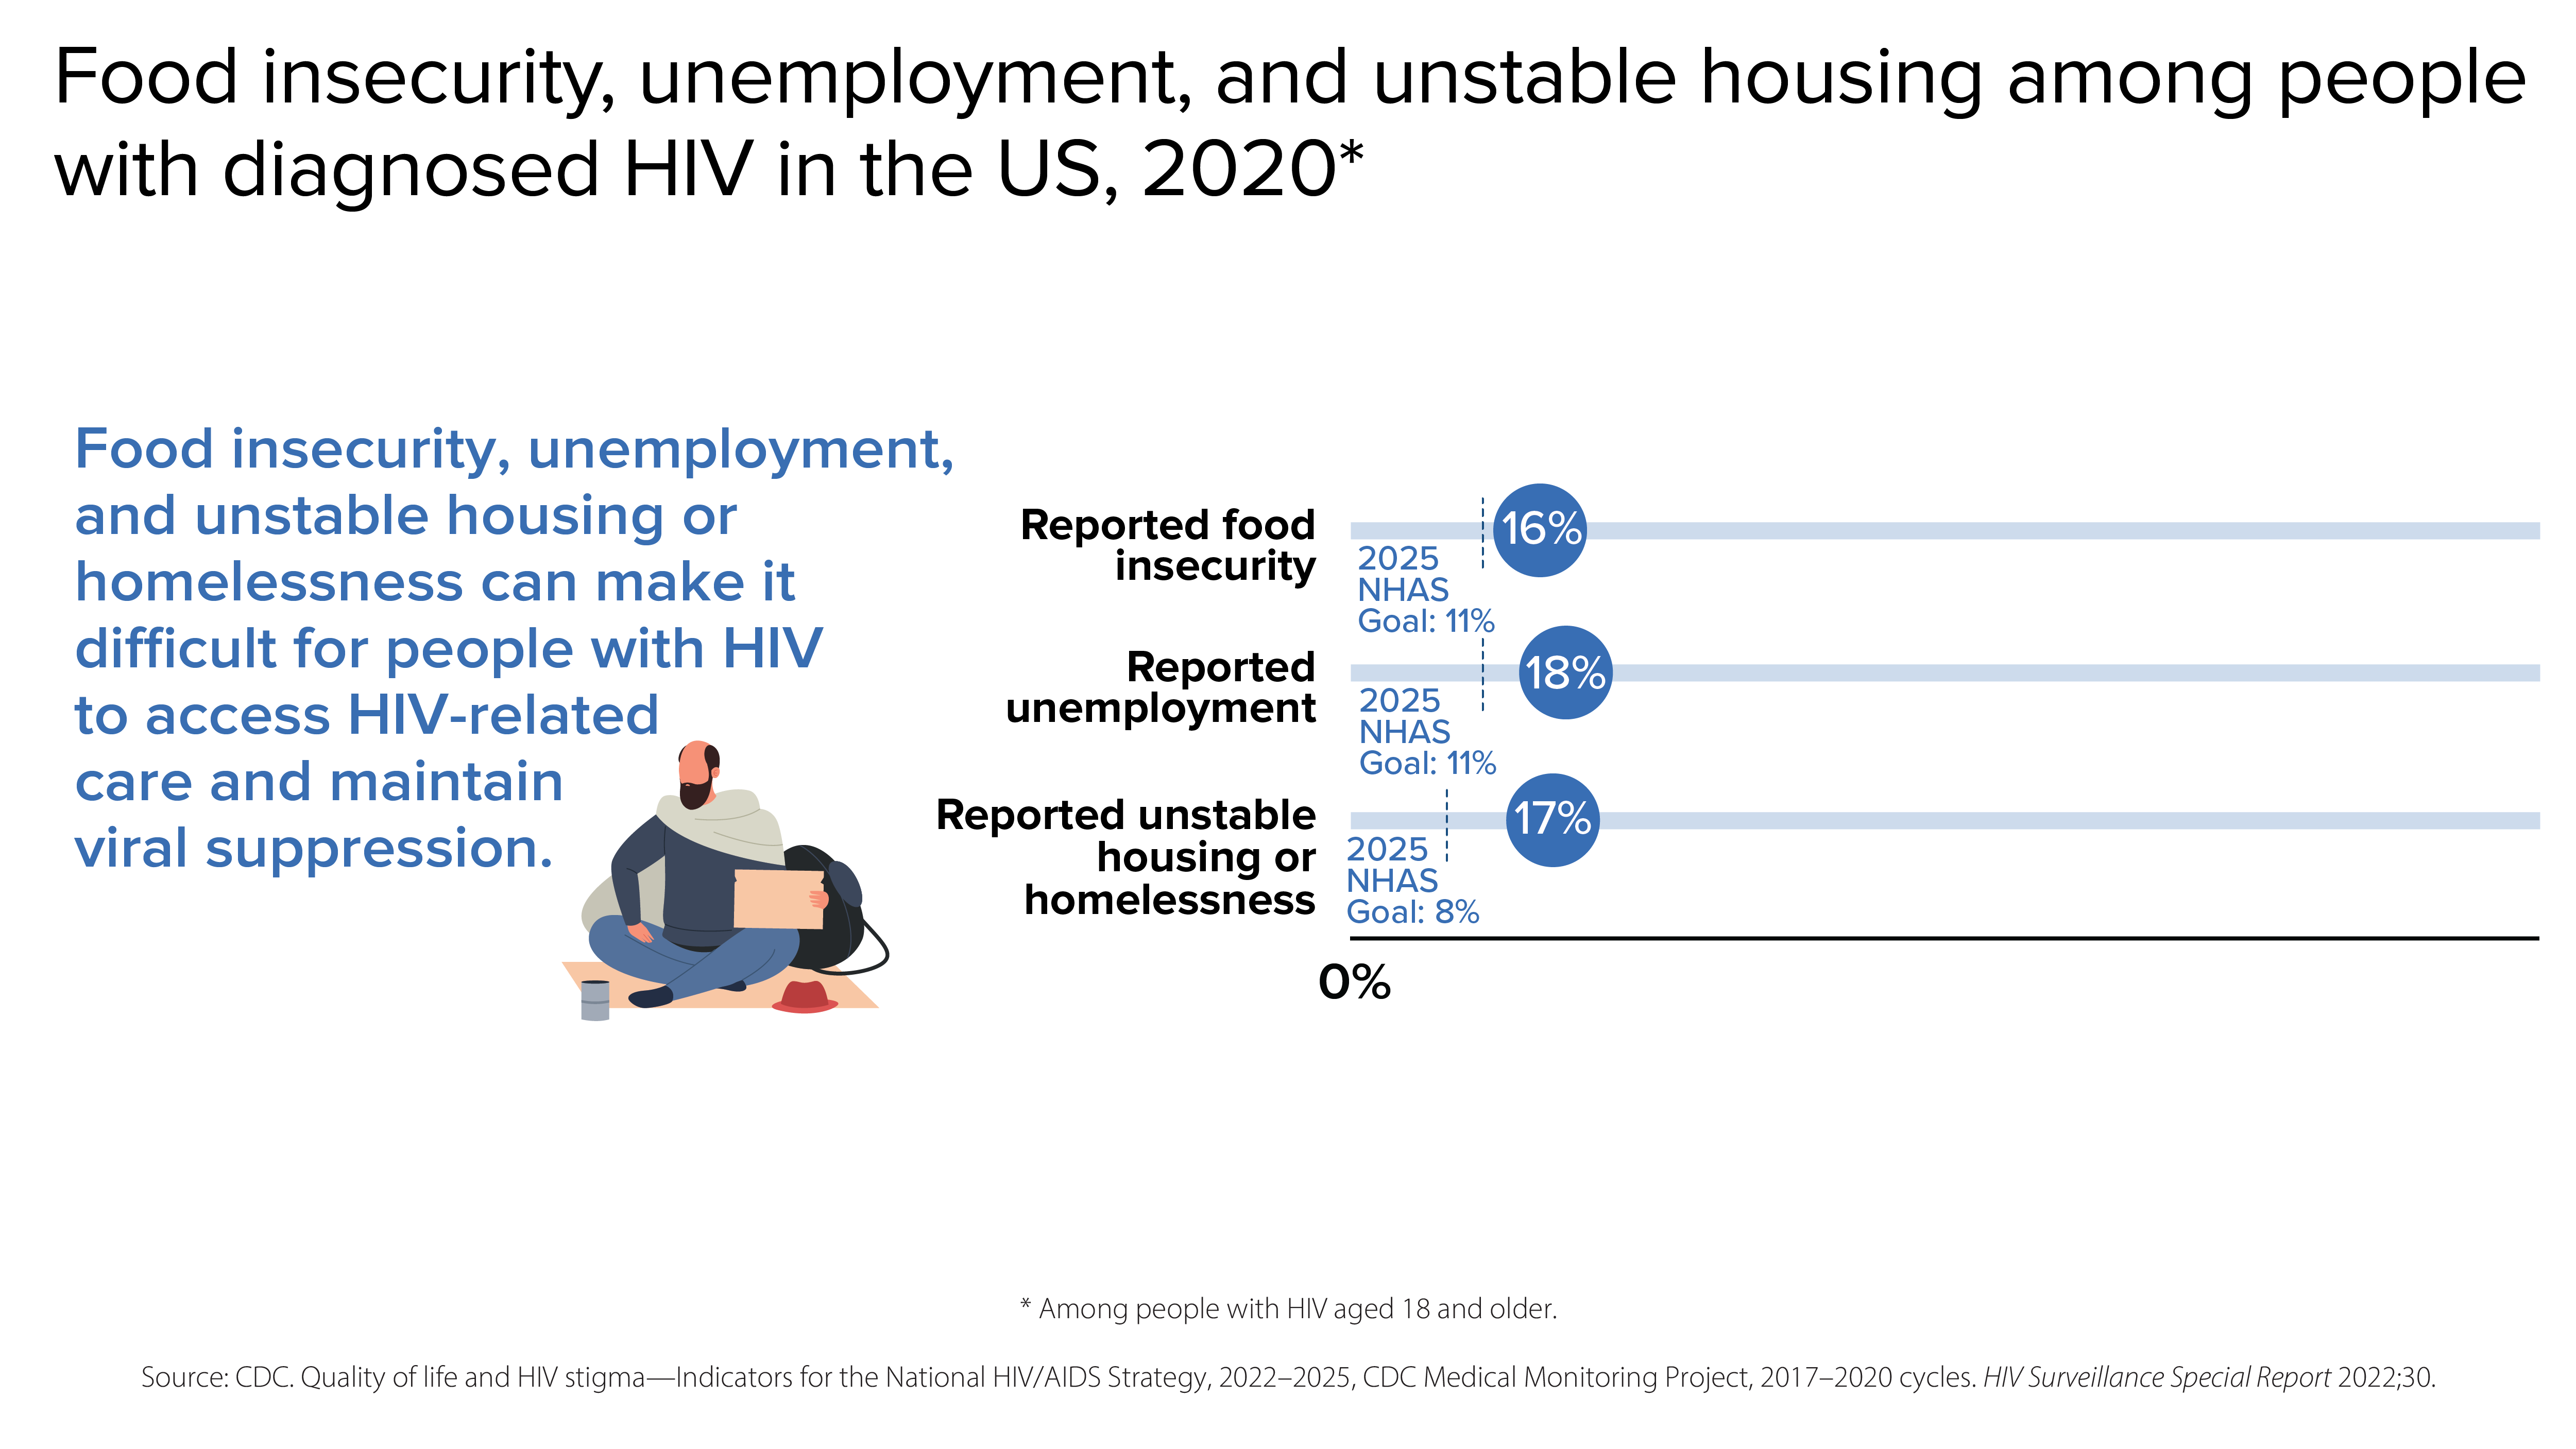
Food insecurity, unemployment, and unstable housing or homelessness can make it difficult for people with HIV to access HIV-related care and maintain viral suppression. In 2020, among people with diagnosed HIV in the US, 16% reported food insecurity (compared to the 2025 NHAS goal of 11%), 18% reported unemployment (compared to the 2025 NHAS goal of 11%), and 17% reported unstable housing or homelessness (compared to the NHAS goal of 8%).
Food insecurity, unemployment, and unstable housing among people with diagnosed HIV.