Monitoring Selected National HIV Prevention and Care Objectives By Using HIV Surveillance Data United States and 6 Dependent Areas, 2019: National Profile

The term diagnosis of HIV infection refers to a diagnosis of HIV infection regardless of the person’s stage of disease (stage 0, 1, 2, 3 [AIDS], or unknown) at the time of diagnosis. The standard used for reporting trends in numbers, percentages, and rates is an increase or a decrease of 5% or more during the specified time frame (e.g., when comparing 2015 and 2019). The exceptions to this standard are where numbers were small (i.e., less than 12) and percentages or rates were based on small numbers. Please use caution when interpreting data on diagnosed HIV infection (see Technical Notes for additional information on Definitions and Data Specifications).
Data from jurisdictions that reported complete CD4 and viral load laboratory results to CDC were used for the analyses that require laboratory data (Tables 1a–4b). Data from the 50 states, the District of Columbia, and 6 U.S. dependent areas (where indicated) were used for analyses of stage 3 (AIDS) at the time of diagnosis of HIV infection (Tables 6a–d), deaths and survival of persons with diagnosed HIV infection (Tables 7a–8f), and persons with diagnosed, perinatally acquired HIV infection (Tables 10a/b). For tables on preexposure prophylaxis (PrEP) (Tables 9a/b), the number of persons who have been prescribed PrEP, the estimated number with PrEP indications, and PrEP coverage are presented. For tables that include data by transmission category, the data were statistically adjusted to account for missing transmission category and are presented based on sex at birth. For a summary of indicators for EHE, see Table 11. For information and data among selected populations, see the special focus profiles and 2019 status on linkage to care and viral suppression outcomes section.
- Status of laboratory reporting
- Diagnosis—based HIV Care Continuum—Overview
- Prevalence–based HIV Care Continuum—Overview
- Stage 3 (AIDS) at time of Diagnosis of HIV infection, and Death and Survival after Diagnosis of HIV Infection
- Deaths
- Survival for > 3 years after diagnosis of HIV infection
- Preexposure Prophylaxis (PrEP) Coverage and Persons Prescribed PrEP

Please read all titles and footnotes carefully to ensure a complete understanding of the displayed data. Please note that we highlight an important point with the magnifying glass icon in the text.
Status of laboratory reporting
Monitoring stage of disease at time of diagnosis, linkage to HIV medical care, retention in HIV medical care, and viral suppression (on the basis of NHSS data) is dependent upon complete reporting of HIV-related laboratory results (including CD4+ T-lymphocyte [CD4] and viral load results) to HIV surveillance programs and CDC. Although most jurisdictions have regulations that require laboratories and providers to report at least a subset of CD4 and viral load test results to health departments, not all jurisdictions have mandatory reporting of all levels of CD4 and viral load (i.e., detectable and undetectable) results.
As of December 2020, 45 jurisdictions (44 states and the District of Columbia) had complete laboratory reporting for specimens collected from at least January 2018 through September 2020 (Figure 1).
Figure 1. Status of CD4 and viral load reporting, by area of residence as of December 2020—United States and dependent areas
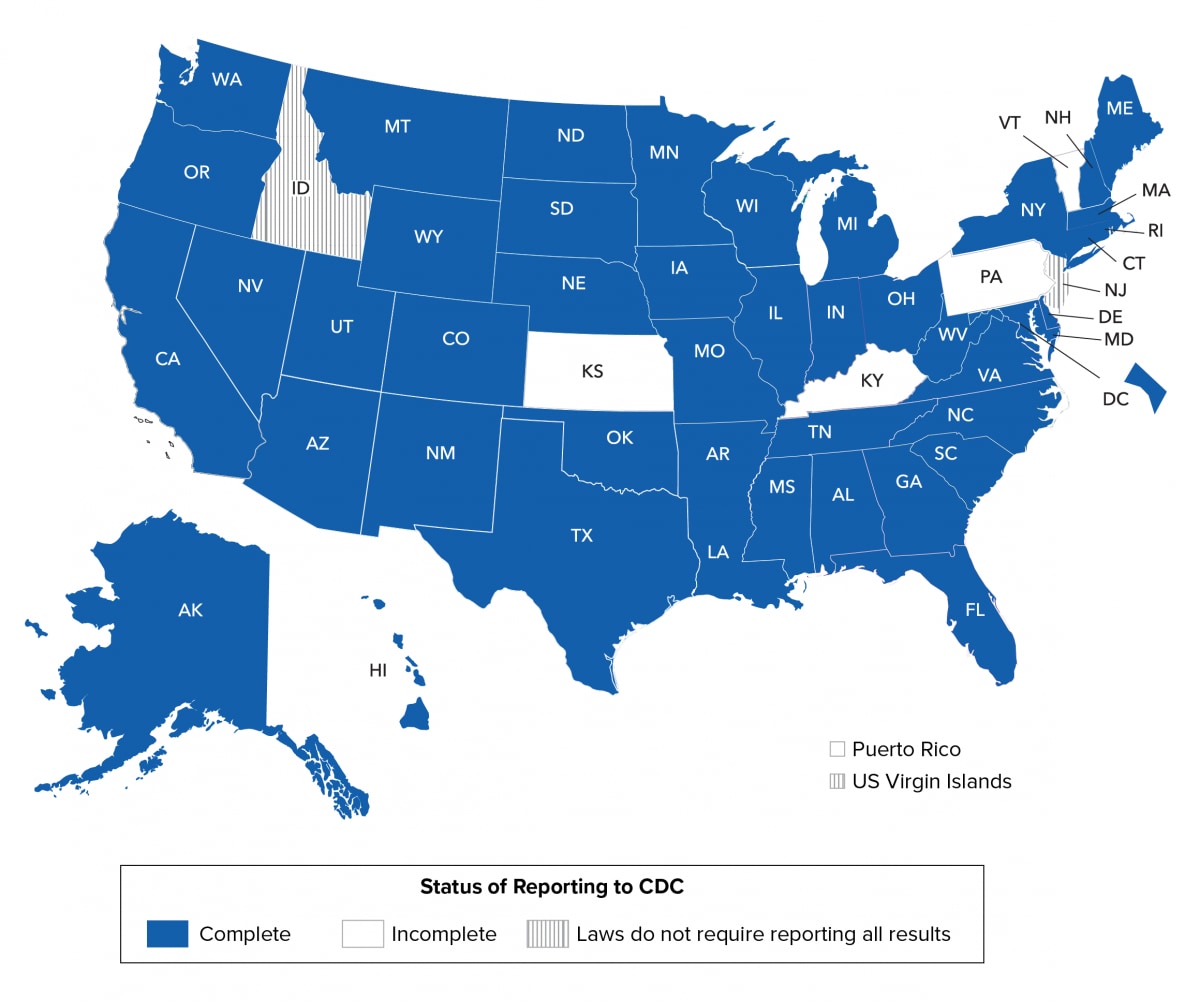
Note. See Technical Notes for more information on areas with complete laboratory reporting.
The jurisdictions included in this report differ from those in previous reports. A jurisdiction’s data are included only if that jurisdiction met CDC’s criteria (see Technical Notes) for the collection and reporting of CD4 and viral load test results for all the data years examined. In comparison with the 2018 report, the 2019 report includes data from three additional states (Arizona, Arkansas, and Connecticut) that met the criteria.
Diagnosis—based HIV Care Continuum—Overview
The Diagnosis-based HIV Care Continuum describes each step of the continuum as a percentage of the number of people living with diagnosed HIV. The denominator is the number of persons aged ≥13 years living with diagnosed HIV infection at year-end 2019 (note: denominator for linkage to care and viral suppression within 6 months of diagnosis is limited to people with HIV diagnosed in a single year). The numerator is from the 45 jurisdictions with complete CD4 and viral load reporting. For more information on Definitions and Data Specifications, see Technical Notes.
Uses of the diagnosis-based continuum include monitoring the United States progress in comparison to national strategic plan, EHE, and UNAIDS 90-90-90 goals, monitoring disparities among subgroups of the population, and monitoring data at a local level to understand local progress and identify additional action steps to meet national level goals.
Stage of Disease at Time of Diagnosis of HIV Infection
Among 33,795 persons with an HIV diagnosis during 2019, in 45 jurisdictions with complete laboratory reporting, the stage of disease at time of diagnosis was classified as follows: stage 0 (7.9%), stage 1 (25.9%), stage 2 (30.7%), stage 3 (AIDS) (20.2%), and stage unknown (15.3%). A higher percentage of persons had HIV diagnosed at an earlier stage (stage 0, 1, or 2: 64.5%) than at the late stage (stage 3 [AIDS]: 20.2%) (Table 1a, Figure 2).
Figure 2. Stage of disease at HIV diagnosis during 2019 among persons aged ≥13 years, 44 states and the District of Columbia
![cdc-hiv-surveillance-vol26-no-2-2 Among 33,795 persons with an HIV diagnosis during 2019, in 45 jurisdictions with complete laboratory reporting, the stage of disease at time of diagnosis was classified as follows: stage 0 (7.9%), stage 1 (25.9%), stage 2 (30.7%), stage 3 (AIDS) (20.2%), and stage unknown (15.3%). A higher percentage of persons had HIV diagnosed at an earlier stage (stage 0, 1, or 2: 64.5%) than at the late stage (stage 3 [AIDS]: 20.2%).](/hiv/images/library/reports/hiv-surveillance/vol-26-no-2/cdc-hiv-surveillance-vol26-no-2-2-large.png?_=55247)
Note. See Guide to Acronyms and Initialisms, Data Tables, and Technical Notes for more information on definitions and data specifications.
The highest percentages for persons whose infection was diagnosed at an earlier stage (stage 0, 1, or 2) by selected characteristics (i.e., gender, age group, race/ethnicity, and transmission category) were for persons of AGI (23.5% [stage 0], 47.1% [stage 1], 23.5% [stage 2]), transgender FTM persons (13.3% [stage 0], 37.8% [stage 1], 31.1% [stage 2]), persons aged 13–24 at time of diagnosis (11.2% [stage 0], 27.8% [stage 1], 36.2% [stage 2]), American Indian or Alaska Native persons (10.2% [stage 0], 29.6% [stage 1], 33.0% [stage 2]), males with infection attributed to male-to-male sexual contact and injection drug use (MMSC-IDU) (9.4% [stage 0], 33.4% [stage 1], 26.5% [stage 2]), and males with infection attributed to MMSC (8.9% [stage 0], 25.4% [stage 1], 32.2% [stage 2]) (Table 1a, Figure 3). The highest percentages for persons whose infection was diagnosed at a late stage (stage 3 [AIDS]) by selected characteristics were for females (20.5%), males (20.3%), persons aged ≥45 years at time of diagnosis (45–54 years: 31.3%, ≥55 years: 34.4%), Asian persons (24.6%), and males with infection attributed to heterosexual contact (32.5%) (Table 1a, Figure 3). Please use caution when interpreting data for persons of AGI, transgender female-to-male (FTM) persons, American Indian or Alaska Native persons, and Native Hawaiian or other Pacific Islander persons: the numbers are small.
Figure 3. Stage of disease at HIV diagnosis during 2019 among persons aged ≥13 years, by selected characteristics—44 states and the District of Columbia
![cdc-hiv-surveillance-vol26-no-2-3 The highest percentage for persons whose infection was diagnosed at an earlier stage (stage 0, 1, or 2) by selected characteristics was for persons of AGI, transgender FTM persons, persons aged 13–24 at time of diagnosis, American Indian or Alaska Native persons, males with infection attributed to male-to-male sexual contact and injection drug use (MMSC-IDU), and males with infection attributed to MMSC. The highest percentage for persons whose infection was diagnosed at a late stage (stage 3 [AIDS]) by selected characteristics was for females, males, persons aged ≥45 years at time of diagnosis (45–54 years: 31.3%, ≥55 years: 34.4%), Asian persons, and males with infection attributed to heterosexual contact.](/hiv/images/library/reports/hiv-surveillance/vol-26-no-2/cdc-hiv-surveillance-vol26-no-2-3-large.png?_=55300)
Note. See Guide to Acronyms and Initialisms, Data Tables, and Technical Notes for more information on definitions and data specifications.
aHispanic/Latino persons can be of any race.
Linkage to HIV Medical Care and Viral Suppression within 6 months after Diagnosis of HIV Infection
Among 33,795 persons whose infection was diagnosed during 2019 in 45 jurisdictions with complete laboratory reporting, 81.3% were linked to HIV medical care ≤1 month after diagnosis (Table 2a). During 2019, 11 states (Iowa, Maine, Massachusetts, Minnesota, Montana, New Mexico, North Dakota, Rhode Island, Washington, Wisconsin, and Wyoming) in the top 25% had the highest percentages (≥87.7) of persons linked to HIV medical care within 1 month of diagnosis. Twelve states (Delaware, Indiana, Mississippi, Missouri, North Carolina, Oklahoma, South Dakota, Tennessee, Texas, Utah, Virginia, and West Virginia) in the lowest 25% had the lowest percentages (≤78.9) of persons linked to HIV medical care within 1 month of diagnosis (Table 2b, Figure 4).
Figure 4. Linkage to HIV medical care within 1 month of HIV diagnosis during 2019, by area of residence—44 states and the District of Columbia
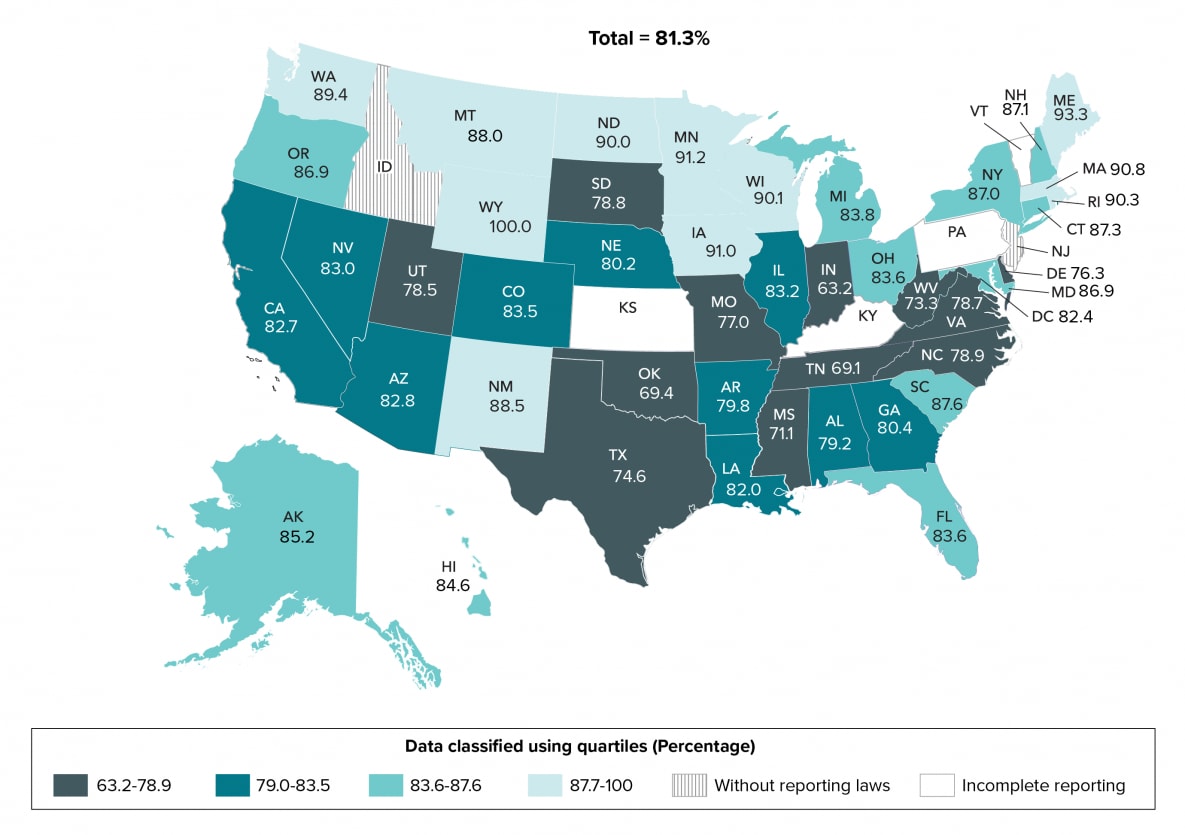
Note. See Guide to Acronyms and Initialisms, Data Tables, and Technical Notes for more information on definitions and data specifications.
Although linkage to HIV medical care overall is below the EHE target of 95%, the highest percentages for persons linked to HIV medical care ≤1 month of diagnosis by selected characteristics (i.e., gender, age group, race/ethnicity, and transmission category) were for transgender FTM persons (88.9%), persons of AGI (88.2%), persons aged ≥45 years (45–54 years: 83.3%, ≥55 years: 83.4%), Hispanic or Latino persons (84.4%), and males with infection attributed to MMSC (82.1%). The lowest percentages for persons linked to HIV medical care were for females (80.1%), persons aged 13–24 years (79.0%), Black or African American persons (78.4%), and females with infection attributed to IDU (75.1%) (Table 2a, Figure 5). Please use caution when interpreting data for persons of AGI, transgender FTM persons, and Native Hawaiian or other Pacific Islander persons: the numbers are small.

A closer look at linkage to HIV medical care within 1 month of diagnosis reveals among 33,795 persons whose infection was diagnosed during 2019 in the 45 jurisdictions with complete laboratory reporting, no demographic group or group with infection attributed to any of the transmission categories met the forthcoming EHE target of 95% (Figure 5).
Figure 5. Linkage to HIV medical care within 1 month of HIV diagnosis during 2019 among persons aged ≥13 years, by selected characteristics—44 states and the District of Columbia
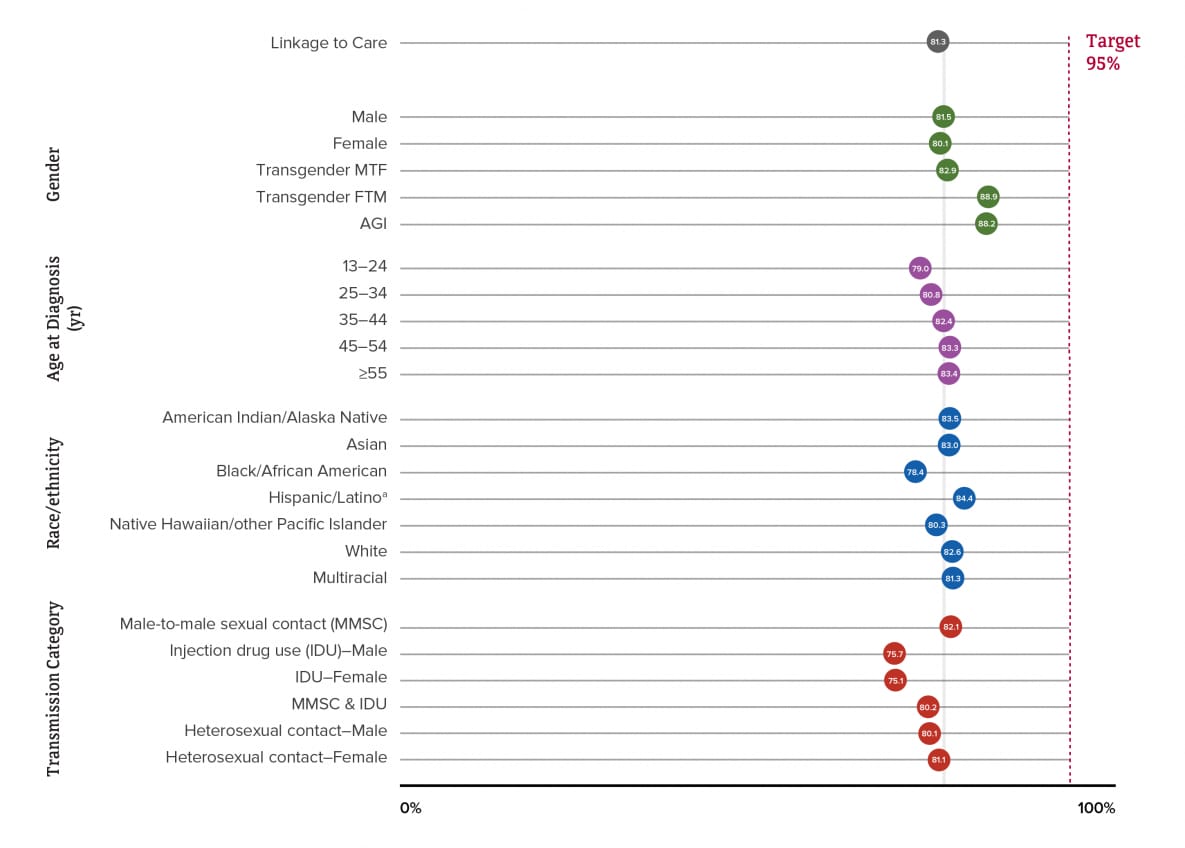
Note. See Guide to Acronyms and Initialisms, Data Tables, and Technical Notes for more information on definitions and data specifications.
aHispanic/Latino persons can be of any race
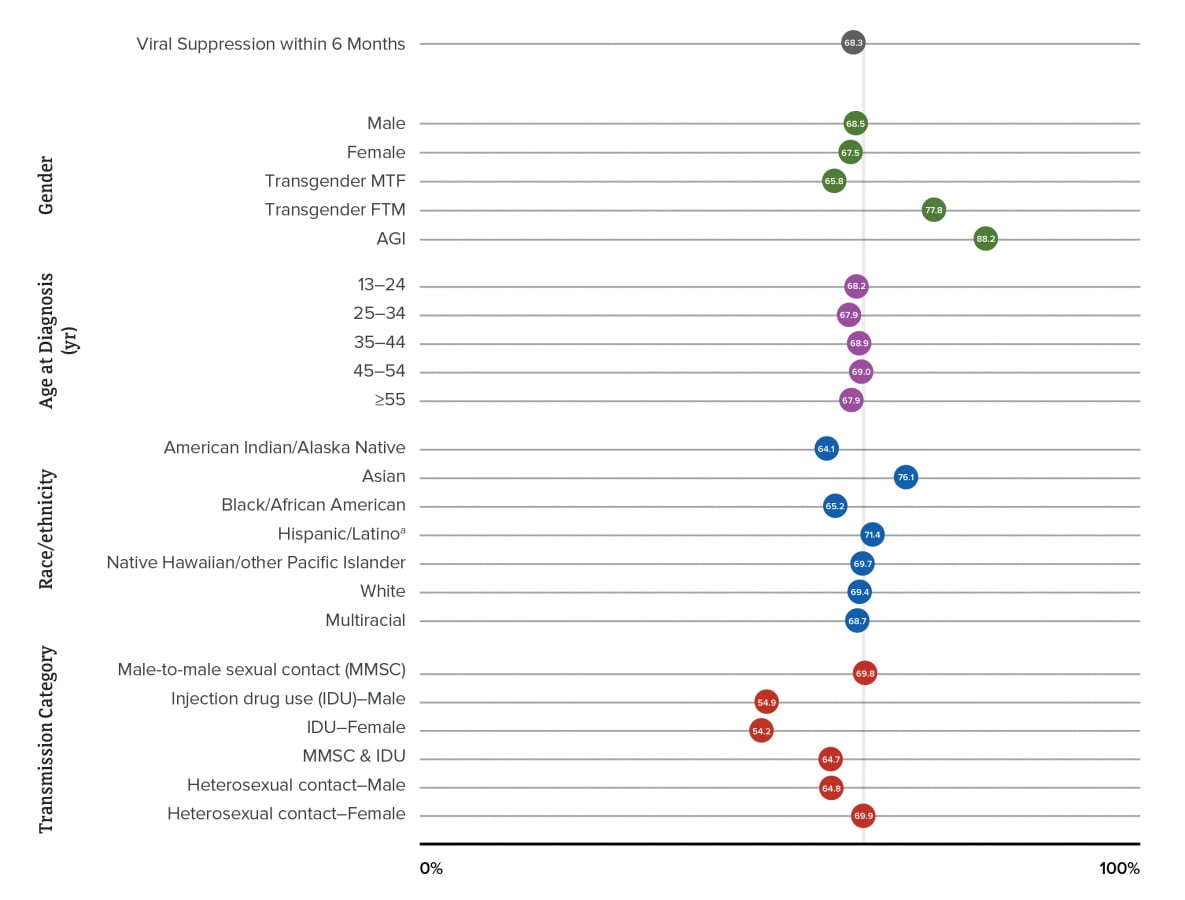
For any viral load test result received within 6 months of HIV diagnosis during 2019, viral load was suppressed in 68.3% of persons with HIV infection diagnosed in 2019 in the 45 jurisdictions (Table 2a). Eleven states (Hawaii, Maine, Massachusetts, Michigan, New York, North Dakota, Rhode Island, South Carolina, Utah, Washington, and Wisconsin) in the top 25% had the highest percentages (≥76.0) of persons with viral suppression within 6 months of diagnosis in 2019. Twelve states (Arkansas, Illinois, Indiana, Mississippi, Nebraska, Nevada, Oklahoma, South Dakota, Tennessee, Texas, West Virginia, and Wyoming) in the lowest 25% had the lowest percentages (≤63.1) of persons with viral suppression within 6 months of diagnosis in 2019 (Table 2b, Figure 6).
Figure 6. Viral suppression within 6 months of HIV diagnosis during 2019, by area of residence—44 states and the District of Columbia
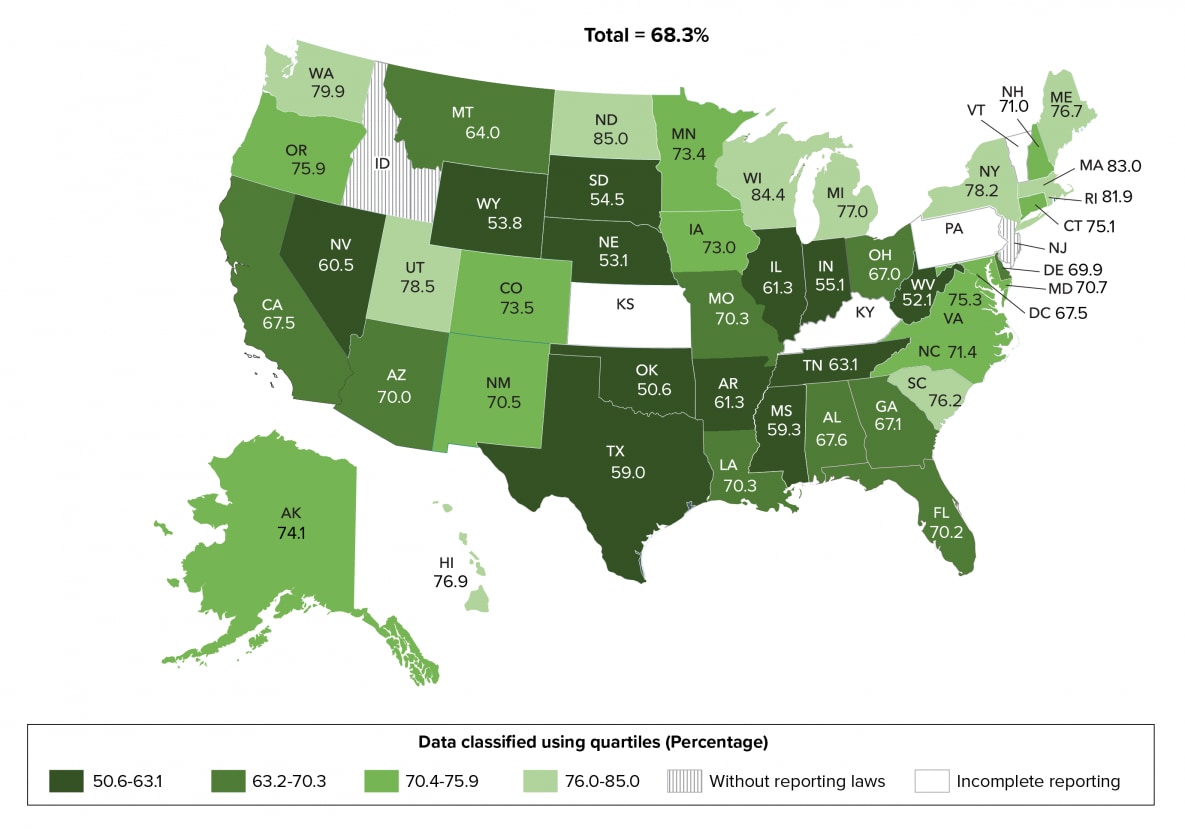
Note. See Guide to Acronyms and Initialisms, Data Tables, and Technical Notes for more information on definitions and data specifications.
The highest percentages for persons whose viral load test result indicated viral suppression within 6 months of diagnosis in 2019 by selected characteristics (i.e., gender, age group, race/ethnicity, and transmission category) were for persons of AGI (88.2%), persons aged 45–54 years (69.0%), Asian persons (76.1%), females with infection attributed to heterosexual contact (69.9%), and males with infection attributed to MMSC (69.8%). The lowest percentages for persons that had viral suppression within 6 months of HIV diagnosis in 2019 were for transgender MTF persons (65.8%), persons aged 25–34 years and persons ≥55 years (67.9%), American Indian or Alaska Native persons (64.1%), and females with infection attributed to IDU (54.2%) (Table 2a, Figure 7). Please use caution when interpreting data for persons of AGI, transgender FTM persons, and Native Hawaiian or other Pacific Islander persons: the numbers are small.
Figure 7. Viral suppression within 6 months of HIV diagnosis during 2019 among persons aged ≥13 years, by selected characteristics—44 states and the District of Columbia
Note. See Guide to Acronyms and Initialisms, Data Tables, and Technical Notes for more information on definitions and data specifications.
aHispanic/Latino persons can be of any race.
Receipt of HIV Medical care, Retention in HIV Medical care, and Viral Suppression
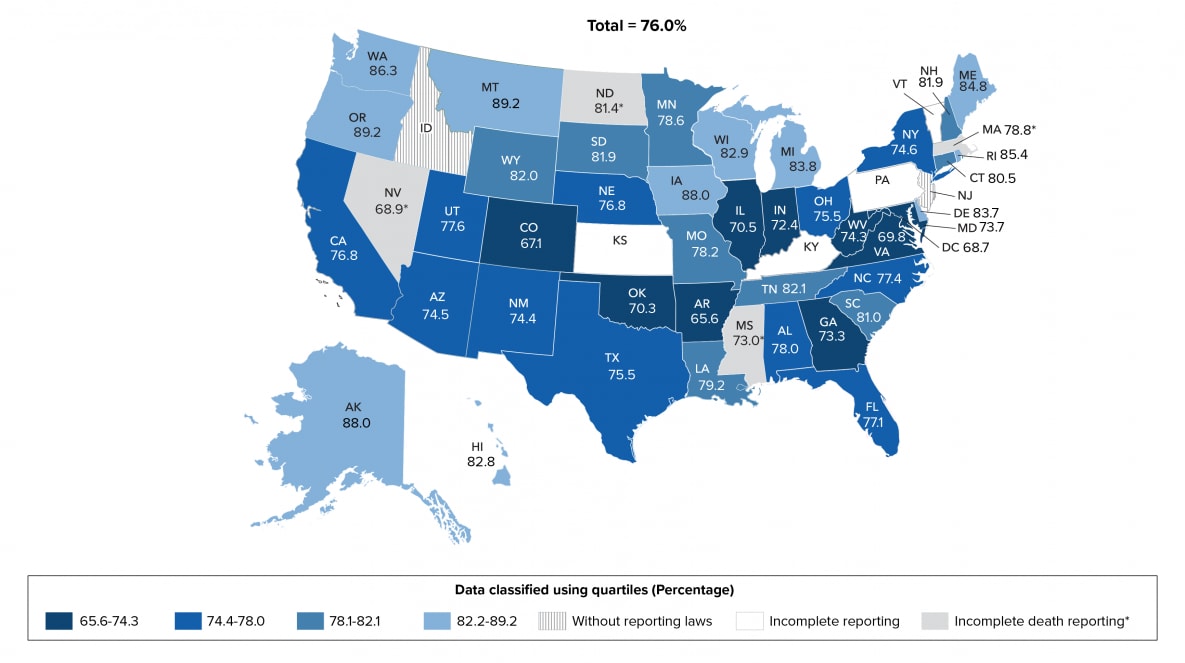
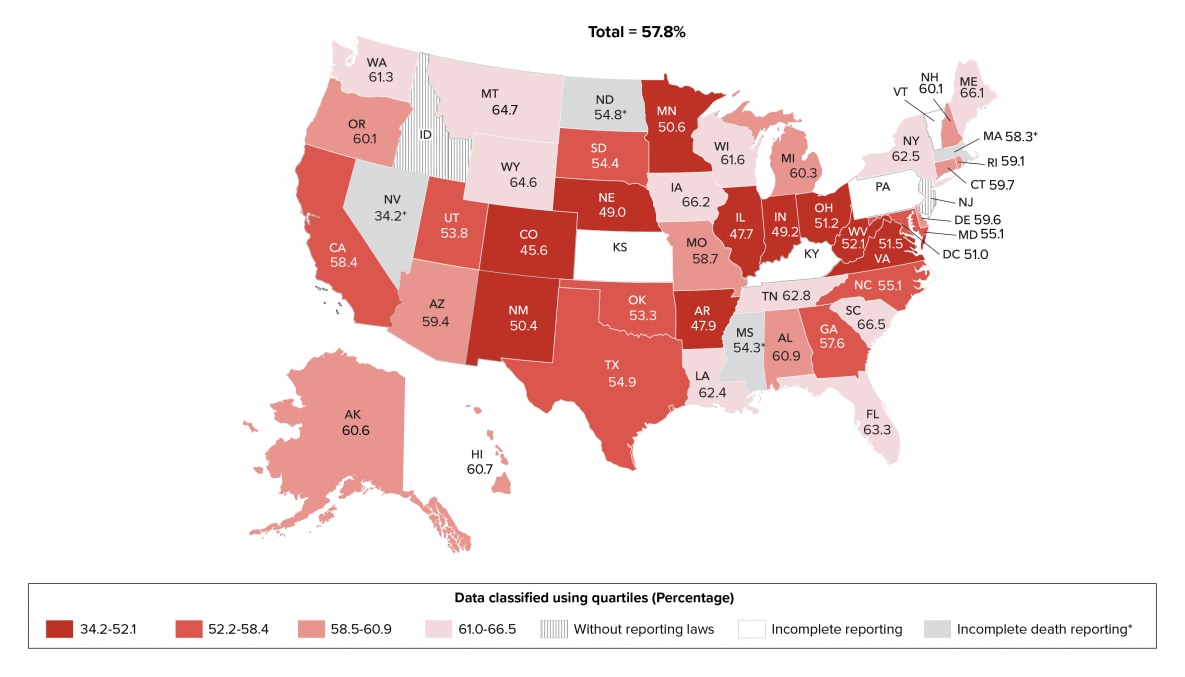
During 2019 in 45 jurisdictions with complete laboratory reporting, 76.0% of 925,077 persons alive at year-end 2019 received any HIV medical care, and 57.8% of persons were retained in HIV medical care (Table 3a). Eleven states (Alaska, Delaware, Hawaii, Iowa, Maine, Michigan, Montana, Oregon, Rhode Island, Washington, and Wisconsin) in the top 25% had the highest percentages (≥82.2) of persons who received any HIV medical care. Eleven states (Arkansas, Colorado, Georgia, Illinois, Indiana, Maryland, Mississippi, Nevada, Oklahoma, Virginia, and West Virginia) and the District of Columbia were in the lowest 25% and had the lowest percentages (≤74.3) of persons who received any HIV medical care (Table 3b, Figure 8a). Eleven states (Florida, Iowa, Louisiana, Maine, Montana, New York, South Carolina, Tennessee, Washington, Wisconsin, and Wyoming) in the top 25% had the highest percentages (≥61.0) of persons retained in HIV medical care. Eleven states (Arkansas, Colorado, Illinois, Indiana, Minnesota, Nebraska, Nevada, New Mexico, Ohio, Virginia, and West Virginia) and the District of Columbia were in the lowest 25% and had the lowest percentages (≤52.1) of persons retained in HIV medical care (Table 3b, Figure 8b). Please note that due to incomplete reporting of deaths for the year 2019, data for Massachusetts, Mississippi, Nevada, and North Dakota should be interpreted with caution.
Figure 8a. Receipt of HIV Medical Care among Persons Aged ≥13 Years Living with Diagnosed HIV Infection, by Area of Residence, 2019—44 States and the District of Columbia
Note. Data for the year 2019 are preliminary and based on deaths reported to CDC as of December 2020.
See Guide to Acronyms and Initialisms, Data Tables, and Technical Notes for more information on Definitions and Data Specifications.
Figure 8b. Retention in HIV Medical Care among Persons Aged ≥13 Years Living with Diagnosed HIV Infection, by Area of Residence, 2019—44 States and the District of Columbia
Note. Data for the year 2019 are preliminary and based on deaths reported to CDC as of December 2020.
See Guide to Acronyms and Initialisms, Data Tables, and Technical Notes for more information on Definitions and Data Specifications.
During 2019, 76.0% of 925,077 persons had at least 1 CD4 or viral load test (i.e., received any HIV medical care in 2019), and 73.2% had at least 1 viral load test. At the most recent viral load test during 2019, viral load was suppressed in 86.2% of persons who received any HIV medical care (at least 1 CD4 or viral load test) in 2019 and 89.5% of persons with at least 1 viral load test (Table 4a).
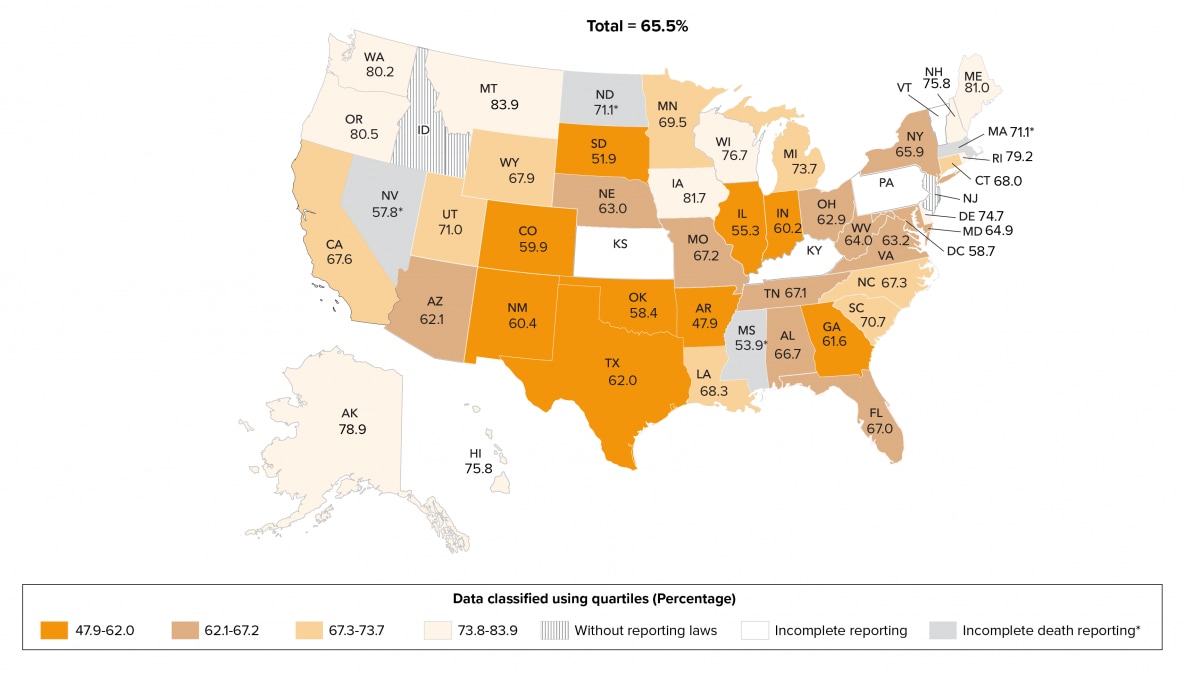
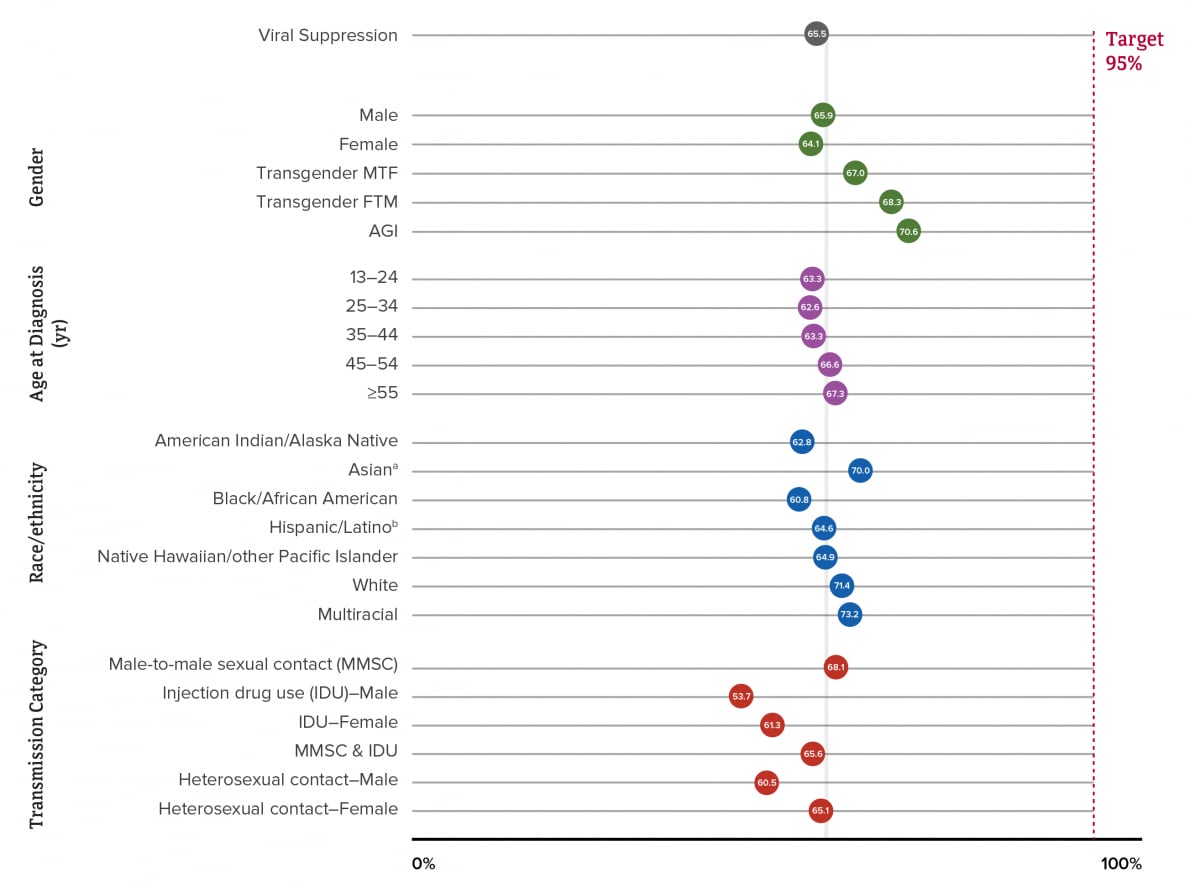
Persons with suppressed viral load at the most recent viral load test represented 65.5% of the total number of persons with an HIV diagnosis by year-end 2018 and alive at year-end 2019 in the 45 jurisdictions (Table 4a). Eleven states (Alaska, Delaware, Hawaii, Iowa, Maine, Montana, New Hampshire, Oregon, Rhode Island, Washington, and Wisconsin) in the top 25% had the highest percentages (≥73.8) of persons with viral suppression at the most recent viral load test during 2019. Eleven states (Arkansas, Colorado, Georgia, Illinois, Indiana, Mississippi, Nevada, New Mexico, Oklahoma, South Dakota, and Texas) and the District of Columbia (D.C.) were in the lowest 25% and had the lowest percentages (≤62.0) of persons with viral suppression at the most recent viral load test during 2019 (Table 4b, Figure 9). Please note that due to incomplete reporting of deaths for the year 2019, data for Massachusetts, Mississippi, North Dakota, and Nevada should be interpreted with caution.
Figure 9. Viral Suppression among Persons Aged ≥13 Years Living with Diagnosed HIV Infection, by Area of Residence, 2019—44 States and the District of Columbia
Note. Data for the year 2019 are preliminary and based on deaths reported to CDC as of December 2020.
See Guide to Acronyms and Initialisms, Data Tables, and Technical Notes for more information on Definitions and Data Specifications.
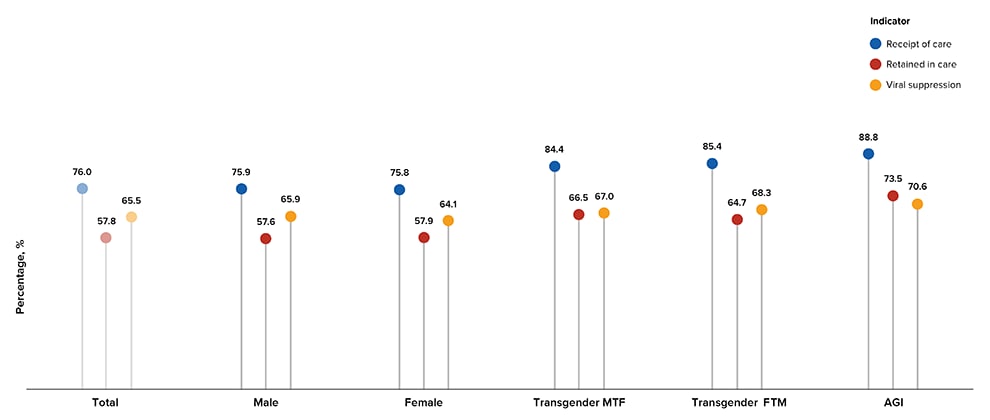
The following percentages are for persons living with diagnosed HIV by year-end 2019 in the 45 jurisdictions with complete laboratory reporting who received any HIV medical care, were retained in HIV medical care, or had a most recent viral load test result in 2019 that indicated viral suppression. By gender, the highest percentage for persons who received any HIV medical care was for persons of AGI (88.8%) and the lowest percentage was for females (75.8%). The highest percentage for persons retained in HIV medical care was for persons of AGI (73.5%) and the lowest percentage was for males (57.6%). The highest percentage for persons who were virally suppressed at the most recent viral load test was for transgender FTM persons (70.6%) and the lowest percentage was for females (64.1%) (Tables 3a and 4a, Figure 10).
Figure 10. Receipt of HIV Medical Care, Retention in HIV Medical Care, and Viral Suppression among Persons Aged ≥13 Years Living with Diagnosed HIV Infection, by Gender—44 States and the District of Columbia
Note. See Guide to Acronyms and Initialisms, Data Tables, and Technical Notes for more information on definitions and data specifications.
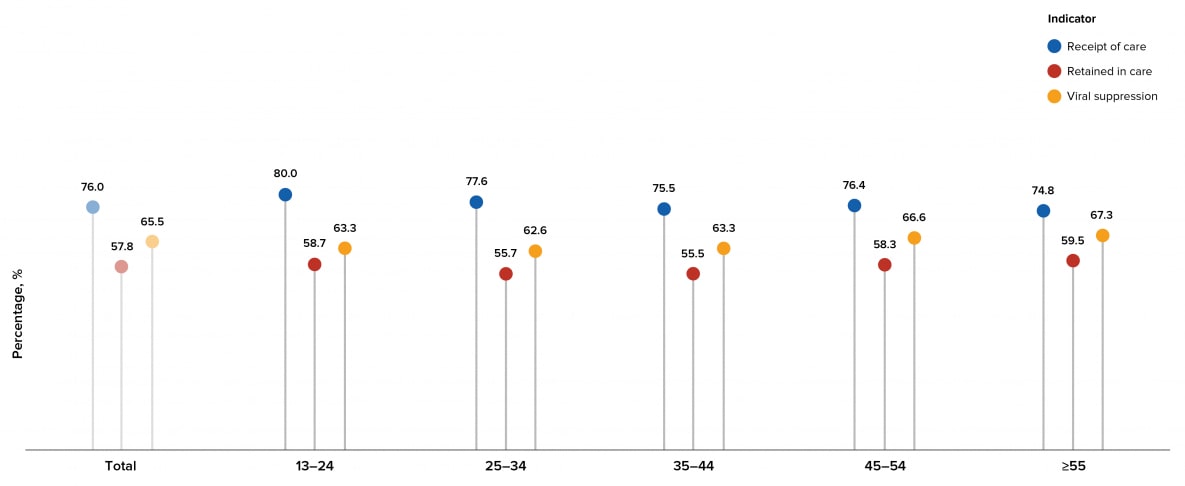
By age, the highest percentage for persons who received any HIV medical care was for persons aged 13–24 years (80.0%) and the lowest percentage was for persons aged ≥55 years (74.8%). The highest percentage for persons retained in HIV medical care was for persons aged ≥55 years (59.5%) and the lowest percentage was for persons aged 35–44 years (55.5%). The highest percentage for persons who were virally suppressed at the most recent viral load test was for persons aged ≥55 years (67.3%) and the lowest percentage was for persons aged 25–34 years (62.6%) (Tables 3a and 4a, Figure 11).
Figure 11. Receipt of HIV Medical Care, Retention in HIV Medical Care, and Viral Suppression among Persons Aged ≥13 Years Living with Diagnosed HIV Infection, by Age, 2019—44 States and the District of Columbia
Note. See Guide to Acronyms and Initialisms, Data Tables, and Technical Notes for more information on definitions and data specifications.
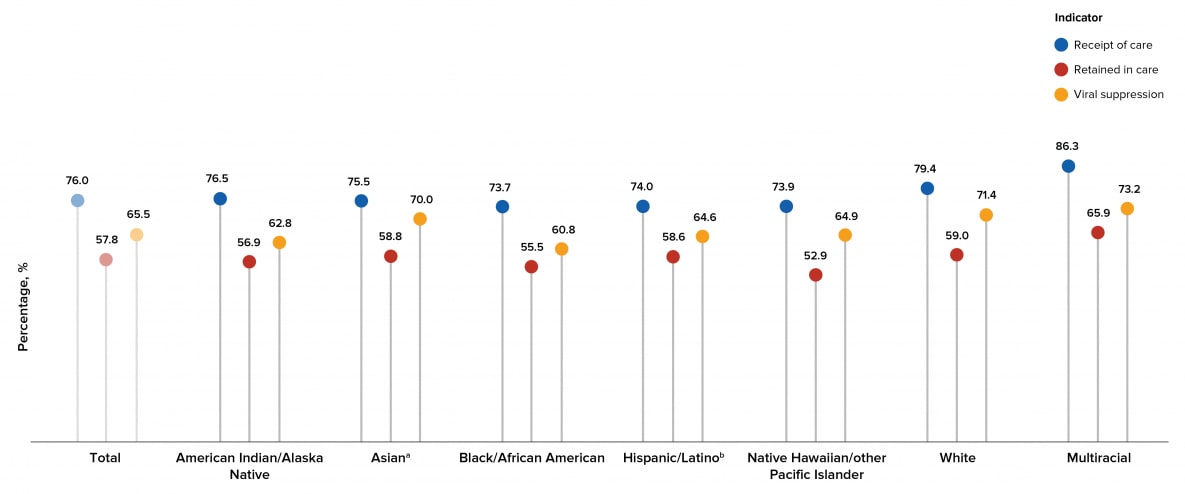
By race/ethnicity, the highest percentage for persons who received any HIV medical care was for multiracial persons (86.3%) and the lowest percentages were for Native Hawaiian or other Pacific Islander (73.9%) and Black or African American persons (73.7%). The highest percentage for persons retained in HIV medical care was for multiracial persons (65.9%) and the lowest percentage was for Native Hawaiian or other Pacific Islander persons (52.9%). The highest percentage for persons who were virally suppressed at the most recent viral load test was for multiracial persons (73.2%) and the lowest percentage was for Black or African American persons (60.8%) (Tables 3a and 4a, Figure 12).
Figure 12. Receipt of HIV Medical Care, Retention in HIV Medical Care, and Viral Suppression among Persons Aged ≥13 Years Living with Diagnosed HIV Infection, by Race/Ethnicity, 2019—44 States and the District of Columbia
Note. See Guide on Acronyms and Initialisms, Data Tables, and Technical Notes for more information on Definitions and Data Specifications.
aIncludes Asian/Pacific Islander legacy cases.
bHispanic/Latino persons can be of any race.
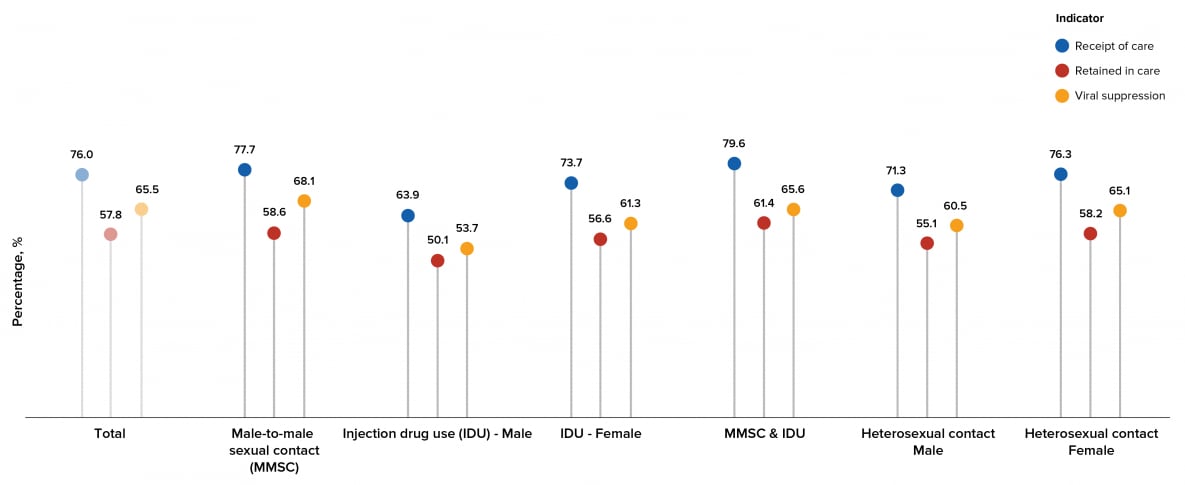
By transmission category, the highest percentage for persons who received any HIV medical care was for males with infection attributed to MMSC-IDU (79.6%) and the lowest percentage was for males with infection attributed to IDU (63.9%). The highest percentage for persons retained in HIV medical care was for males with infection attributed to MMSC-IDU (61.4%) and the lowest percentage was for males with infection attributed to IDU (50.1%). The highest percentage for persons who were virally suppressed at the most recent viral load test was for males with infection attributed to MMSC (68.1%) and the lowest percentage was for males with infection attributed to IDU (53.7%) (Tables 3a and 4a, Figure 13).
Figure 13. Receipt of HIV Medical Care, Retention in HIV Medical Care, and Viral Suppression among Persons Aged ≥13 Years Living with Diagnosed HIV Infection, by Transmission Category, 2019—44 States and the District of Columbia
Note. See Guide to Acronyms and Initialisms, Data Tables, and Technical Notes for more information on definitions and data specifications.

A closer look at viral suppression at the most recent viral load test reveals among 925,077 persons aged ≥13 years living with diagnosed HIV infection at year-end 2019 in the 45 jurisdictions with complete laboratory reporting, no demographic group or group with infection attributed to any of the transmission categories met the forthcoming EHE target of 95% (Figure 14).
Figure 14. Viral Suppression among Persons Aged ≥13 Years Living with Diagnosed HIV Infection, by Selected Characteristics, 2019—44 States and the District of Columbia
Note. See Guide to Acronyms and Initialisms, Data Tables, and Technical Notes for more information on definitions and data specifications.
aIncludes Asian/Pacific Islander legacy cases.
bHispanic/Latino persons can be of any race.
Prevalence–based HIV Care Continuum—Overview
The Prevalence-based HIV Care Continuum describes each step of the continuum as a percentage of the total number of people living with HIV (diagnosed or undiagnosed). The denominator is the estimated number of persons aged ≥13 years living with diagnosed or undiagnosed HIV infection at year-end 2019 (calculated using the first CD4 test after HIV diagnosis and a CD4 depletion model indicating disease progression). The numerator is extrapolated from the 45 jurisdictions with complete CD4 and viral load reporting (apply the percentage from 45 jurisdictions to the total number of people living with diagnosed HIV in the United States). For more information on Definitions and Data Specifications, see Technical Notes.
Uses of the prevalence-based continuum include monitoring testing efforts in the United States and demonstrating the importance of diagnosing HIV infections to achieve viral suppression, monitoring how the United States is doing among all persons living with HIV, and comparing United States data to other countries who monitor the continuum among all persons living with HIV.
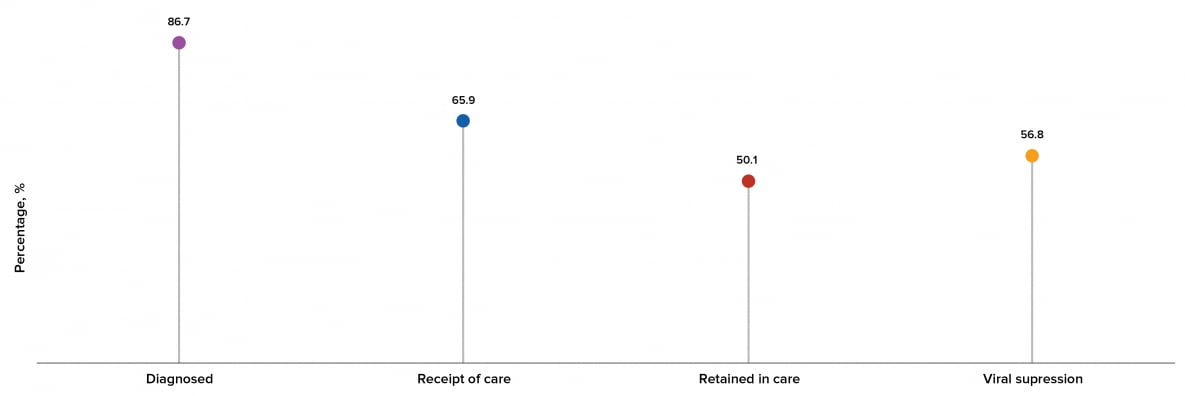
Among the estimated 1.2 million people living with HIV in the United States, 87% received a diagnosis, 66% received HIV medical care in 2019, 50% were retained in HIV medical care, and 57% were virally suppressed (Table 5, Figure 15).
Figure 15. Prevalence-based HIV Care Continuum for Persons Aged ≥13 Years Living with HIV Infection (Diagnosed or Undiagnosed) at Year-end 2019—United States
Note. See Guide to Acronyms and Initialisms, Data Tables, and Technical Notes for more information on definitions and data specifications.
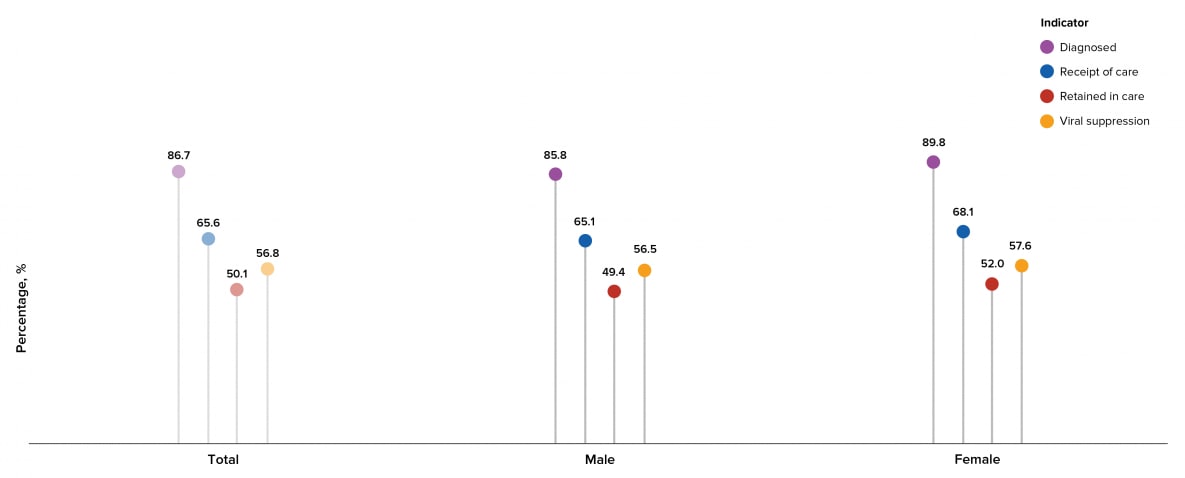
Among persons living with HIV in the United States, a higher percentage of females received a diagnosis, received HIV medical care in 2019, were retained in HIV medical care, and were virally suppressed than males (Table 5, Figure 16).
Figure 16. Prevalence-based HIV Care Continuum for Persons Aged ≥13 Years Living with HIV Infection (Diagnosed or Undiagnosed) at Year-end 2019, by Sex at Birth—United States
Note. See Guide to Acronyms and Initialisms, Data Tables, and Technical Notes for more information on definitions and data specifications.
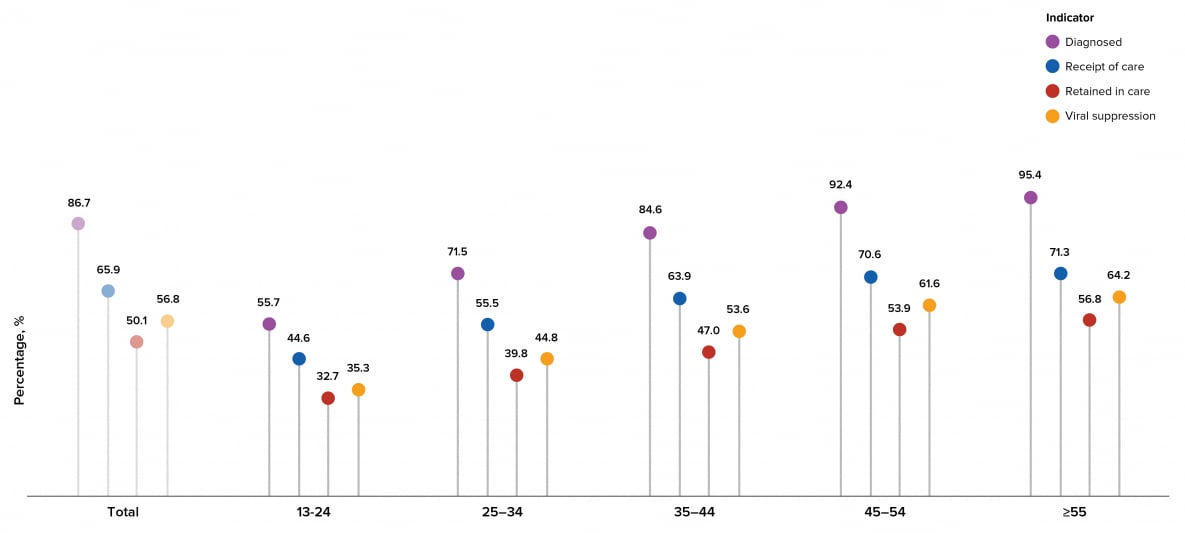
Among persons living with HIV in the United States, a higher percentage of persons aged ≥55 years received a diagnosis than other age groups, a higher percentage of persons aged ≥45 years received HIV medical care in 2019 than other age groups, a higher percentage of persons aged ≥55 years were retained in HIV medical care than other age groups, and a higher percentage of persons aged ≥55 years were virally suppressed than persons in other age groups. A lower percentage of persons aged 13-24 years received a diagnosis, received HIV medical care in 2019, were retained in HIV medical care, and were virally suppressed than other age groups (Table 5, Figure 17).
Figure 17. Prevalence-based HIV Care Continuum for Persons Aged ≥13 Years Living with HIV Infection (Diagnosed or Undiagnosed) at Year-end 2019, by Age—United States
Note. See Guide on Acronyms and Initialisms, Data Tables, and Technical Notes for more information on Definitions and Data Specifications.
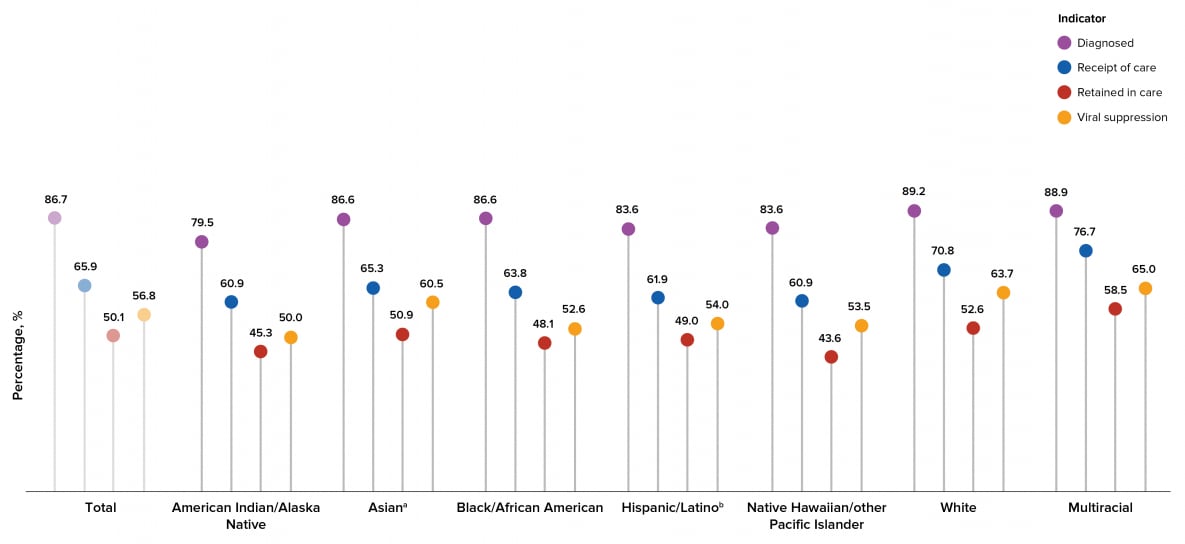
Among persons living with HIV in the United States, higher percentages of White and multiracial persons received a diagnosis than other racial/ethnic groups, a higher percentage of multiracial persons received HIV medical care in 2019 than other racial/ethnic groups, a higher percentage of multiracial persons were retained in HIV medical care than other racial/ethnic groups, and higher percentages of multiracial and White persons were virally suppressed than other racial/ethnic groups. A lower percentage of American Indian or Alaska Native persons received a diagnosis than other racial/ethnic groups, lower percentages of American Indian or Alaska Native and Native Hawaiian or other Pacific Islander persons received HIV medical care in 2019 than other racial/ethnic groups, lower percentages of Native Hawaiian or other Pacific Islander and American Indian or Alaska Native persons were retained in HIV medical care than other racial/ethnic groups, and a lower percentage of American Indian or Alaska Native persons were virally suppressed than other racial/ethnic groups (Table 5, Figure 18).
Figure 18. Prevalence-based HIV Care Continuum for Persons Aged ≥13 Years Living with HIV Infection (Diagnosed or Undiagnosed) at Year-end 2019, by Race/Ethnicity—United States
Note. See Guide on Acronyms and Initialisms, Data Tables, and Technical Notes for more information on Definitions and Data Specifications.
aIncludes Asian/Pacific Islander legacy cases.
bHispanic/Latino persons can be of any race.
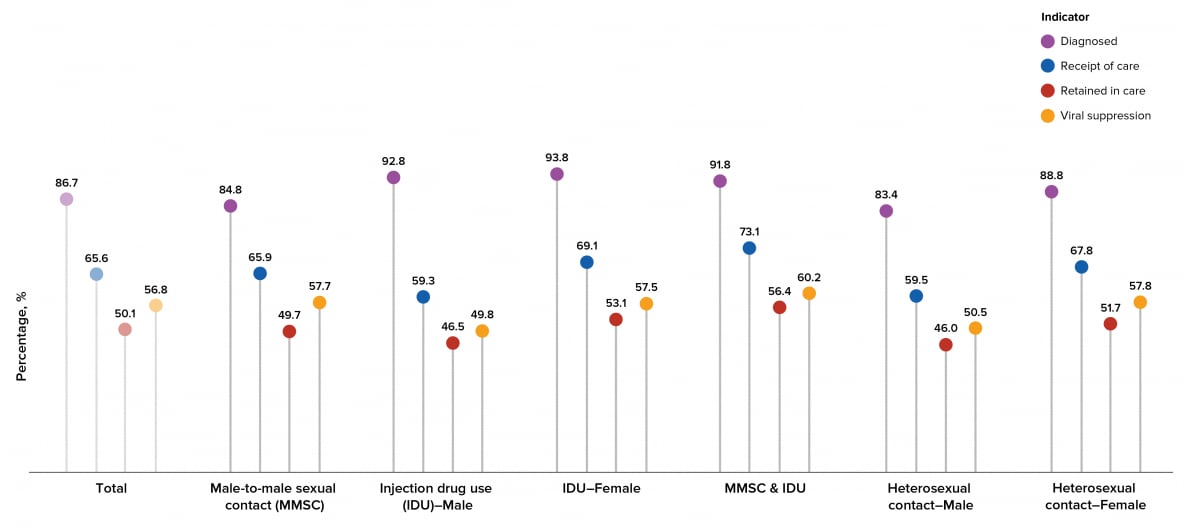
Among persons living with HIV in the United States, a higher percentage of persons (females and males) with infection attributed to IDU received a diagnosis than persons with infection attributed to other transmission categories, a higher percentage of males with infection attributed to MMSC-IDU received HIV medical care in 2019 than persons with infection attributed to other transmission categories, a higher percentage of males with infection attributed to MMSC-IDU were retained in HIV medical care than persons with infection attributed to other transmission categories, and higher percentages of males with infection attributed to MMSC and females with infection attributed to heterosexual contact were virally suppressed than persons with infection attributed to other transmission categories. A lower percentage of males with infection attributed to heterosexual contact received a diagnosis than persons with infection attributed to other transmission categories, a lower percentage of males with infection attributed to heterosexual contact received HIV medical care in 2019 than persons with infection attributed to other transmission categories, lower percentages of males with infection attributed to heterosexual contact and males with infection attributed to IDU were retained in HIV medical care than persons with infection attributed to other transmission categories, and lower percentages of males with infection attributed to heterosexual contact and males with infection attributed to IDU were virally suppressed than persons with infection attributed to other transmission categories (Table 5, Figure 19).
Figure 19. Prevalence-based HIV Care Continuum for Persons Aged ≥13 Years Living with HIV Infection (Diagnosed or Undiagnosed) at Year-end 2019, by Transmission Category—United States
Note. See Guide on Acronyms and Initialisms, Data Tables, and Technical Notes for more information on Definitions and Data Specifications.
Stage 3 (AIDS) at Time of Diagnosis of HIV Infection, and Death and Survival after Diagnosis of HIV Infection
Data from the 50 states, the District of Columbia, and 6 U.S. dependent areas (where indicated) were used for analyses of stage 3 (AIDS) at the time of diagnosis of HIV infection (even when not all CD4 values are reportable), and deaths and survival of persons with diagnosed HIV infection ≥13 years of age.
Stage 3 (AIDS) classification at time of diagnosis of HIV infection
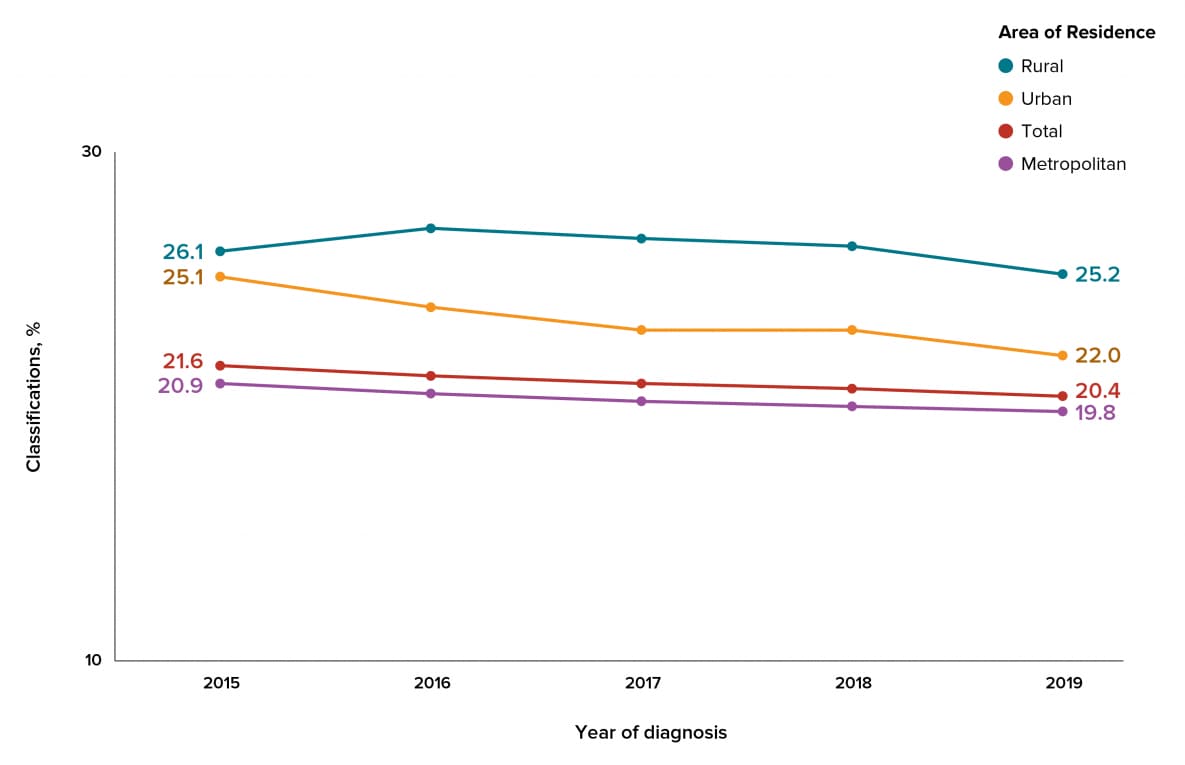
From 2015 through 2019, the percentage of stage 3 (AIDS) classifications or late-stage diagnoses varied among persons with an HIV diagnosis in each area of residence or subgroup in the United States (Table 6a). The percentage of stage 3 (AIDS) classifications decreased overall and in metropolitan and urban areas from 2015 through 2019 (Figure 20). The percentage of stage 3 (AIDS) classifications remained stable among persons living in rural areas. In 2019, the highest percentage was 25.2% in rural areas, followed by 22.0% in urban and 19.8% in metropolitan areas.
Figure 20. Stage 3 (AIDS) at Time of Diagnosis of HIV Infection among Persons Aged ≥13 Years, by Year of Diagnosis and Population Area of Residence, 2015–2019—United States
Note. See Guide on Acronyms and Initialisms, Data Tables, and Technical Notes for more information on Definitions and Data Specifications.
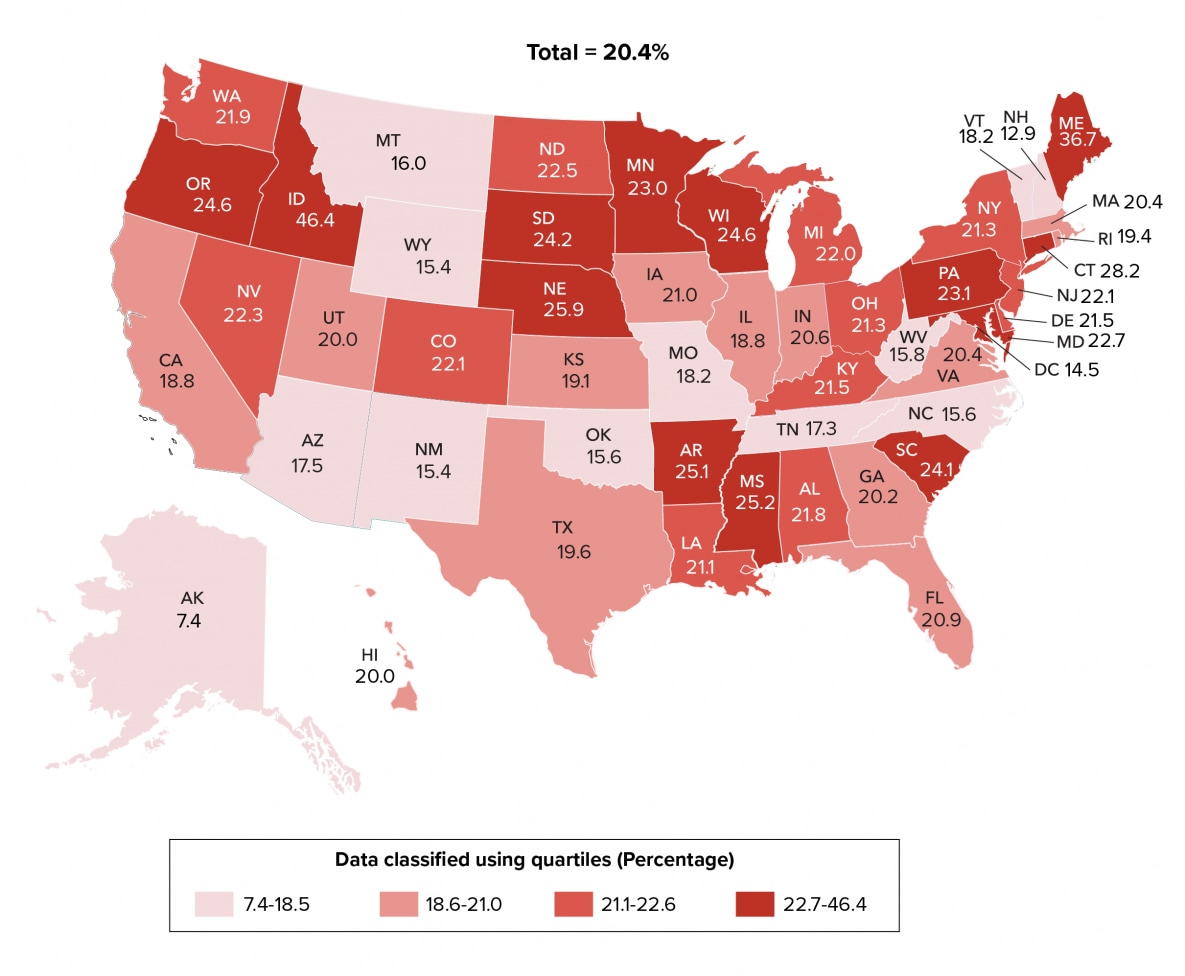
In the United States and 6 dependent areas, more than one in five persons (20.4%) received a late-stage diagnosis (stage 3, AIDS) among 36,740 persons with an HIV diagnosis during 2019. The percentages of a late-stage diagnosis were highest in the dependent areas (25.1%) and the Northeast (22.0%) compared to other regions (Table 6b). During 2019, 13 states (Arkansas, Connecticut, Idaho, Maine, Maryland, Minnesota, Mississippi, Nebraska, Oregon, Pennsylvania, South Carolina, South Dakota, and Wisconsin) in the highest 25% had the highest percentages (≥22.7) of persons who received a late-stage diagnosis. Twelve states (Alaska, Arizona, Missouri, Montana, New Hampshire, New Mexico, North Carolina, Oklahoma, Tennessee, Vermont, West Virginia, Wyoming) and the District of Columbia were in the lowest 25% and had the lowest percentages (≤18.5) of persons who received a late-stage diagnosis (Table 6c, Figure 21).
Figure 21. Stage 3 (AIDS) at the Time of Diagnosis of HIV Infection among Persons Aged ≥13 Years, by Area of Residence, 2019—United States
Note. See Guide to Acronyms and Initialisms, Data Tables, and Technical Notes for more information on Definitions and Data Specifications.
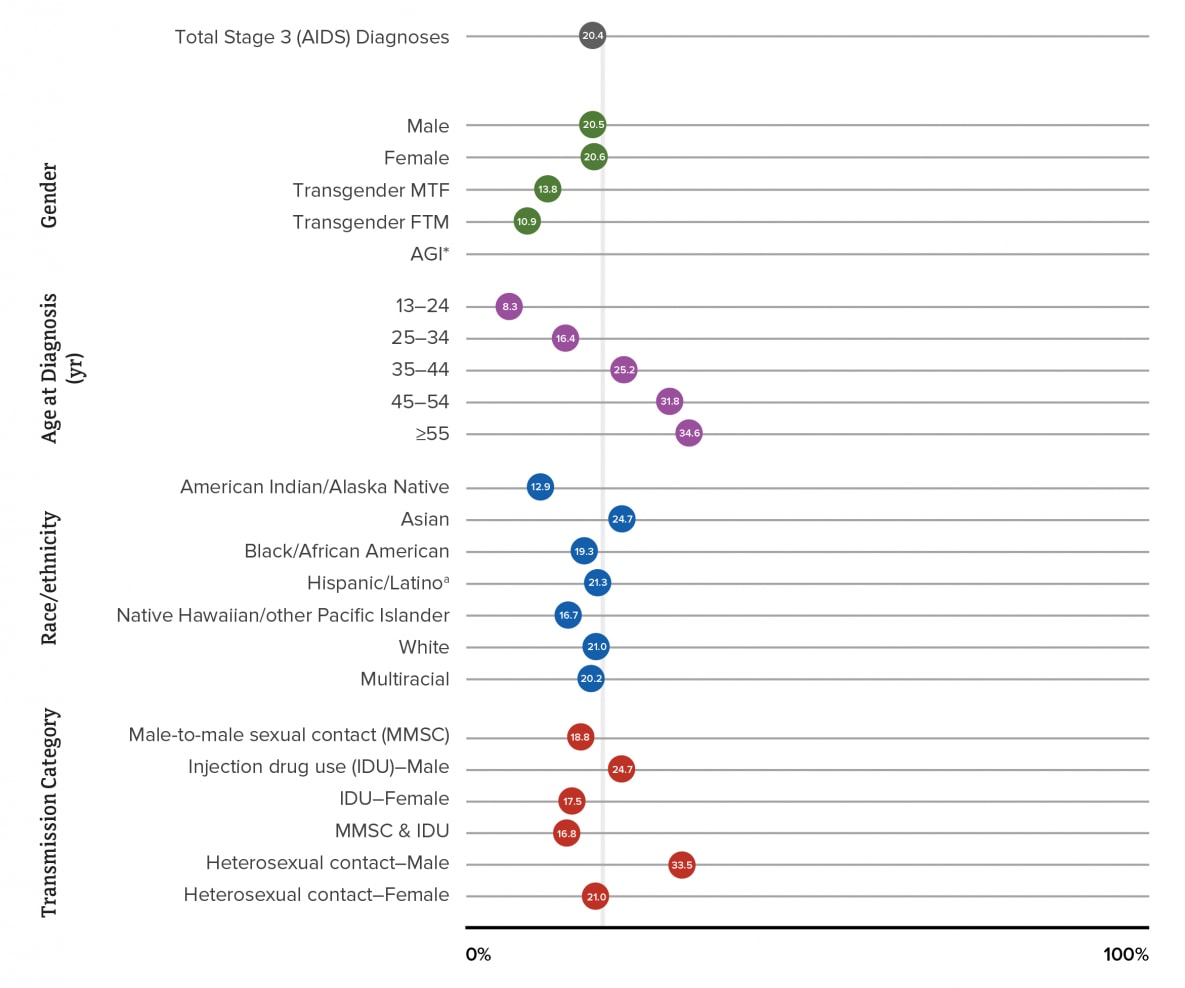
In 2019, the highest percentages of a late-stage diagnosis in the United States and 6 dependent areas by selected characteristics (i.e., gender, age, race/ethnicity, and transmission category) were for females (20.7%), males (20.5%), persons aged ≥45 years at time of diagnosis (45–54 years: 31.9%; ≥55 years: 34.5%), Asian persons (24.9%), and males with infection attributed to heterosexual contact (33.4%) (Table 6a, Figure 22). Please use caution when interpreting data for persons of additional gender identity (AGI), transgender female-to-male (FTM) persons, and Native Hawaiian/other Pacific Islander persons: the numbers are small.
Figure 22. Stage 3 (AIDS) at Time of Diagnosis of HIV Infection among Persons Aged ≥13 Years, by Selected Characteristics, 2019—United States
Note. See Guide on Acronyms and Initialisms, Data Tables, and Technical Notes for more information on Definitions and Data Specifications.
aHispanic/Latino persons can be of any race.
Deaths
Annual rates of death among adults and adolescents aged ≥13 years were calculated per 100,000 population and per 1,000 persons with diagnosed HIV infection or with infection ever classified as stage 3 (AIDS). Age-adjusted rates per 100,000 population and per 1,000 persons with diagnosed HIV infection or with infection ever classified as stage 3 (AIDS) were also calculated and are presented by area of residence.
Deaths of persons with diagnosed HIV infection
From 2015 through 2019 in the United States and 6 dependent areas, the annual rate of deaths per 100,000 population and the annual rate per 1,000 persons with diagnosed HIV infection decreased (Table 7b). Trends in rates varied by area of residence at death (Table 7c). In 2019, the age-adjusted rates were 5.2 per 100,000 population and 12.1 per 1,000 persons with diagnosed HIV infection.
During 2019, 12 states (Alabama, Arkansas, Delaware, Iowa, Louisiana, Maine, Missouri, Ohio, Oklahoma, South Carolina, Tennessee, and West Virginia) in the highest 25% had the highest age-adjusted rates of death (≥14.0) per 1,000 persons with diagnosed HIV infection. Twelve states (Colorado, Idaho, Kansas, Massachusetts, Minnesota, Montana, Nevada, New Hampshire, North Dakota, South Dakota, Utah, Vermont) and the District of Columbia were in the lowest 25% and had the lowest age-adjusted rates of death (≤9.9) per 1,000 persons with diagnosed HIV infection (Table 7c, Figure 23). Please note that due to incomplete reporting of deaths for the year 2019, data for Kansas, Massachusetts, Mississippi, Nevada, North Dakota, and Vermont should be interpreted with caution.
Figure 23. Age-Adjusted Rates of Deaths among Persons Aged ≥13 Years with Diagnosed HIV infection, by Year of Death and Area of Residence, 2019—United States
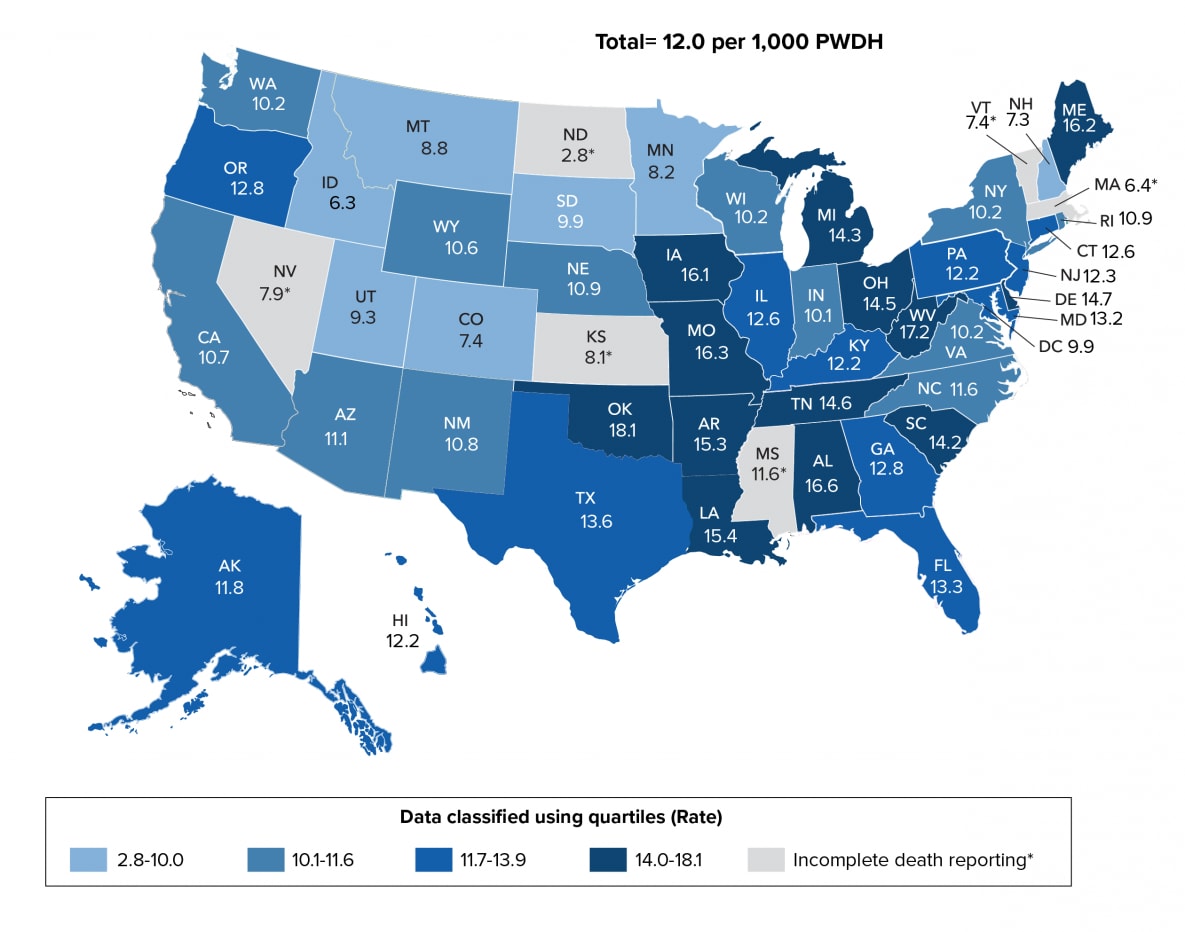
Note. Data for the year 2019 are preliminary and based on deaths reported to CDC as of December 2020. Rates per 1,000 persons with diagnosed HIV infection. See Guide to Acronyms and Initialisms, Data Tables, and Technical Notes for more information on Definitions and Data Specifications.
Deaths of persons with stage 3 (AIDS) classification
From 2015 through 2019 in the United States and 6 dependent areas, the annual rate of deaths per 100,000 population and the annual rate per 1,000 persons with stage 3 (AIDS) decreased (Table 7e). Trends in rates varied by area of residence at death (Table 7f). In 2019, the age-adjusted rates were 4.0 per 100,000 population and 18.1 per 1,000 persons with stage 3 (AIDS).
During 2019, 13 states (Alabama, Arkansas, Delaware, Florida, Louisiana, Maine, Michigan, Missouri, Ohio, Oklahoma, Tennessee, Texas, and West Virginia) in the highest 25% had the highest age-adjusted rates of deaths (≥20.8) per 1,000 persons with diagnosed HIV infection ever classified as Stage 3 (AIDS). Twelve states (Alaska, Colorado, Idaho, Indiana, Massachusetts, Mississippi, Nebraska, New Hampshire, New Mexico, North Dakota, Vermont, Wyoming) and the District of Columbia were in the lowest 25% and had the lowest age-adjusted rates of deaths (≤13.7) per 1,000 persons with diagnosed HIV infection ever classified as Stage 3 (AIDS) (Table 7f, Figure 24). Please note that due to incomplete reporting of deaths for the year 2019, data for Kansas, Massachusetts, Mississippi, Nevada, North Dakota, and Vermont should be interpreted with caution.
Figure 24. Age-Adjusted Rates of Deaths among Persons Aged ≥13 Years with Diagnosed HIV infection Ever Classified as Stage 3 (AIDS), by Year of Death and Area of Residence, 2019—United States
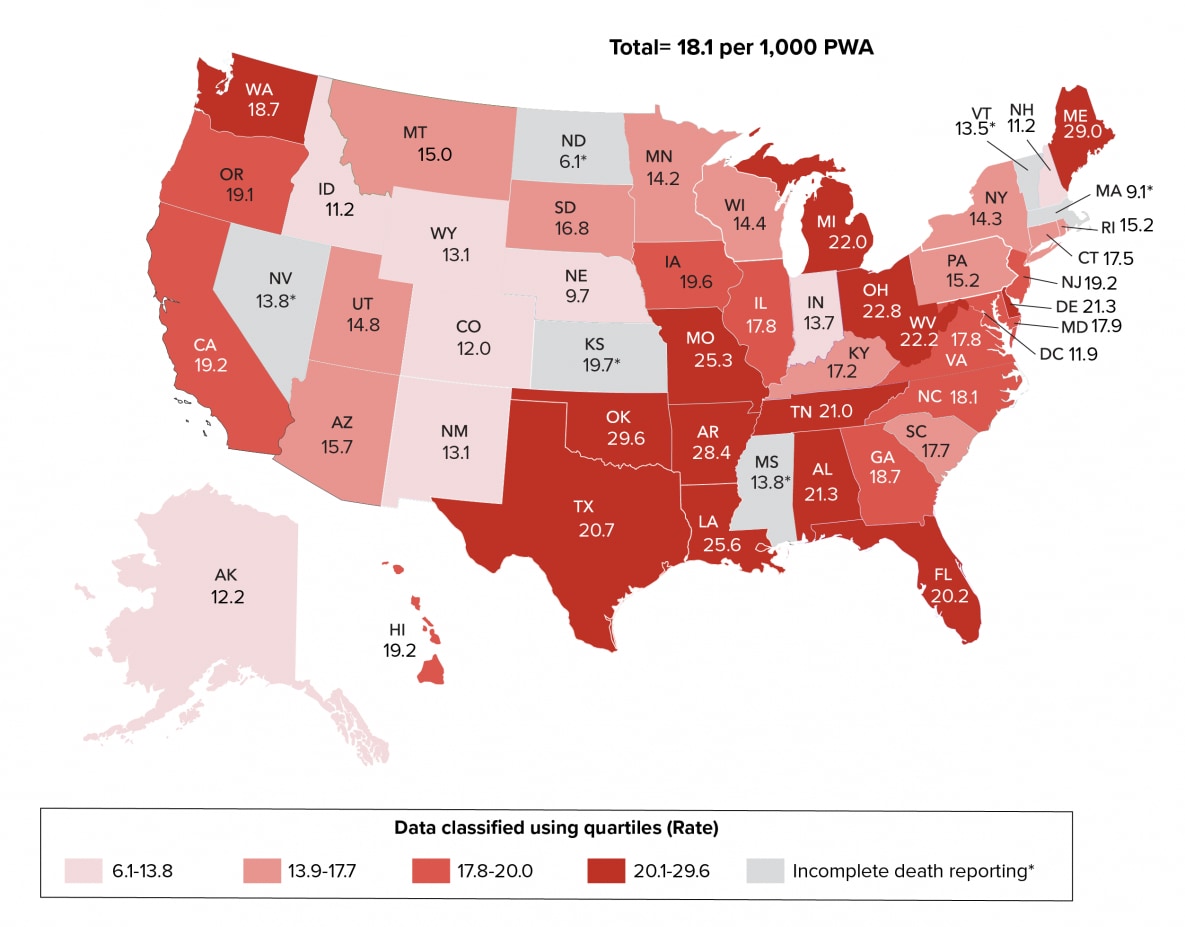
Note. Data for the year 2019 are preliminary and based on deaths reported to CDC as of December 2020. Rates per 1,000 persons with diagnosed HIV infection ever classified as stage 3 (AIDS). See Guide to Acronyms and Initialisms, Data Tables, and Technical Notes for more information on Definitions and Data Specifications.
Survival for > 3 years after diagnosis of HIV infection
In the United States, survival for >3 years after a diagnosis of HIV infection was above 94% and remained stable for diagnoses that were made during 2011–2016 (Table 8a). The following percentages are for persons in the United States who survived >3 years after receiving a diagnosis in 2016 (Figure 25).
By gender, the highest percentage was for transgender MTF persons (96%), followed by males (95%) and females (94%). Percentages for transgender FTM persons and persons of AGI are not displayed because the number of cases were too small for the calculation of reliable survival estimates.
By age, the highest percentage was for persons aged 13–24 years (99%) and the lowest percentage was for persons aged ≥55 years (83%).
By race/ethnicity, the highest percentages were for Asian and Hispanic or Latino persons (96%), followed by American Indian or Alaska Native (95%), Black or African American (95%), multiracial (94%), and White persons (93%). Percentages for Native Hawaiian or other Pacific Islander persons are not displayed because the number of cases was too small for the calculation of reliable survival estimates.
By transmission category, the highest percentage was for males with infection attributed to MMSC (96%), followed by females with infection attributed to heterosexual contact (95%) and males with infection attributed to MMSC–IDU (94%). The lowest percentages were for males and females with infection attributed to IDU (86%, 89% respectively).
By area of residence, at least 93% of persons survived >3 years after diagnosis in all but 1 area (Table 8c).
Figure 25. Survival for >3 Years after Diagnosis of HIV Infection in 2016, by Selected Characteristics—United States
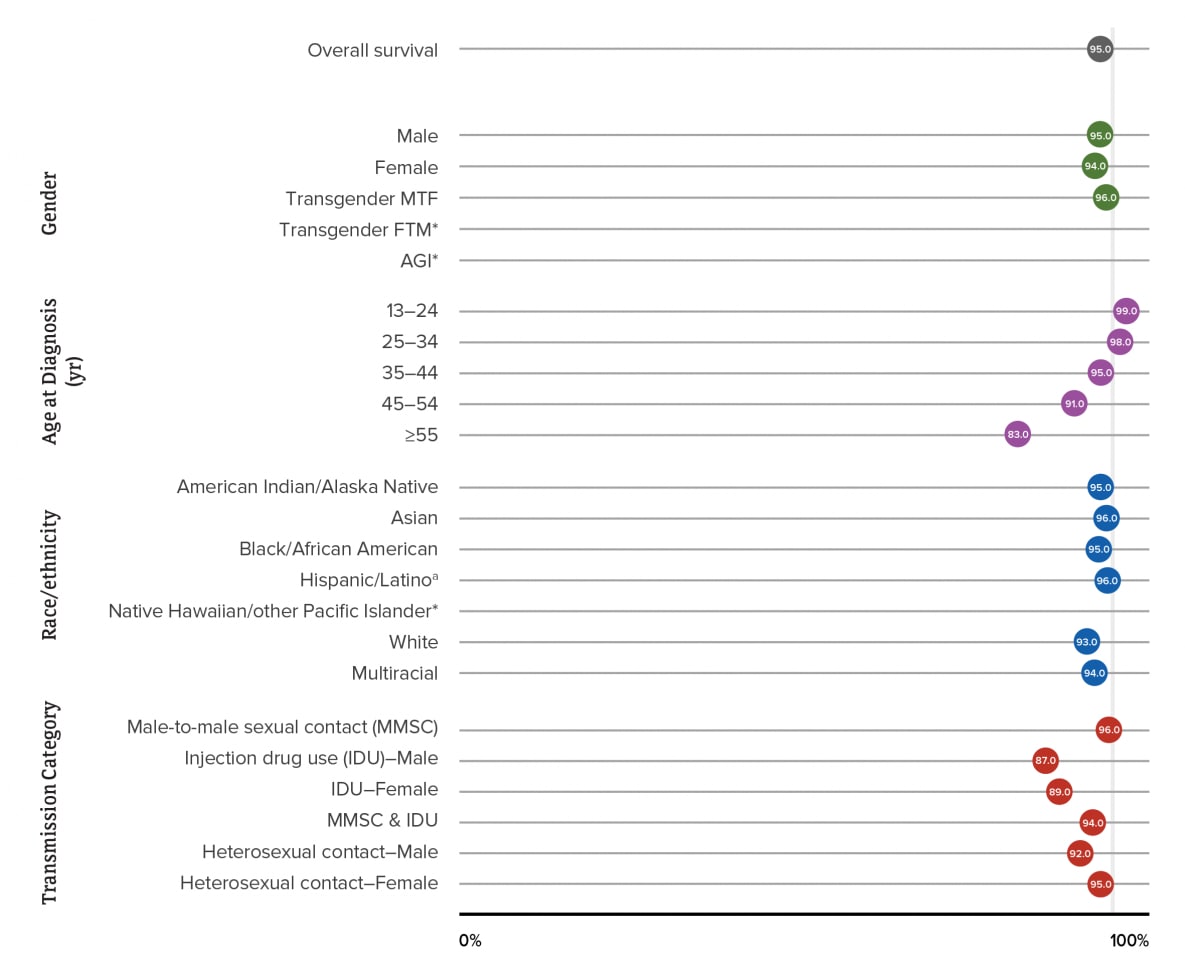
Note. Asterisk (*) indicates sample too small (<600 diagnoses during the 6-year period) for the calculation of meaningful survival estimates. See Guide to Acronyms and Initialisms, Data Tables, and Technical Notes for more information on Definitions and Data Specifications.
aHispanic/Latino persons can be of any race.
Survival for >3 years after stage 3 (AIDS) classification was below 90% and remained stable over time (Table 8d). The following percentages are for persons who survived >3 years after receiving a stage 3 (AIDS) classification in 2016.
By gender, the highest percentage was for transgender MTF persons (92%). The lowest percentages were for males and females (86%). Percentages for transgender FTM persons and persons of AGI are not displayed because the number of cases were too small for the calculation of reliable survival estimates.
By age, the highest percentage was for persons aged 13–24 years (96%) and the lowest percentage was for persons aged ≥55 years (71%).
By race/ethnicity, the highest percentage was for Hispanic or Latino persons (90%), followed by Asian (89%), Black or African American (86%), and multiracial persons (84%). The lowest percentage was for White persons (82%). Data for American Indian or Alaska Native and Native Hawaiian or other Pacific Islander persons are not displayed because the numbers of cases were too small for the calculation of reliable survival estimates.
By transmission category, the highest percentage was for males with infection attributed to MMSC (88%), followed by females with infection attributed to heterosexual contact (87%), males with infection attributed to MMSC-IDU (84%), and males with infection attributed to heterosexual contact (83%). The lowest percentages were for males and females with infection attributed to IDU (74%, 79% respectively).
By area of residence, at least 83% of persons survived >3 years after stage 3 (AIDS) classification in all but 1 area (Table 8f).
Preexposure Prophylaxis (PrEP) Coverage and Persons Prescribed PrEP
The number of persons classified as having been prescribed PrEP, the estimated number of persons with PrEP indications, and PrEP coverage in the United States were produced using data from several sources: the IQVIA Real-World Longitudinal Prescriptions database, NHSS, NHANES, and the U.S. Census American Community Survey (ACS). For more information, see Technical Notes.
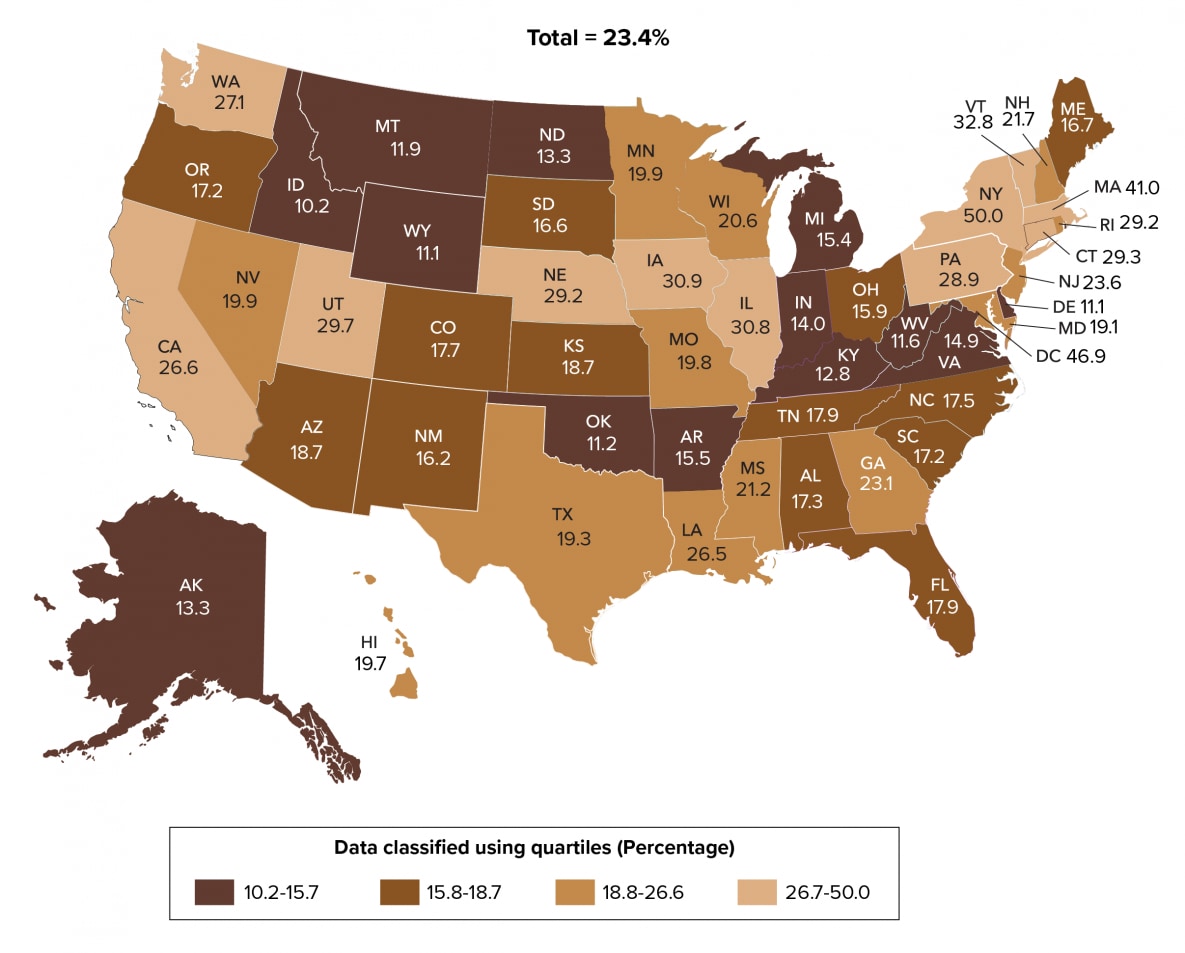
By using the pharmacy and other national data sources, we estimated 1.2 million persons in the United States had indications for PrEP and 23.4% were prescribed PrEP in 2019 (Table 9a).
PrEP coverage varied by area of residence. Twelve states (California, Connecticut, Illinois, Iowa, Massachusetts, Nebraska, New York, Pennsylvania, Rhode Island, Utah, Vermont, and Washington) and the District of Columbia were in the top 25% and had the highest percentages (≥26.7%) of PrEP coverage. Thirteen states (Alaska, Arkansas, Delaware, Idaho, Indiana, Kentucky, Michigan, Montana, North Dakota, Oklahoma, Virginia, West Virginia, and Wyoming) in the lowest 25% had the lowest percentages (15.7%) of PrEP coverage (Table 9a, Figure 26).
Figure 26. PrEP Coverage among Persons Aged ≥16 years, by Area of Residence, 2019—United States
Note. See Guide to Acronyms and Initialisms, Data Tables, and Technical Notes for more information on definitions and data specifications.
PrEP coverage was nearly three times as high among males (26.5%) as among females (9.7%). The highest percentages of PrEP coverage were for persons aged 25–44 years (25–34 years: 26.7%; 35–44 years: 27.7%). The lowest percentage was for persons aged 16–24 years (15.6%). In 2019, after adjusting for missing race/ethnicity, the highest percentage was for White persons (63.3%), followed by Hispanic or Latino (14.0%) and Black or African American persons (8.2%) (Figure 27).
Figure 27. PrEP Coverage among Persons Aged ≥16 Years, by Selected Characteristics, 2019—United States
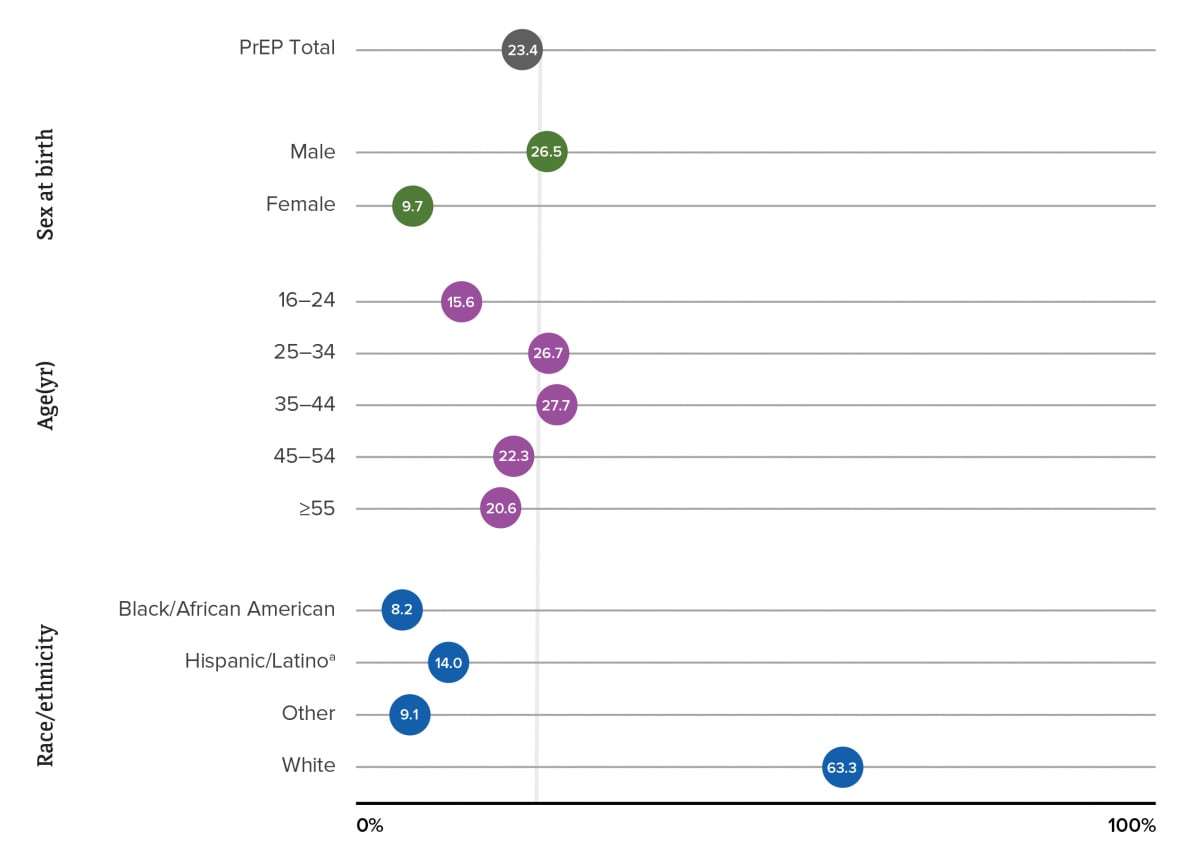
Note. See Guide to Acronyms and Initialisms, Data Tables, and Technical Notes for more information on definitions and data specifications. Race/ethnicity data were only available for < 40% of persons prescribed PrEP in each year. Number prescribed PrEP and PrEP coverage for race/ethnicity reported in the table were adjusted applying the distribution of records with known race/ethnicity to records with missing race/ethnicity.
aHispanic/Latino persons can be of any race.