


At a glance
Disasters and emergencies can happen any time, so it’s important for communities to be prepared. CDC’s Environmental Public Heath Tracking Program provides data tools and resources to help residents prepare for and respond to emergencies.

Use data to prepare and respond
Knowing a community's hazards, resources, and vulnerabilities can help public health professionals make decisions before, during, and after an emergency.
CDC's Environmental Public Health Tracking Network brings together health, environmental, hazard, and population data from national, state, and local sources. These data can help communities identify threats, understand who may be at increased risk, plan resources, and take action to help prevent illness, injury, and death.
Tracking data can support preparedness and response for hazards such as:
- Extreme heat
- Hurricanes and tropical storms
- Wildfires and smoke
- Flooding and heavy precipitation
- Poor air quality
- Other natural disasters and public health emergencies
>>Explore preparedness & response datasets, resources, and tools.
Emergency Preparedness and Response View

Use the Emergency Preparedness and Response View in CDC's Data Explorer to find data commonly used for hazard assessment, emergency planning, and recovery.
This special view provides focused and centralized information to support planning and decision-making during an emergency. It enables quicker assessments of the breadth and variety of community resources and vulnerabilities.
>>Learn more or explore the Emergency Preparedness and Response View
Use dashboards for specific hazards
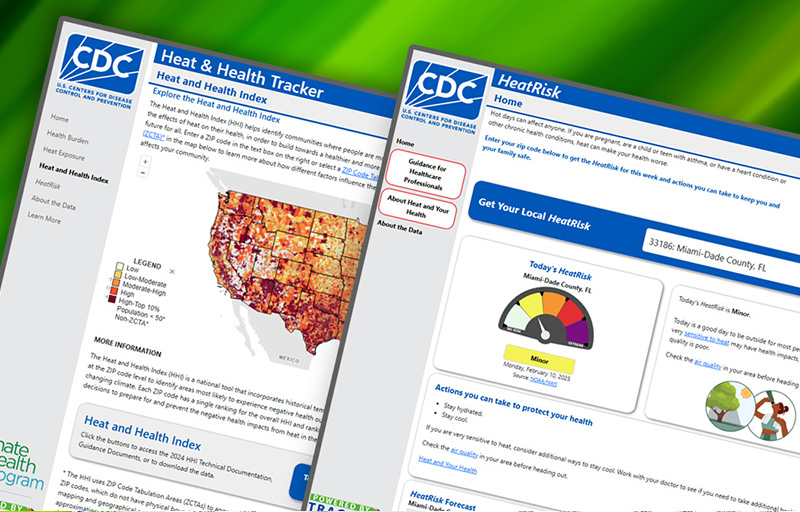
Tracking offers interactive dashboards that bring together information for specific environmental health threats.
CDC's Hurricane Dashboard
Use the CDC Hurricane Dashboard to support preparedness, response, and recovery planning. Explore active and recently active storms along with information about affected populations, health, environmental conditions, critical facilities, and power outages.
>>Explore CDC's Hurricane Dashboard
CDC's HeatRisk Dashboard
Tracking provides heat and health data that can help communities understand local heat risks and plan actions to protect health. CDC's HeatRisk Dashboard allows people to access important heat and health information in an easy-to-use, intuitive, mobile-friendly interface. The dashboard provides important heat and health information right alongside CDC's new clinical guidance materials for people at higher risk from heat-related health effects who may need to take more protective actions.
Wildfire Smoke Tool

Wildland fires can impact the air quality in your community. Tracking's Data Explorer has a tool which allows users to visualize real-time wildland fire smoke with a smoke layer overlay. To check wildfire smoke levels near you right now
- Visit CDC's Data Explorer and select a data set.
- Click the blue "hamburger" menu icon on the upper right corner of the map.
- Click on the "gear" icon and click on "Overlay Layer and Surface Smoke" to view the real-time surface smoke layer.
This page was last updated on this date. Updates may include minor edits, image changes, or other modifications to page content.
The information on this page was last reviewed by subject matter experts to ensure accuracy.