At a glance
Background
As of March 3, 2026, health authorities have identified 990 cases of measles in the Upstate region of South Carolina; the majority of cases are centered around Spartanburg County. State health authorities first reported the outbreak on October 2, after confirming eight cases in the region. Spartanburg County has lower MMR vaccination coverage in schools (88.9%) than the state average (93.7%) and is home to a large, close-knit community of approximately 15,000 people with low vaccination coverage. Ninety-five percent of cases reported to date (945/990) are unvaccinated or have unknown vaccination status.
To inform preparedness and decision-making for the current outbreak, we outline three scenarios for the course of the measles outbreak in South Carolina, including implications for the region and beyond. CDC's Center for Forecasting and Outbreak Analytics (CFA), in collaboration with the CDC Measles Response and the South Carolina Department of Public Health, developed these scenarios based on what is known about the current outbreak and insights from previous measles outbreaks in the United States. We also outline indicators for each scenario and use the latest evidence to assess which scenario best characterizes how the outbreak is likely to progress. We note that measles outbreaks as large as this outbreak are rare in the United States, and past comparisons are limited. CDC produced previous versions of this scenario assessment on January 2, 2026, and January 20, 2026 and will continually evaluate the current outbreak and update the scenarios as warranted.
Two key unknowns in this outbreak are the level of baseline population immunity in South Carolina, either from prior infection or vaccination, as well as the level of connectivity with other under-vaccinated populations. We use two different transmission models to explore how varying baseline immunity in the Upstate region of South Carolina and varying levels of connectivity with other regions of South Carolina could affect the trajectory of the outbreak. Model output demonstrates that high baseline immunity, including through high vaccination coverage, is key to protecting communities from measles outbreaks, particularly in places with connections to communities with ongoing outbreaks.
Potential future outbreak scenarios
We outline three qualitative scenarios for the potential course of the current outbreak which started in October 2025:
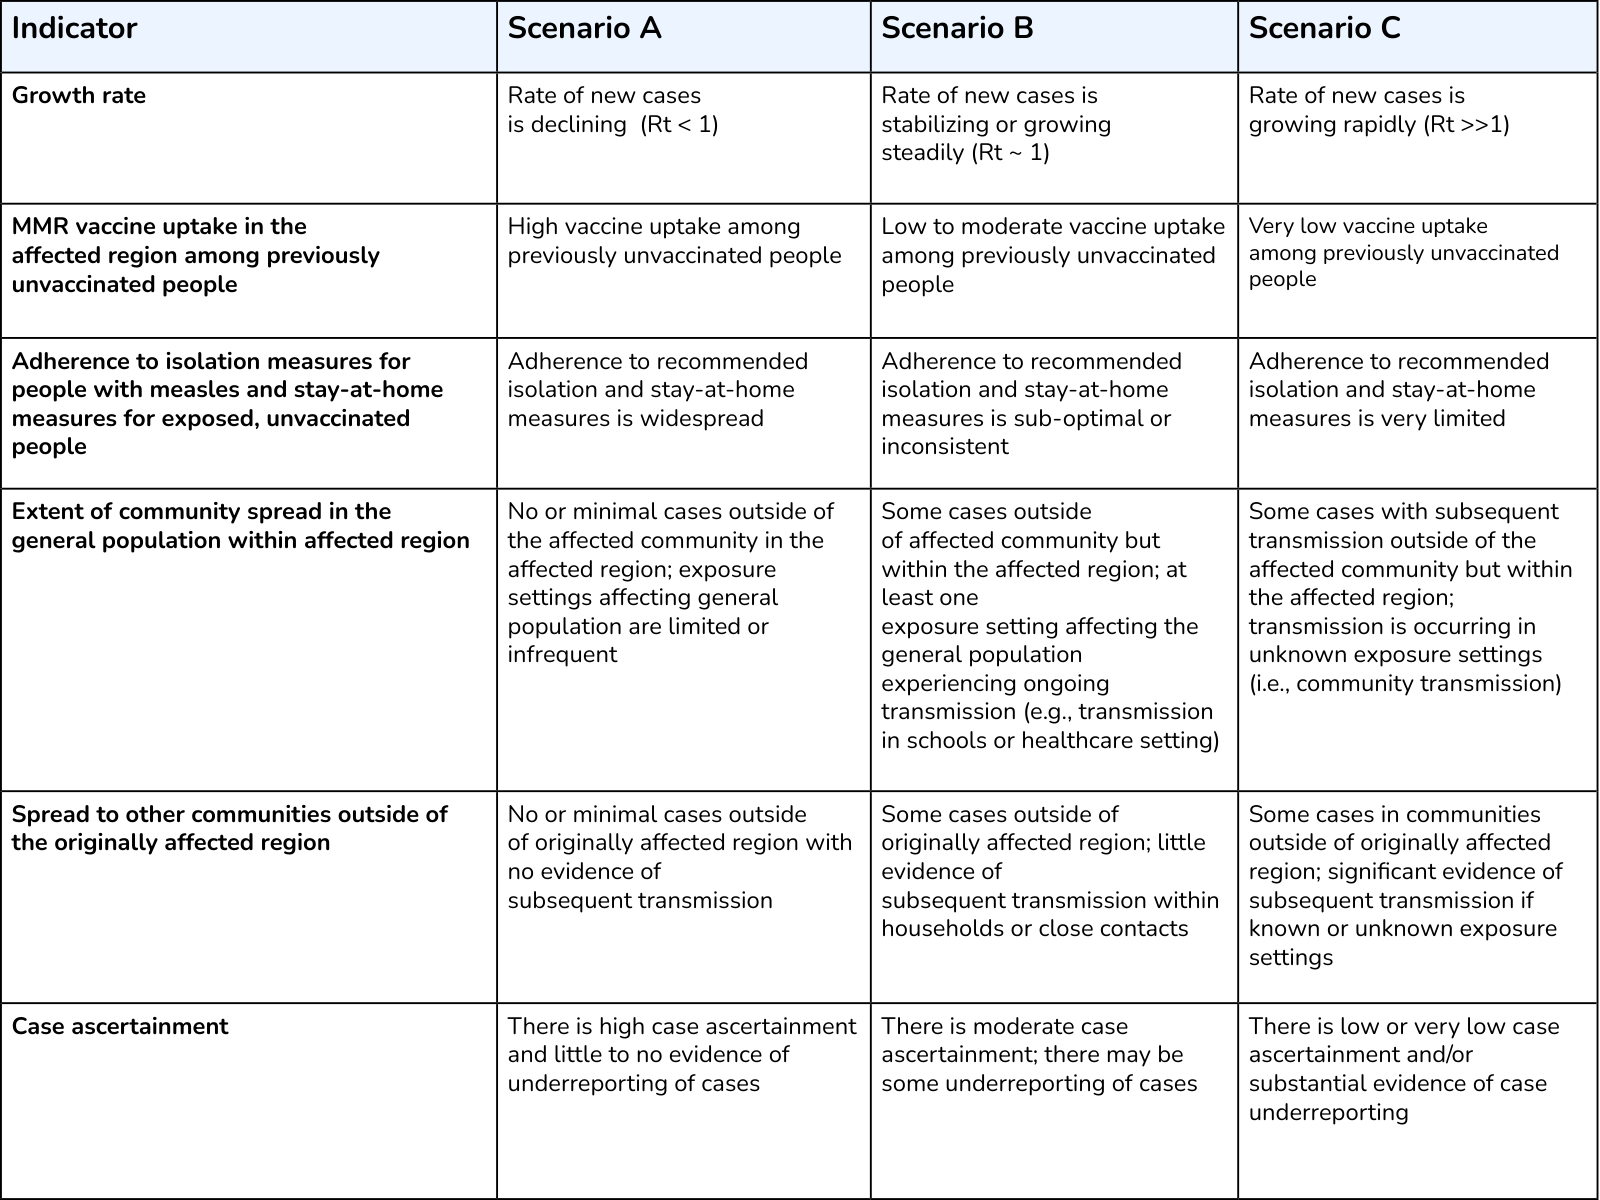
Scenario A: A smaller outbreak, lasting less than six months, mostly limited to the currently affected community. Cases outside of the Upstate region of South Carolina would be rare and would have known epidemiological links to the current outbreak. The outbreak may have a similar intensity to the 2014 outbreak of measles in an under-immunized community in Ohio.
- This scenario is more likely if intervention measures are rapidly implemented, and MMR vaccine uptake is high in response to the outbreak among people in the region who were previously unvaccinated.
Scenario B: A larger outbreak, lasting at least six months, with some spread outside of the currently affected community but mostly limited to the Upstate region. There may be some measles exposures and cases outside of this region that cause no or limited subsequent transmission. This scenario may have similarities to two outbreaks in under-immunized communities in 2018-2019.
- This scenario may be more likely if adherence to control measures is sub-optimal or inconsistent and if there is low to moderate MMR vaccine uptake in response to the outbreak among people who were previously unvaccinated.
- Additional resources may be needed in this scenario to respond to outbreaks in areas outside of the currently affected region, including additional support for local public health and hospital systems.
Scenario C: A much larger outbreak, lasting more than six months, with substantial spread outside of the Upstate region of South Carolina to other communities with low vaccination rates. This scenario may be similar to or more severe than the outbreak that originated in West Texas in January 2025.
- This scenario is more likely to occur if adherence to measles control measures is very limited, if there is very low MMR vaccine uptake in response to the outbreak among people who were previously unvaccinated, and if there are frequent connections between communities with low vaccination coverage across different states.
- Spread to other communities with low vaccination coverage would lead to compounding impacts on the South Carolina population. In this scenario, substantial public health resources may be needed for rapid detection and control of ongoing spread in other regions of South Carolina. Hospital systems and medical facilities in outbreak areas may experience additional burden.
Key indicators of outbreak scenario
We examine the latest outbreak data and evidence, including insights from modeling analysis, to determine which of the three scenarios is most likely to occur with the current outbreak. We identified a set of indicators that we use to assess which scenario is currently most likely (Appendix Table 1). Indicators are not exhaustive, and not all indicators must be met to assess that the outbreak is in a given scenario. We rely on numerous factors, including epidemiologic evidence, to evaluate indicators and determine which scenario is most likely.
Assessment of most likely future scenario
As of March 3, 2026, indicators suggest the current outbreak is mostly closely following Scenario B (Figure 1).
- The rate of new cases is declining (Rt< 1)A, a change from our previous scenario assessment on January 20, 2026 (where the rate of new cases was rapidly increasing).
- Currently, there is no evidence that unvaccinated residents of the affected region are receiving MMR vaccine in high enough numbers to substantially reduce transmission.
- There is evidence that people with measles are self-isolating and that unvaccinated people who have a known exposure are staying at home.
- There are limited cases in more than one type of exposure setting, including households, schools, universities, churches, and healthcare settings. The number of households, schools, churches, and healthcare settings with ongoing transmission are limited. This is a change from our previous assessment on January 20, 2026, when we assessed that there were documented chains of transmission in numerous types of exposure settings.
- Sporadic cases of measles have been identified in regions outside of Spartanburg County. However, there is not substantial evidence of subsequent and sustained transmission in new geographic regions of South Carolina at this time.
- Case ascertainment is moderate. There are likely some undocumented cases of measles in the affected region, raising the risk of spread to other populations in the region or nearby regions.

Key uncertainties
We note several uncertainties related to the epidemiology of the current outbreak that affect our assessment of likely outbreak futures:
- How readily people who have been exposed to measles or are symptomatic get tested and seek healthcare if needed; avoidance of testing or healthcare could give the impression that transmission is slowing when that is not the case.
- Adherence to public health recommendations for isolation and quarantine over time and across exposure settings, including households, schools (public and private), universities, churches, and healthcare settings.
- The size of close-knit communities with low vaccination coverage in this region, as well as level of connection to other similar communities around South Carolina.
- MMR vaccine coverage among the population in this region, particularly among close-knit, under-vaccinated communities in this region. Vaccination coverage among school-aged children may be used to estimate community-wide vaccination coverage, but it varies widely in this region.
- Extent of underreporting of cases to public health and how underreporting varies over time and by exposure settings.
As the public health response to this outbreak continues, we expect to receive more information on some of these uncertainties and will update our scenario assessment accordingly.
Modeling insights
We note two key uncertainties in this outbreak: the level of population immunity to measles, acquired from prior measles infection or MMR vaccination, in the Upstate region of South Carolina, and the level of connectivity of the Upstate region of South Carolina with other under-vaccinated communities in South Carolina. Here, we use two different transmission models to explore how varying baseline immunity in the Upstate region of South Carolina and varying levels of connectivity with other regions of South Carolina could affect the trajectory of the outbreak.
The Impact of Baseline Immunity Levels
First, we used a simple transmission model to show how measles infections and outbreak duration depend on the baseline immunity in the currently affected community (Figure 2, Table 1). Using the measles outbreak simulator tool developed by CDC, we evaluated potential outbreak size after one year across three scenarios of baseline immunity (Figure 2). The simulated outbreak begins with 5 cases of measles in a population of 15,000 individuals, and final outbreak size is measured by cumulative incident infections after one year. Baseline immunity values were 70%, 80%, and 90%, to reflect the wide possible range in baseline immunity in the Upstate region of South Carolina, as shown in South Carolina school vaccination dataB. This model is stochastic, with built-in random variation, meaning we run many individual simulations to produce a range of possible outcomes and estimates of associated uncertainty.
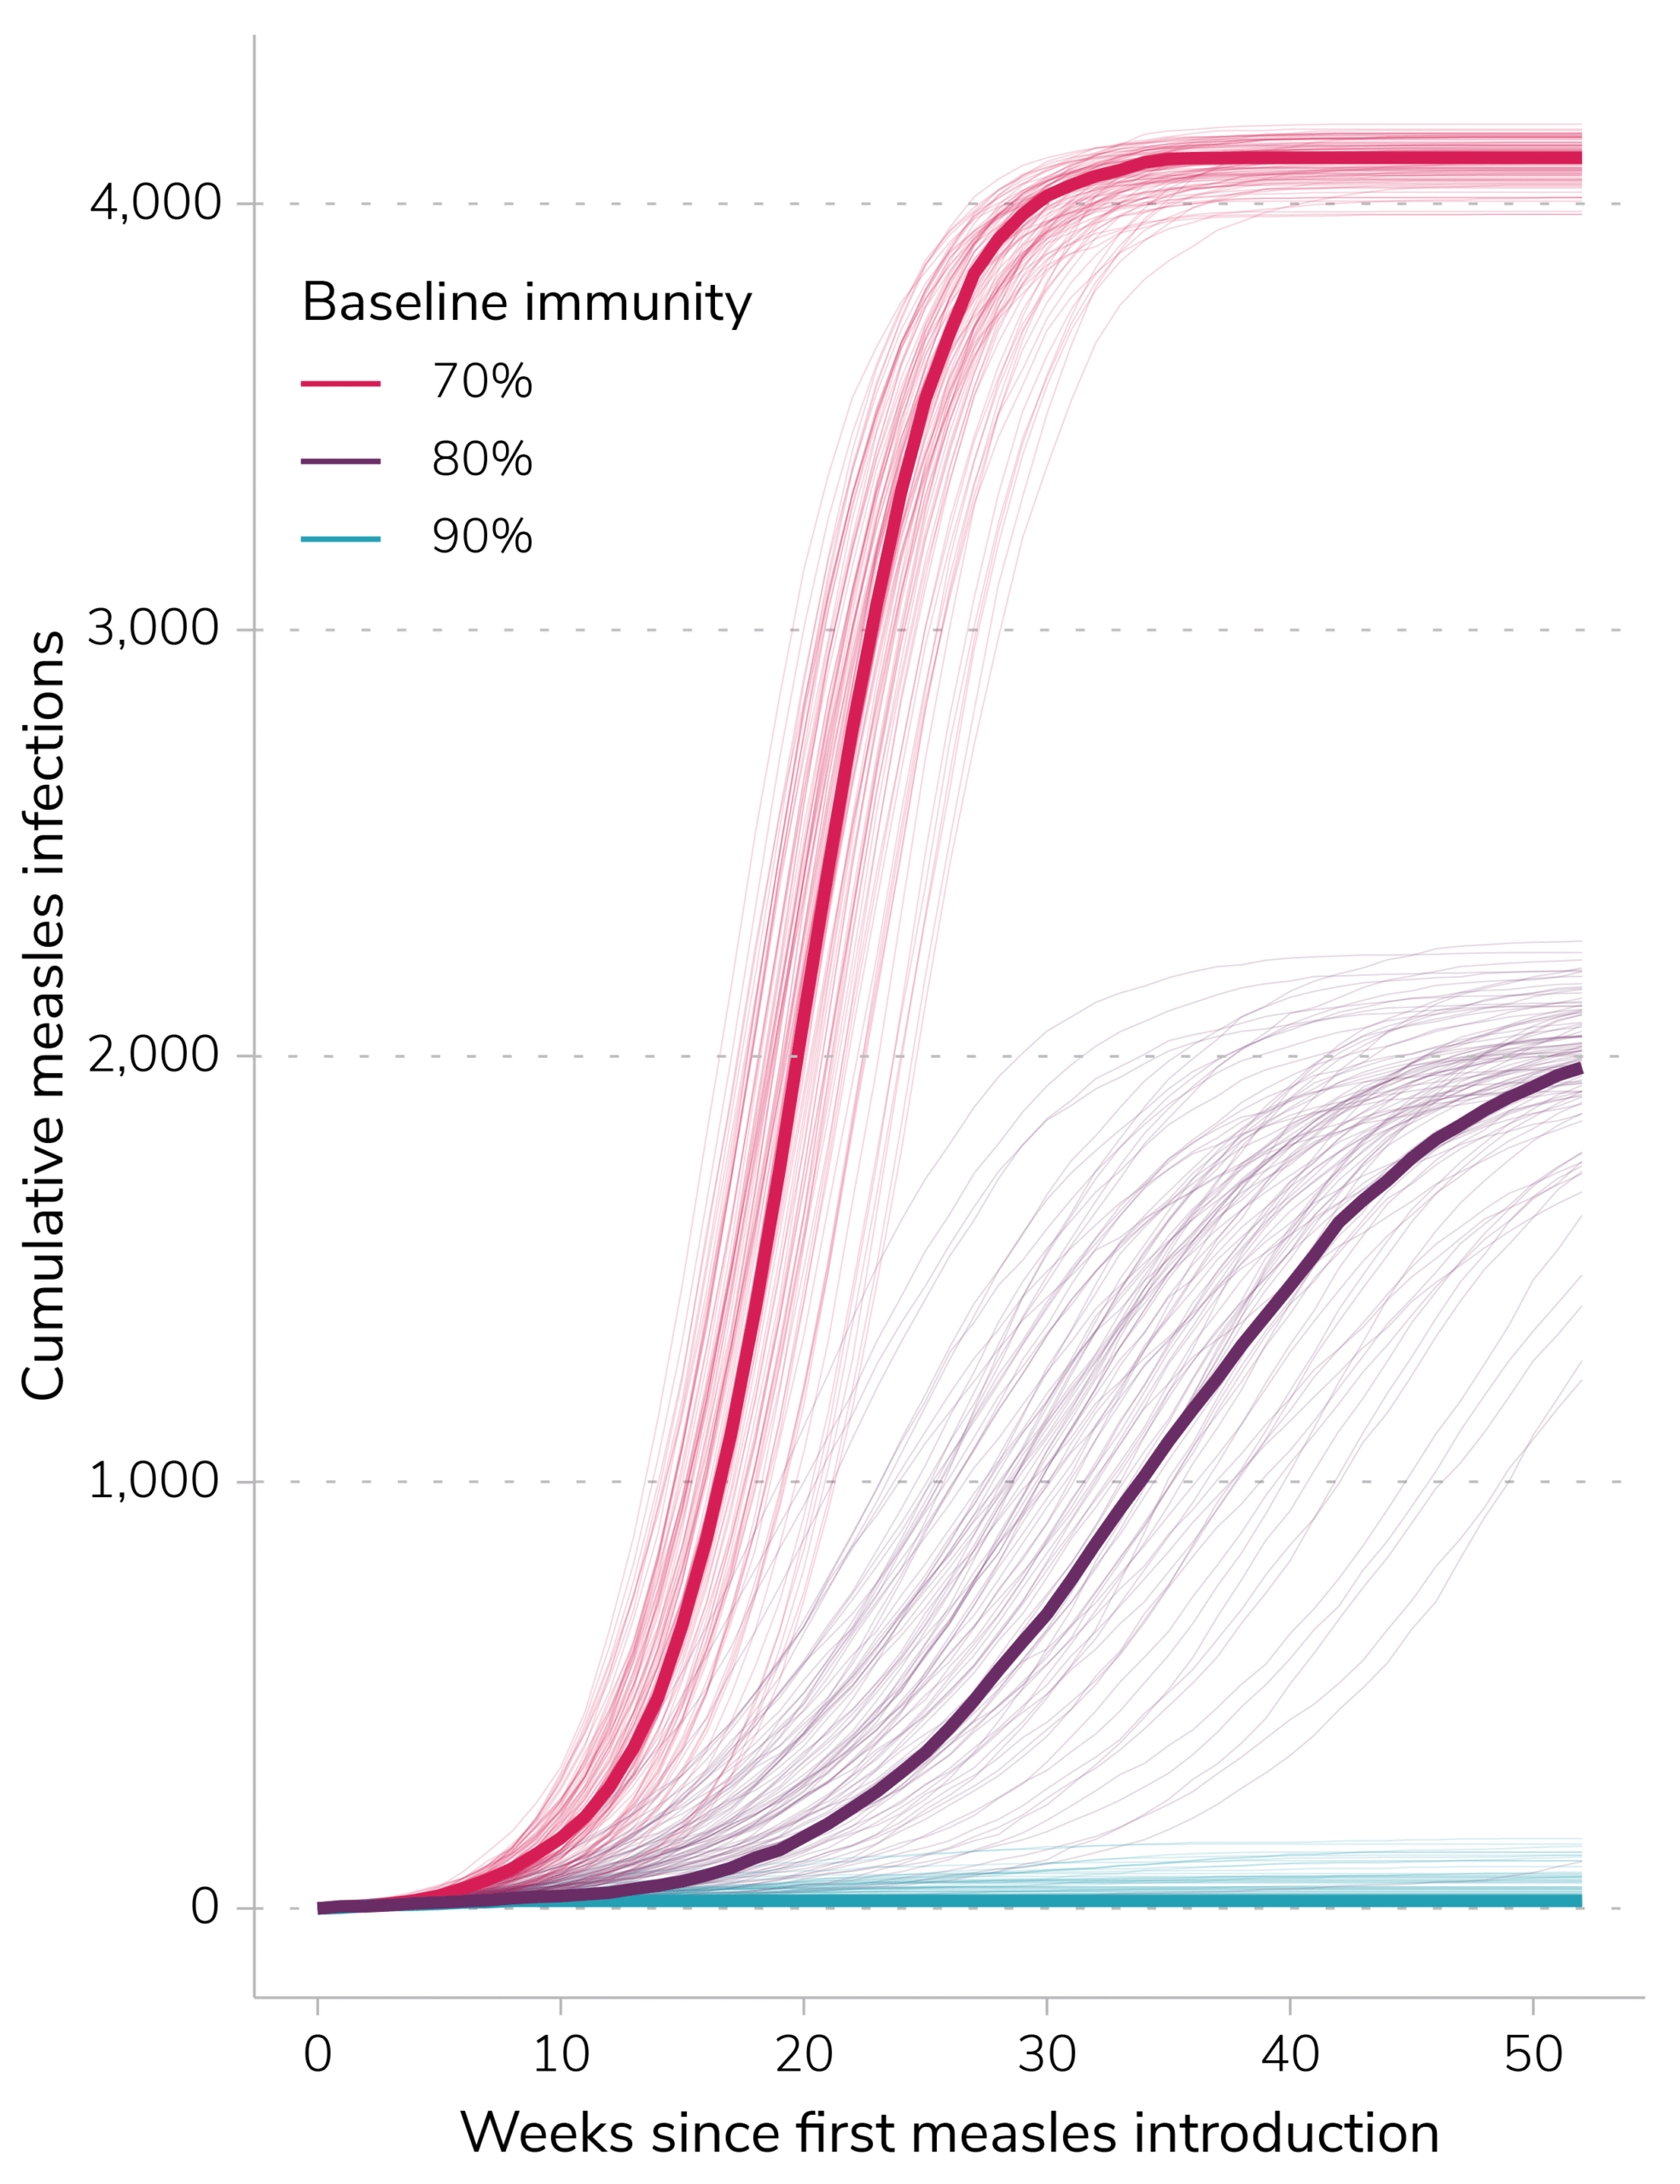
21 (5-146)
1,998 (11-2,226)
4,107 (3,982-4,172)
Table 1. Median cumulative infections at 365 days (95% prediction interval) with varying baseline immunity values following introduction of five measles infections into a community of 15,000 people. For each immunity level, isolation and quarantine adherence are set to 60%.
The Risk to Other Communities
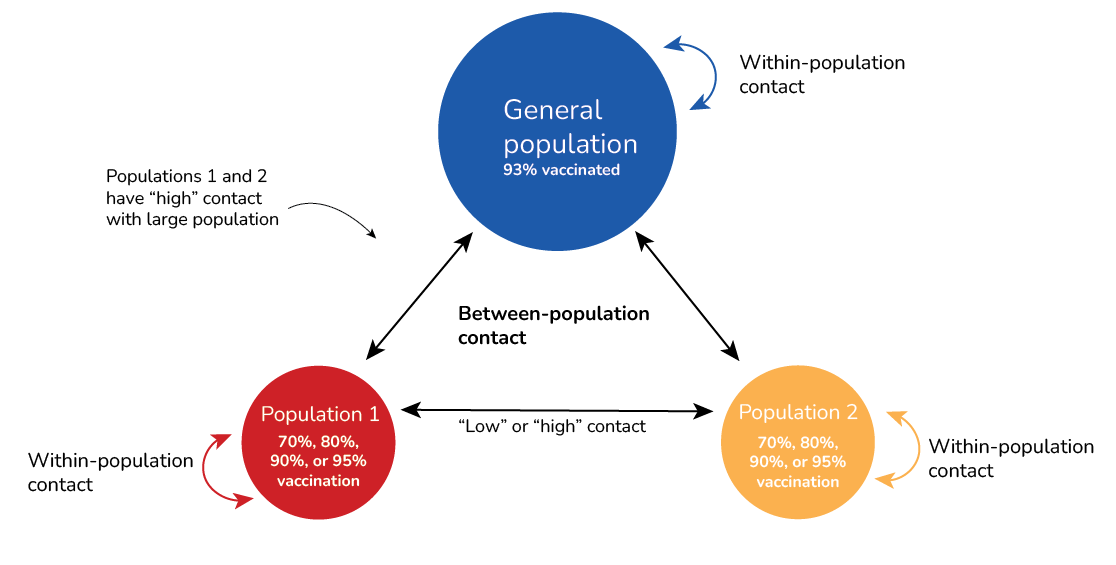
Given the importance of baseline immunity in the currently affected population and concern about spread to other areas of South Carolina, CDC used a stochastic metapopulation model to assess how vaccination coverage and connectivity between communities may each contribute to the risk of outbreaks in other communities (Figure 3). The simulated outbreak begins with 5 cases in population 1, which represents the current outbreak in an under-vaccinated community in the Upstate region of South Carolina. Population 2 is intended to represent a separate under-vaccinated community in South Carolina. We vary the level of connectivity between populations 1 and 2 (“low” vs. “high”) and vaccination coverage in population 1 and 2 (70% vs. 80% vs. 85% vs. 95%) to examine the role each of these factors play in the likelihood of an outbreak of more than 100 cases in populations 1 and 2, as well as in the much larger general population. See Appendix for additional detail on the structure of the model.
Model results indicate that in scenarios where MMR vaccination coverage is lower than 90% in populations 1 and 2, an outbreak in population 1 is highly likely to lead to cases and sustained transmission in population 2, as well as continued exposures and outbreaks in the general population (Figure 4). As MMR vaccination coverage in populations 1 and 2 increases, the probability of an outbreak with more than 100 cases decreases (Table 2). If populations 1 and 2 have more contact with each other (i.e., higher connectivity), the probability of an outbreak of 100 cases or more in population 2 increases (Table 2). When MMR vaccination coverage is low and outbreaks do happen in population 2, increased connectivity leads to outbreaks happening sooner, but does not significantly impact the average size of the outbreaks. These results highlight the importance of increasing MMR vaccination coverage to prevent outbreaks from occurring.
These modeling results highlight the importance of vaccination coverage in reducing the risk of large outbreaks, in any communities with some connection to an active outbreak.

| Connectivity between populations 1 and 2 | MMR Vaccination coverage (%) in populations 1 and 2 | Percent of simulations with an outbreak of more than 100 measles cases | ||
|---|---|---|---|---|
| In general population (n=350,000) | In population 1 (n=15,000) | In population 2 (n=15,000) | ||
| Lower | 70 | 100 | 100 | 100 |
| 80 | 100 | 100 | 100 | |
| 85 | 84 | 99 | 71 | |
| 90 | 7 | 79 | 14 | |
| Higher | 70 | 100 | 100 | 100 |
| 80 | 100 | 100 | 100 | |
| 85 | 97 | 98 | 98 | |
| 90 | 20 | 76 | 56 | |
Appendix
CDC initially produced this outbreak scenario assessment on January 2, 2026, and subsequently updated the assessment on January 20 and March 3. In order to follow changes in our assessments of the most likely future scenario over time, see below for the assessment completed on January 20, 2026.
As of January 20, 2026, health authorities have identified 646 cases of measles in the Upstate region of South Carolina, the majority of which are centered around Spartanburg County. State health authorities first reported the outbreak on October 2, after confirming eight cases in the region. Spartanburg County has lower MMR vaccination coverage than the state average and is home to a large, close-knit community of approximately 15,000 people with low vaccination coverage. Ninety-six percent of cases (621/646) are unvaccinated or have unknown vaccination status.
As of January 20, 2026, indicators suggest the current outbreak is mostly closely following Scenario B (Figure 5), although it remains possible that this assessment could change to a more pessimistic scenario as more information becomes available.
- The rate of new cases is growing rapidly (Rt > 1), and there have been substantial increases in reported cases following the holiday season.
- Currently, there is no evidence that unvaccinated residents of the affected region are receiving MMR vaccine in high enough numbers to substantially reduce transmission.
- There is evidence that people with measles are self-isolating and that unvaccinated people who have a known exposure are staying at home. However, as the outbreak has progressed, there is some evidence that adherence to public health guidance is decreasing.
- There are documented chains of transmission in more than one type of exposure setting, including households, schools, universities, churches, and healthcare settings. The number of households, schools, churches, and healthcare settings with ongoing transmission remains steady.
- Sporadic cases of measles have been identified in regions outside of Spartanburg County. However, there is not substantial evidence of subsequent transmission in new geographic regions of South Carolina at this time.
- Case ascertainment is moderate. There are likely some undocumented cases of measles in the affected region, raising the risk of spread to other populations in the region or nearby regions.

These indicators were assessed based on evaluation by CDC measles experts responding to this outbreak. It remains possible that this assessment could change to a more pessimistic scenario, particularly as more information on transmission in regions outside of Spartanburg County becomes available. Slowing transmission would require a high uptake of MMR vaccination among previously unvaccinated people, and high rates of self-isolation by people with measles, along with self-monitoring for symptoms and staying home among those who are unvaccinated and have a known exposure.
CDC initially produced this outbreak scenario assessment on January 2, 2026, and subsequently updated the assessment on January 20 and March 3. In order to follow changes in our assessments of the most likely future scenario over time, see below for the assessment completed on January 2, 2026.
As of January 2, 2026, health authorities have identified 185 cases of measles in the Upstate region of South Carolina, the majority of which are centered around Spartanburg County. State health authorities first reported the outbreak on October 2, after confirming eight cases in the region. Spartanburg County has lower MMR vaccination coverage than the state average and is home to a large, close-knit community of approximately 15,000 people with low vaccination coverage. There have been three hospitalizations and no deaths among confirmed measles cases in South Carolina. Ninety seven percent of cases (180/185) are unvaccinated, have unknown vaccination status, or are under investigation.
As of January 2, 2025, indicators suggest the current outbreak is mostly closely following Scenario B (Figure 6):
- The rate of new cases is still growing (Rt > 1). There is uncertainty on the exact value of Rt and it is unclear how the holidays will affect measles transmission in South Carolina, as well as reporting dynamics.
- Currently, there is no evidence that unvaccinated residents of the affected region are receiving MMR vaccine in high enough numbers to substantially reduce transmission.
- There is evidence that people with measles are self-isolating and that unvaccinated people who have a known exposure are staying at home.
- There are documented chains of transmission in more than one type of exposure setting, including households, schools, churches, and healthcare settings. The number of households, schools, churches, and healthcare settings with ongoing transmission remains steady.
- There is moderate case ascertainment of cases at this time. If there are undocumented cases of measles in the affected region, the risk of spread to other populations in the region or nearby regions may be higher.

In both models, we assume that 60% of people who are symptomatic and infectious follow isolation guidelines, that 60% of people who are pre-symptomatic and infectious follow quarantine guidelines, and that there are no ongoing vaccination campaigns over the course of the outbreak.
Baseline immunity model
We note that this modeling approach makes several simplifying assumptions and will not perfectly capture the dynamics of the outbreak in South Carolina. For example, this is a homogenous mixing model, meaning that all people in the community have the same probability of contact with each other. Given that the model does not capture age-specific mixing or household transmission patterns, these simulations likely overestimate the total number of cases. In addition, this modeling is intended to represent a tight-knit community and does not capture spread that occurs through introduction into the general population via schools or other exposure settings. The model also does not capture changes in behavior, vaccination uptake, and contact patterns that may occur over time in response to increases in cases or a long-running outbreak. Additional data on population immunity could help provide narrower bounds on outbreak size and duration. For more information on this model, see our previously published Behind the Model.
Community model
The model considers three populations: a larger population with 93% MMR vaccination coverage, and two smaller populations (populations 1 and 2) with low MMR vaccination coverage that represent under-vaccinated communities (Figure 2). Individuals in each population have a defined level of contact with others in their own population (within-population contact) and with individuals in the two other populations (between-population contact).
We vary the between-population contact, and the within-population contact for each population is scaled so that R0 is constant. Low connectivity is defined as contact where on average, one in 100 people in one of the smaller populations has contact with someone in the other small population per day. High connectivity is defined as contact where on average, one in 10 people in one of the smaller populations has contact with someone in the other small population per day.
Populations 1 and 2 have "high connectivity" with the large population, where one in 10 people in population 1 has contact with someone in the large population per day, and 1 in 10 people in population 2 has contact with someone in the large population per day.
| Parameter | Value | ||
|---|---|---|---|
| R0 | 15 | ||
| Average latent period | 11 days | ||
| Average infectious period | 9 days | ||
| Two-dose vaccine effectiveness | 97% | ||
| Quarantine adherence | 60% | ||
| Isolation adherence | 60% | ||
| Number of simulations | 1000 (Note: Figure 4 shows a random subset of 20 simulations for each scenario) | ||
| Large population | Population 1 | Population 2 | |
| Population size | 350,000 | 15,000 | 15,000 |
| Vaccination coverage | 93% | Varies (70%, 80%, 85%, 90%) | Varies (70%, 80%, 85%, 90%) |
- The basic reproductive number, R0, is defined as the expected number of new infections caused by each infected person in a fully susceptible population and in the absence of interventions. The time-varying effective reproductive number, known as Rt, is defined as the average number of new infections caused by each currently infectious person—reflecting current population susceptibility, interventions, and variant transmissibility at the time it is measured.
- Baseline immunity is a measure of immunity in the entire population, across all ages. School vaccination data only captures MMR coverage in specific ages among children and is therefore likely lower than in the population overall.