Easy access to national and state level CDC data on a range of key indicators.
Featured
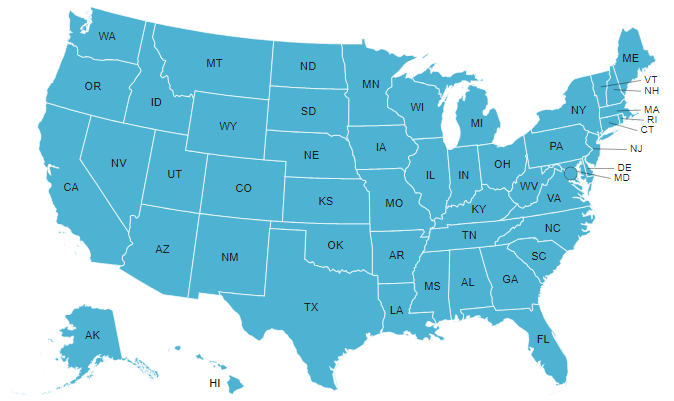
US health survey collecting data on risk behaviors, chronic conditions, and preventive services.
View the latest Behavioral Risk Factor Surveillance System (BRFSS) Data

About the National Health and Nutrition Examination Survey (NHANES)
Additional Topics

Information to help you stay healthy and strong throughout your life.

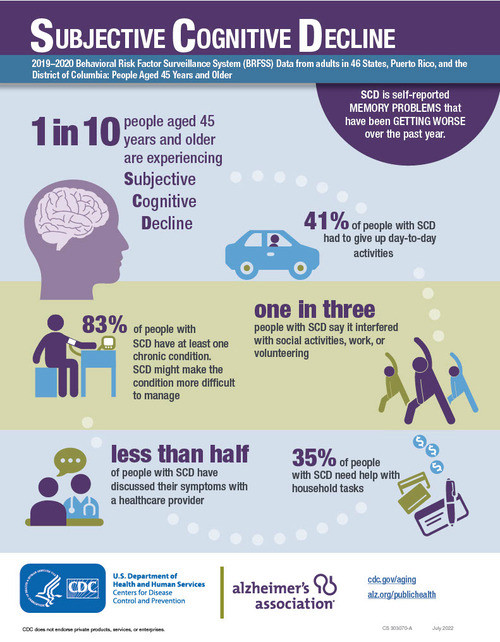
Explore causes, risks, signs, and getting help for symptoms.

Evidence-based information to educate and inform translating research into public health practice.

Find information about caregiving, self-care, and Care Plan creation.