Tuberculosis in the United States 2020 Slide Set
NOTE: The slide set is in the public domain. You may reproduce these slides without permission; however it is requested that you include an attribution that the materials were developed by CDC (e.g., “Source: CDC” or “Slides developed by CDC”). No substantive changes should be made to the content.
Slide - 1

Slide - 2
Slide - 3
Slide - 4
Slide - 5
Slide - 6
Slide - 7
Slide - 8
Slide - 9
Slide - 10
Slide - 11
Slide - 12
Slide - 13
Slide - 14
Slide - 15
Slide - 16
Slide - 17
Slide - 18

Slide - 19
Slide - 20
Slide - 21
Slide - 22
Slide - 23

Slide - 24
Slide - 25
Slide - 26
Slide - 27
Slide - 28
Slide - 29
Slide - 30
Slide - 31
Slide - 32
Slide - 33
Slide - 34
Slide - 35
Slide - 36
Slide - 37
Slide - 38
Slide - 39
Slide - 40
Slide - 41
Slide - 42
Slide - 43
Slide - 44
Slide - 45
Slide - 46
Slide - 47
Slide - 48
Slide - 49
Slide - 50
Slide - 51
Slide - 52
Slide - 53
Slide - 54
Slide - 55
Slide - 56
Slide - 57
Slide - 58
Slide - 59
Slide - 60
Slide - 61
Slide - 62
Slide - 63
Slide - 64
Slide - 65
Slide - 66
Slide - 67
Slide - 68

Slide - 69
Slide - 70
Slide - 71
Slide - 72
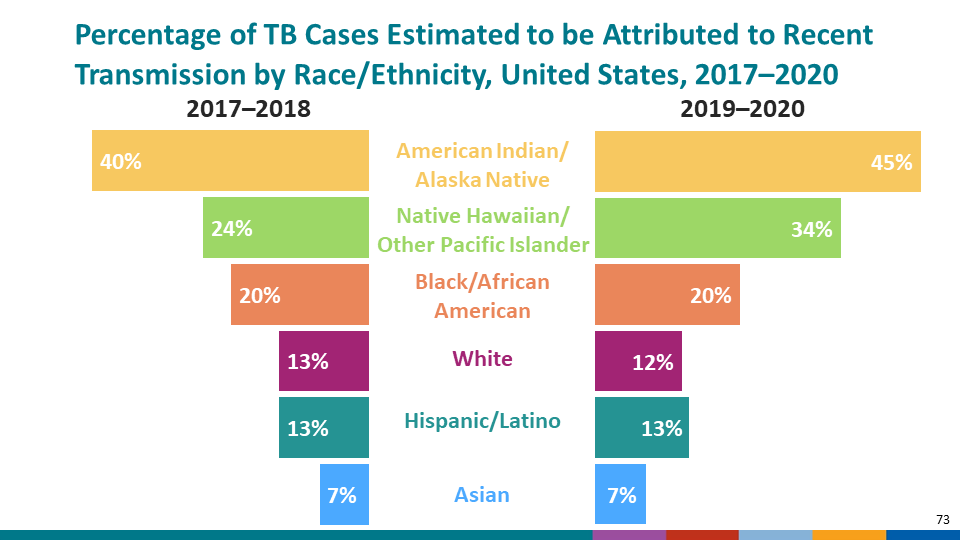
Slide - 73

Slide - 74
Slide - 75
National Tuberculosis Surveillance System Highlights from 2020
This slide series was developed as an accompaniment to the document Reported Tuberculosis in the United States, 2020
- Download complete set (75 slides) [PPT – 8 MB]
- PDF Version [PDF – 1 MB]
- Slide Set Narrative [PDF – 342 KB]
