Reported Tuberculosis in the United States, 2022
Table 9. Tuberculosis Cases and Percentages Among Non-U.S.–Born Persons1 by the Top 30 Countries2 of Birth: United States, 2018–2022
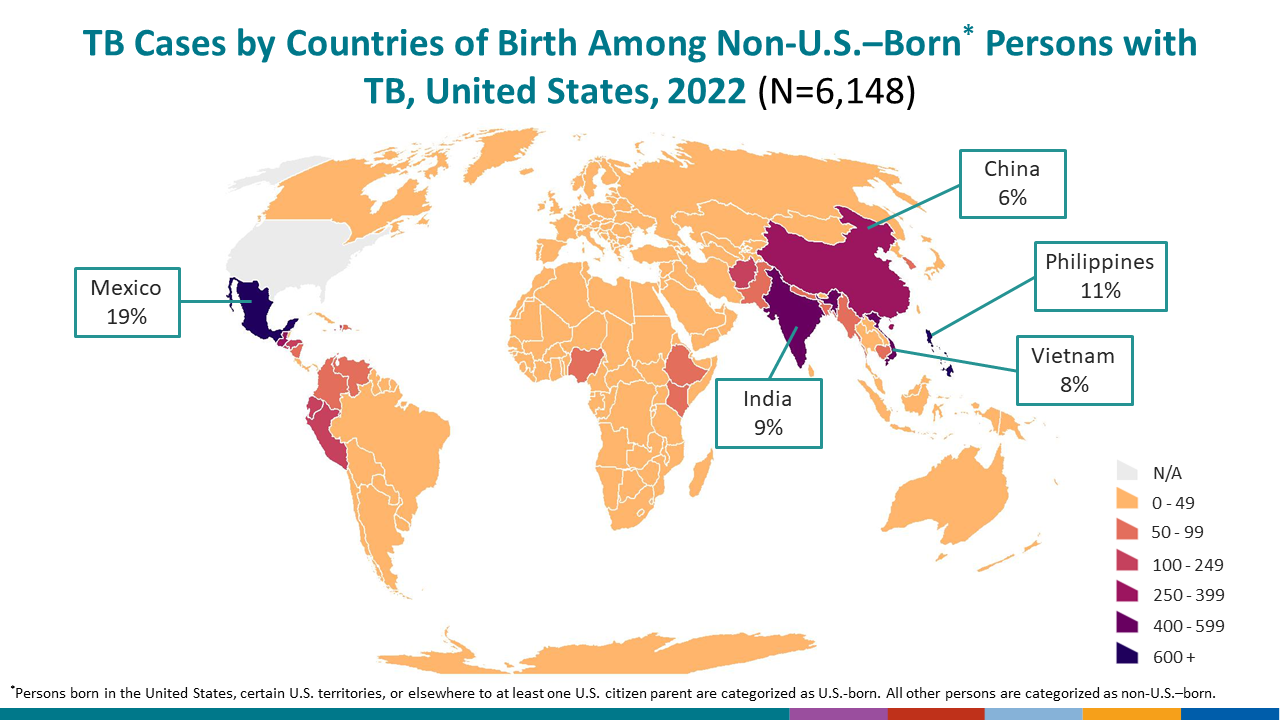
See surveillance slide #13.
| Country of birth3 | Year | |||||||||
|---|---|---|---|---|---|---|---|---|---|---|
| 2022 | 2021 | 2020 | 2019 | 2018 | ||||||
| No. | (%) | No. | (%) | No. | (%) | No. | (%) | No. | (%) | |
| Total cases | 6,148 | 5,629 | 5,141 | 6,367 | 6,352 | |||||
| Mexico | 1,161 | (18.9) | 1,054 | (18.7) | 927 | (18.0) | 1,190 | (18.7) | 1,208 | (19.0) |
| Philippines | 670 | (10.9) | 692 | (12.3) | 641 | (12.5) | 795 | (12.5) | 780 | (12.3) |
| India | 541 | (8.8) | 566 | (10.1) | 531 | (10.3) | 577 | (9.1) | 632 | (9.9) |
| Vietnam | 504 | (8.2) | 424 | (7.5) | 421 | (8.2) | 506 | (7.9) | 512 | (8.1) |
| China | 371 | (6.0) | 314 | (5.6) | 260 | (5.1) | 390 | (6.1) | 381 | (6.0) |
| Guatemala | 283 | (4.6) | 218 | (3.9) | 170 | (3.3) | 232 | (3.6) | 209 | (3.3) |
| Honduras | 184 | (3.0) | 134 | (2.4) | 129 | (2.5) | 192 | (3.0) | 142 | (2.2) |
| Haiti | 162 | (2.6) | 149 | (2.6) | 128 | (2.5) | 163 | (2.6) | 130 | (2.0) |
| Ethiopia | 77 | (1.3) | 124 | (2.2) | 105 | (2.0) | 138 | (2.2) | 150 | (2.4) |
| El Salvador | 103 | (1.7) | 73 | (1.3) | 100 | (1.9) | 98 | (1.5) | 109 | (1.7) |
| Myanmar | 83 | (1.4) | 104 | (1.8) | 81 | (1.6) | 105 | (1.6) | 109 | (1.7) |
| Nepal | 97 | (1.6) | 87 | (1.5) | 83 | (1.6) | 97 | (1.5) | 100 | (1.6) |
| Pakistan | 82 | (1.3) | 79 | (1.4) | 74 | (1.4) | 110 | (1.7) | 104 | (1.6) |
| Peru | 125 | (2.0) | 63 | (1.1) | 63 | (1.2) | 79 | (1.2) | 78 | (1.2) |
| Korea Republic Of | 70 | (1.1) | 85 | (1.5) | 70 | (1.4) | 96 | (1.5) | 83 | (1.3) |
| Ecuador | 105 | (1.7) | 87 | (1.5) | 60 | (1.2) | 58 | (0.9) | 77 | (1.2) |
| Cambodia | 67 | (1.1) | 62 | (1.1) | 57 | (1.1) | 94 | (1.5) | 67 | (1.1) |
| Bangladesh | 59 | (1.0) | 74 | (1.3) | 67 | (1.3) | 64 | (1.0) | 61 | (1.0) |
| Afghanistan | 123 | (2.0) | 80 | (1.4) | 32 | (0.6) | 42 | (0.7) | 39 | (0.6) |
| Dominican Republic | 65 | (1.1) | 55 | (1.0) | 56 | (1.1) | 59 | (0.9) | 56 | (0.9) |
| Nigeria | 52 | (0.8) | 50 | (0.9) | 47 | (0.9) | 67 | (1.1) | 72 | (1.1) |
| Somalia | 39 | (0.6) | 43 | (0.8) | 67 | (1.3) | 65 | (1.0) | 73 | (1.1) |
| Laos | 47 | (0.8) | 61 | (1.1) | 43 | (0.8) | 53 | (0.8) | 56 | (0.9) |
| Marshall Islands | 67 | (1.1) | 51 | (0.9) | 44 | (0.9) | 45 | (0.7) | 41 | (0.6) |
| Colombia | 71 | (1.2) | 45 | (0.8) | 31 | (0.6) | 50 | (0.8) | 48 | (0.8) |
| Kenya | 50 | (0.8) | 38 | (0.7) | 36 | (0.7) | 57 | (0.9) | 54 | (0.9) |
| Bhutan | 25 | (0.4) | 37 | (0.7) | 21 | (0.4) | 32 | (0.5) | 45 | (0.7) |
| Congo | 21 | (0.3) | 24 | (0.4) | 28 | (0.5) | 38 | (0.6) | 47 | (0.7) |
| Thailand | 33 | (0.5) | 25 | (0.4) | 36 | (0.7) | 31 | (0.5) | 32 | (0.5) |
| Cuba | 38 | (0.6) | 34 | (0.6) | 22 | (0.4) | 27 | (0.4) | 27 | (0.4) |
| Other4 | 773 | (12.6) | 697 | (12.4) | 711 | (13.8) | 817 | (12.8) | 830 | (13.1) |
1Persons born in the United States, certain U.S. territories, or elsewhere to at least one U.S. citizen parent are categorized as U.S.-born. All other persons are categorized as non-U.S.–born.
2The top 30 countries were selected based on their ranked 5-year average number of TB cases.
3Countries are in descending order by total case count for all years combined.
4Includes persons for whom country of birth is “missing” or “not specified.”
Note:
Data for all years are updated through July 8, 2023.
