Reported Tuberculosis in the United States, 2022
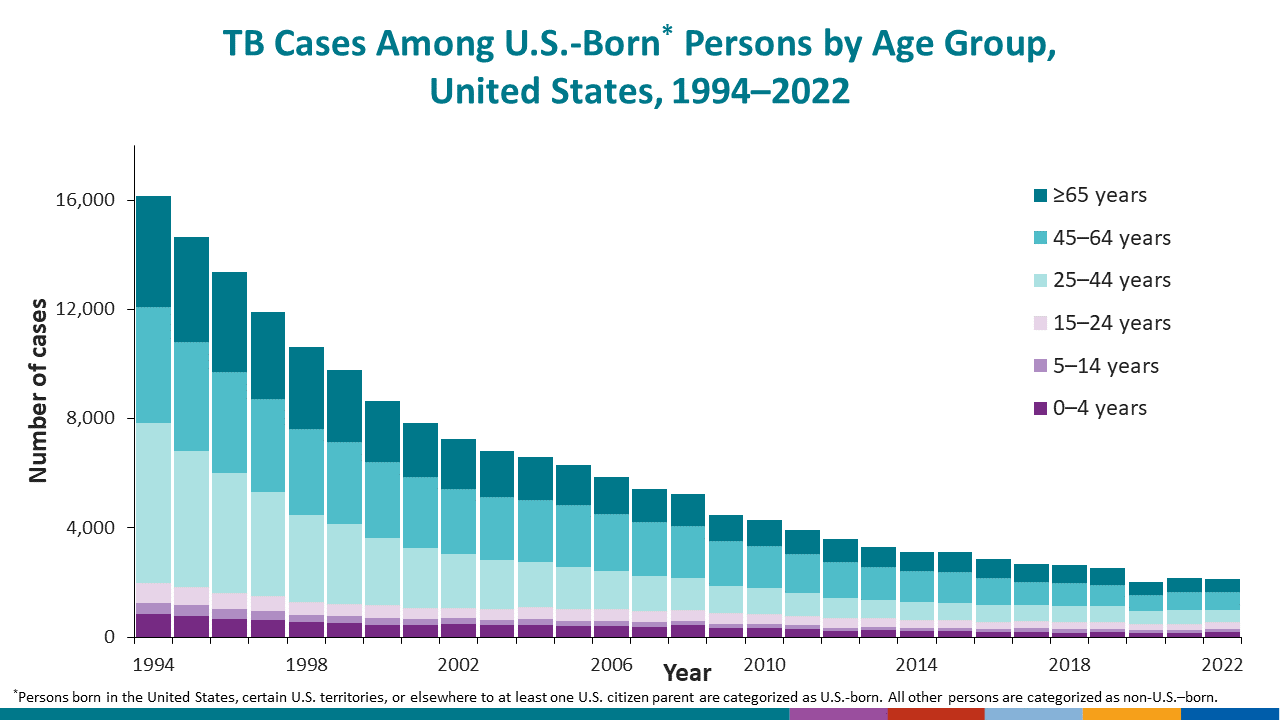
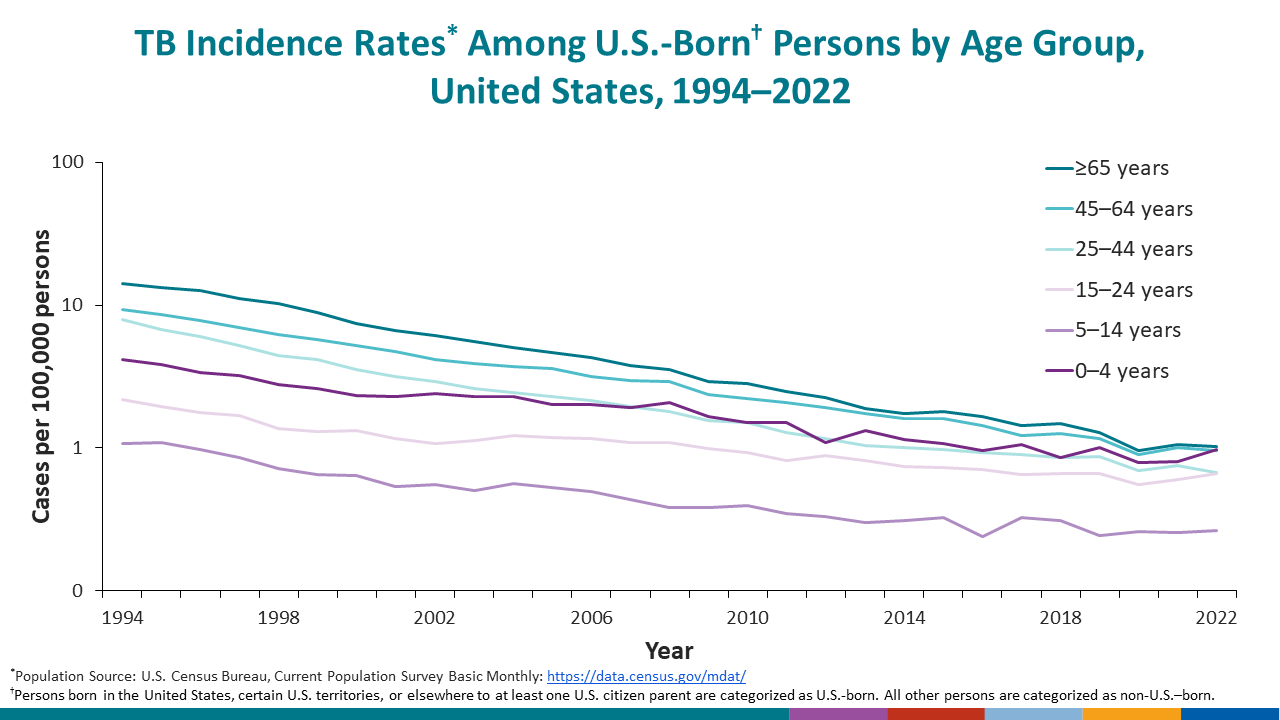
Table 6. Tuberculosis Cases, Percentages, and Incidence Rates per 100,000 Population Among U.S.-Born Persons1 by Age Group: United States, 1993–2022
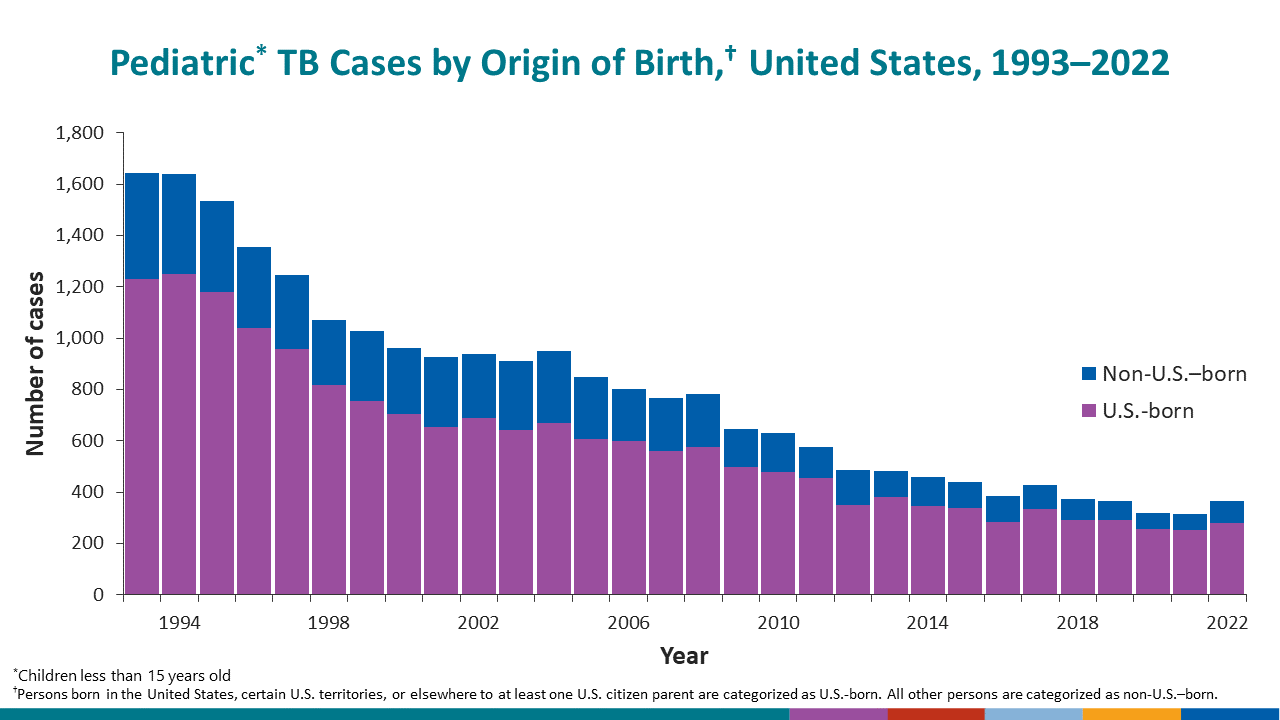
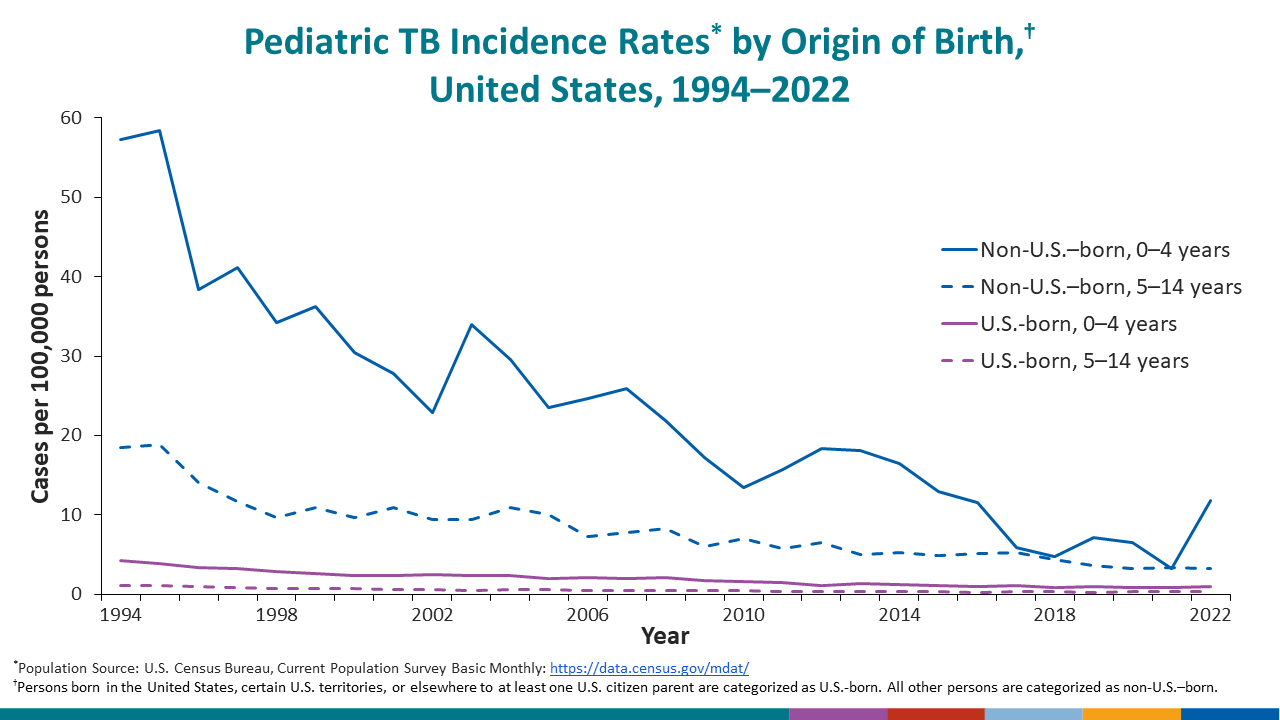
See surveillance slides #29, #30, #34, and #35.
| Year | Total cases | 0─4 | 5─14 | 15─24 | 25─44 | 45─64 | ≥65 | Unknown or missing | |||||||||||||
|---|---|---|---|---|---|---|---|---|---|---|---|---|---|---|---|---|---|---|---|---|---|
| No. | (%) | Rate | No. | (%) | Rate | No. | (%) | Rate | No. | (%) | Rate | No. | (%) | Rate | No. | (%) | Rate | No. | (%) | ||
| 2022 | 2,142 | 177 | (8.3) | 1.0 | 105 | (4.9) | 0.3 | 257 | (12.0) | 0.7 | 470 | (21.9) | 0.7 | 629 | (29.4) | 1.0 | 504 | (23.5) | 1.0 | 0 | (0.0) |
| 2021 | 2,177 | 152 | (7.0) | 0.8 | 100 | (4.6) | 0.3 | 229 | (10.5) | 0.6 | 530 | (24.3) | 0.8 | 654 | (30.0) | 1.0 | 512 | (23.5) | 1.1 | 0 | (0.0) |
| 2020 | 2,009 | 152 | (7.6) | 0.8 | 103 | (5.1) | 0.3 | 213 | (10.6) | 0.6 | 485 | (24.1) | 0.7 | 602 | (30.0) | 0.9 | 454 | (22.6) | 1.0 | 0 | (0.0) |
| 2019 | 2,516 | 197 | (7.8) | 1.0 | 96 | (3.8) | 0.2 | 255 | (10.1) | 0.7 | 599 | (23.8) | 0.9 | 777 | (30.9) | 1.2 | 592 | (23.5) | 1.3 | 0 | (0.0) |
| 2018 | 2,642 | 167 | (6.3) | 0.9 | 123 | (4.7) | 0.3 | 256 | (9.7) | 0.7 | 581 | (22.0) | 0.9 | 858 | (32.5) | 1.3 | 657 | (24.9) | 1.5 | 0 | (0.0) |
| 2017 | 2,661 | 206 | (7.7) | 1.1 | 128 | (4.8) | 0.3 | 252 | (9.5) | 0.7 | 604 | (22.7) | 0.9 | 846 | (31.8) | 1.2 | 625 | (23.5) | 1.4 | 0 | (0.0) |
| 2016 | 2,881 | 190 | (6.6) | 1.0 | 95 | (3.3) | 0.2 | 276 | (9.6) | 0.7 | 620 | (21.5) | 0.9 | 1,002 | (34.8) | 1.4 | 697 | (24.2) | 1.7 | 1 | (0.0) |
| 2015 | 3,126 | 210 | (6.7) | 1.1 | 130 | (4.2) | 0.3 | 287 | (9.2) | 0.7 | 639 | (20.4) | 1.0 | 1,125 | (36.0) | 1.6 | 735 | (23.5) | 1.8 | 0 | (0.0) |
| 2014 | 3,109 | 224 | (7.2) | 1.1 | 123 | (4.0) | 0.3 | 290 | (9.3) | 0.7 | 657 | (21.1) | 1.0 | 1,124 | (36.2) | 1.6 | 691 | (22.2) | 1.8 | 0 | (0.0) |
| 2013 | 3,303 | 262 | (7.9) | 1.3 | 120 | (3.6) | 0.3 | 318 | (9.6) | 0.8 | 675 | (20.4) | 1.0 | 1,208 | (36.6) | 1.7 | 720 | (21.8) | 1.9 | 0 | (0.0) |
| 2012 | 3,606 | 218 | (6.0) | 1.1 | 132 | (3.7) | 0.3 | 345 | (9.6) | 0.9 | 744 | (20.6) | 1.2 | 1,329 | (36.9) | 1.9 | 838 | (23.2) | 2.3 | 0 | (0.0) |
| 2011 | 3,914 | 317 | (8.1) | 1.5 | 138 | (3.5) | 0.3 | 311 | (7.9) | 0.8 | 833 | (21.3) | 1.3 | 1,453 | (37.1) | 2.1 | 862 | (22.0) | 2.5 | 0 | (0.0) |
| 2010 | 4,303 | 321 | (7.5) | 1.5 | 156 | (3.6) | 0.4 | 357 | (8.3) | 0.9 | 976 | (22.7) | 1.5 | 1,529 | (35.5) | 2.2 | 964 | (22.4) | 2.8 | 0 | (0.0) |
| 2009 | 4,484 | 351 | (7.8) | 1.7 | 149 | (3.3) | 0.4 | 375 | (8.4) | 1.0 | 1,014 | (22.6) | 1.6 | 1,614 | (36.0) | 2.4 | 981 | (21.9) | 2.9 | 0 | (0.0) |
| 2008 | 5,245 | 428 | (8.2) | 2.1 | 148 | (2.8) | 0.4 | 407 | (7.8) | 1.1 | 1,168 | (22.3) | 1.8 | 1,933 | (36.9) | 2.9 | 1,161 | (22.1) | 3.5 | 0 | (0.0) |
| 2007 | 5,427 | 390 | (7.2) | 1.9 | 169 | (3.1) | 0.4 | 407 | (7.5) | 1.1 | 1,270 | (23.4) | 1.9 | 1,975 | (36.4) | 3.0 | 1,215 | (22.4) | 3.8 | 1 | (0.0) |
| 2006 | 5,852 | 409 | (7.0) | 2.0 | 191 | (3.3) | 0.5 | 423 | (7.2) | 1.2 | 1,414 | (24.2) | 2.1 | 2,058 | (35.2) | 3.2 | 1,357 | (23.2) | 4.3 | 0 | (0.0) |
| 2005 | 6,286 | 401 | (6.4) | 2.0 | 205 | (3.3) | 0.5 | 434 | (6.9) | 1.2 | 1,530 | (24.3) | 2.3 | 2,259 | (35.9) | 3.6 | 1,457 | (23.2) | 4.6 | 0 | (0.0) |
| 2004 | 6,592 | 448 | (6.8) | 2.3 | 220 | (3.3) | 0.6 | 440 | (6.7) | 1.2 | 1,639 | (24.9) | 2.4 | 2,283 | (34.6) | 3.7 | 1,562 | (23.7) | 5.0 | 0 | (0.0) |
| 2003 | 6,833 | 445 | (6.5) | 2.3 | 196 | (2.9) | 0.5 | 403 | (5.9) | 1.1 | 1,764 | (25.8) | 2.6 | 2,326 | (34.0) | 3.9 | 1,699 | (24.9) | 5.5 | 0 | (0.0) |
| 2002 | 7,259 | 470 | (6.5) | 2.4 | 218 | (3.0) | 0.6 | 380 | (5.2) | 1.1 | 1,987 | (27.4) | 2.9 | 2,380 | (32.8) | 4.2 | 1,824 | (25.1) | 6.2 | 0 | (0.0) |
| 2001 | 7,840 | 442 | (5.6) | 2.3 | 211 | (2.7) | 0.5 | 411 | (5.2) | 1.2 | 2,191 | (27.9) | 3.2 | 2,617 | (33.4) | 4.8 | 1,968 | (25.1) | 6.6 | 0 | (0.0) |
| 2000 | 8,630 | 453 | (5.2) | 2.3 | 251 | (2.9) | 0.6 | 460 | (5.3) | 1.3 | 2,478 | (28.7) | 3.6 | 2,782 | (32.2) | 5.2 | 2,206 | (25.6) | 7.5 | 0 | (0.0) |
| 1999 | 9,777 | 503 | (5.1) | 2.6 | 254 | (2.6) | 0.7 | 447 | (4.6) | 1.3 | 2,940 | (30.1) | 4.2 | 3,014 | (30.8) | 5.8 | 2,617 | (26.8) | 8.9 | 2 | (0.0) |
| 1998 | 10,606 | 541 | (5.1) | 2.8 | 276 | (2.6) | 0.7 | 466 | (4.4) | 1.4 | 3,177 | (30.0) | 4.4 | 3,149 | (29.7) | 6.3 | 2,997 | (28.3) | 10.3 | 0 | (0.0) |
| 1997 | 11,920 | 628 | (5.3) | 3.2 | 331 | (2.8) | 0.9 | 563 | (4.7) | 1.7 | 3,783 | (31.7) | 5.2 | 3,410 | (28.6) | 7.0 | 3,205 | (26.9) | 11.1 | 0 | (0.0) |
| 1996 | 13,375 | 666 | (5.0) | 3.4 | 373 | (2.8) | 1.0 | 581 | (4.3) | 1.8 | 4,390 | (32.8) | 6.0 | 3,714 | (27.8) | 7.8 | 3,648 | (27.3) | 12.7 | 3 | (0.0) |
| 1995 | 14,652 | 767 | (5.2) | 3.8 | 413 | (2.8) | 1.1 | 656 | (4.5) | 2.0 | 4,986 | (34.0) | 6.7 | 3,977 | (27.1) | 8.6 | 3,849 | (26.3) | 13.3 | 4 | (0.0) |
| 1994 | 16,170 | 847 | (5.2) | 4.2 | 401 | (2.5) | 1.1 | 720 | (4.5) | 2.2 | 5,859 | (36.2) | 8.0 | 4,261 | (26.4) | 9.4 | 4,077 | (25.2) | 14.2 | 5 | (0.0) |
| 1993 | 17,423 | 834 | (4.8) | – – | 397 | (2.3) | – – | 790 | (4.5) | – – | 6,475 | (37.2) | – – | 4,526 | (26.0) | – – | 4,386 | (25.2) | – – | 15 | (0.1) |
1Persons born in the United States, certain U.S. territories, or elsewhere to at least one U.S. citizen parent are categorized as U.S.-born. All other persons are categorized as non-U.S.–born.
Note:
Incidence rates were created using Current Population Survey (CPS) Basic Monthly data set. The CPS does not include institutionalized persons. Accessed July 6, 2023.
Data for all years are updated through July 8, 2023.
Double dashes (– –) indicate that data are not available.
Zero % (0.0) denotes <0.05%.
See Technical Notes.
