Reported Tuberculosis in the United States, 2022
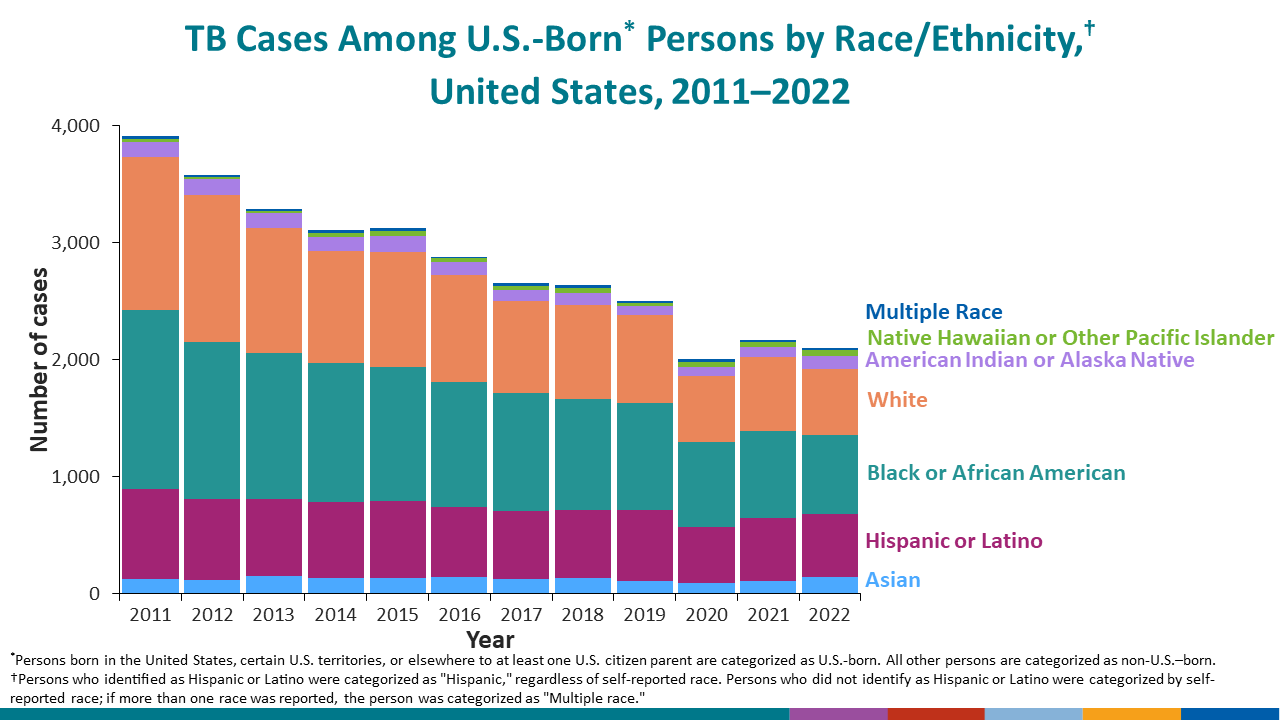
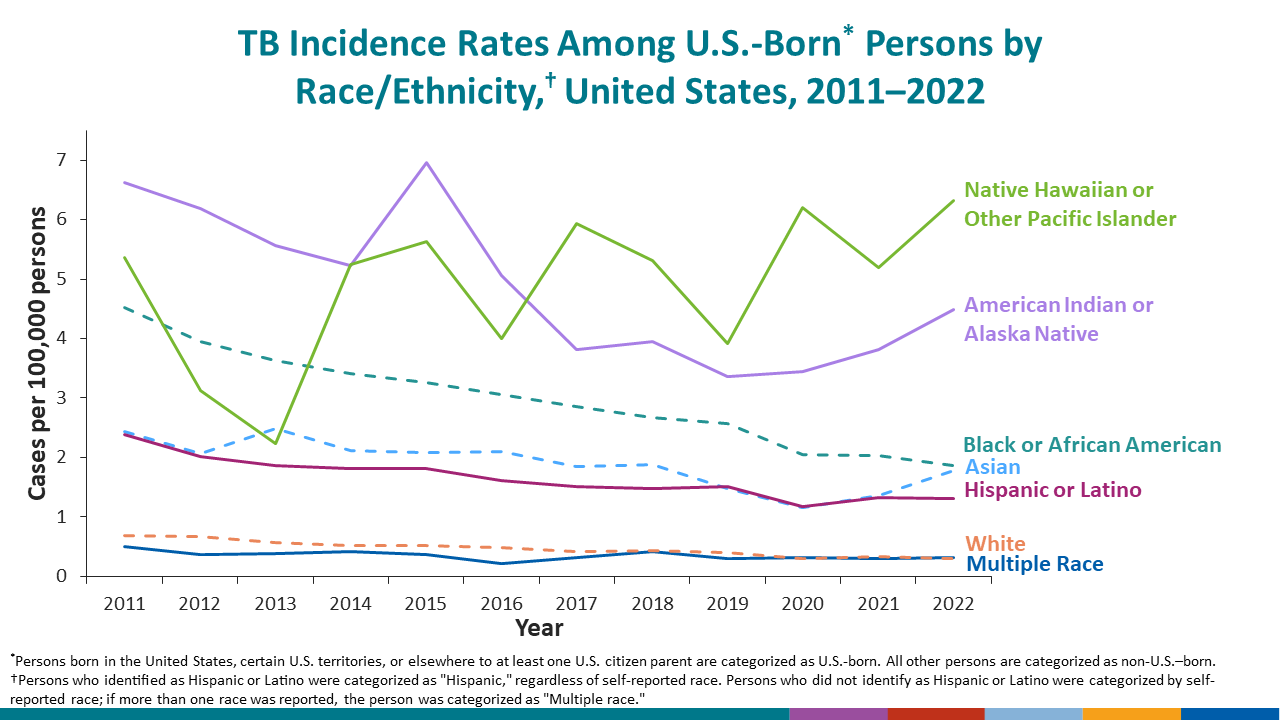
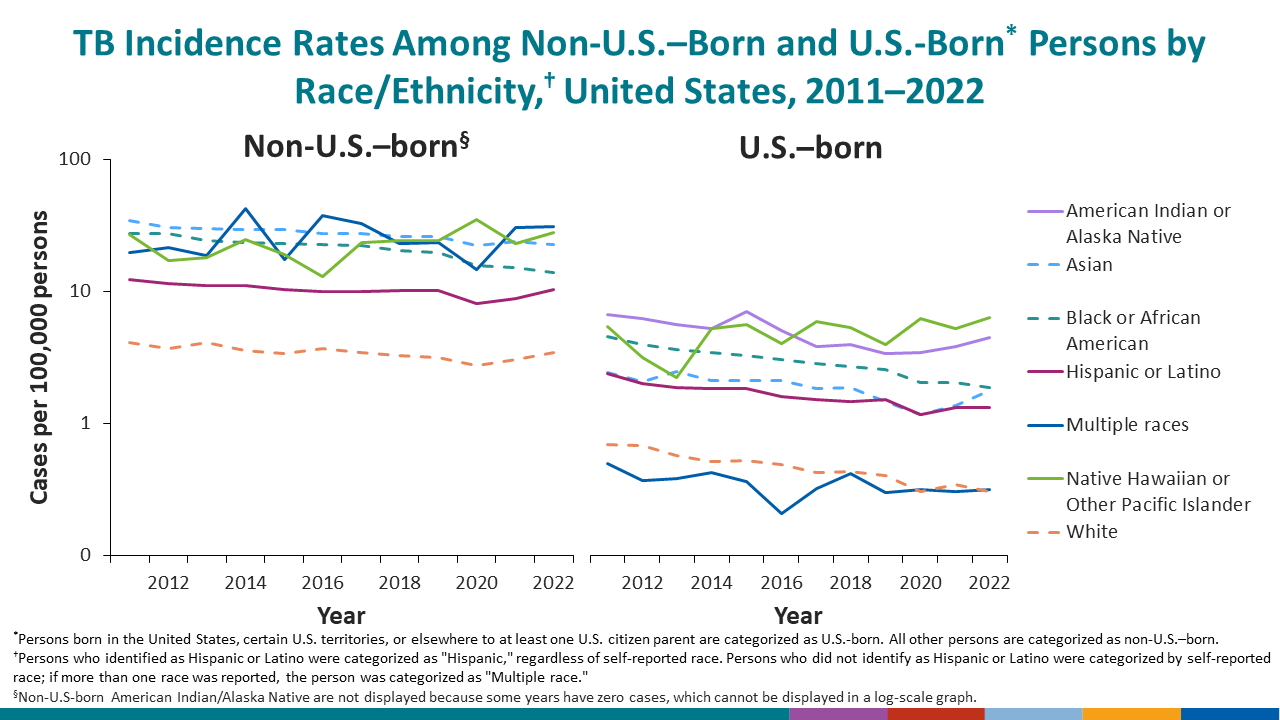
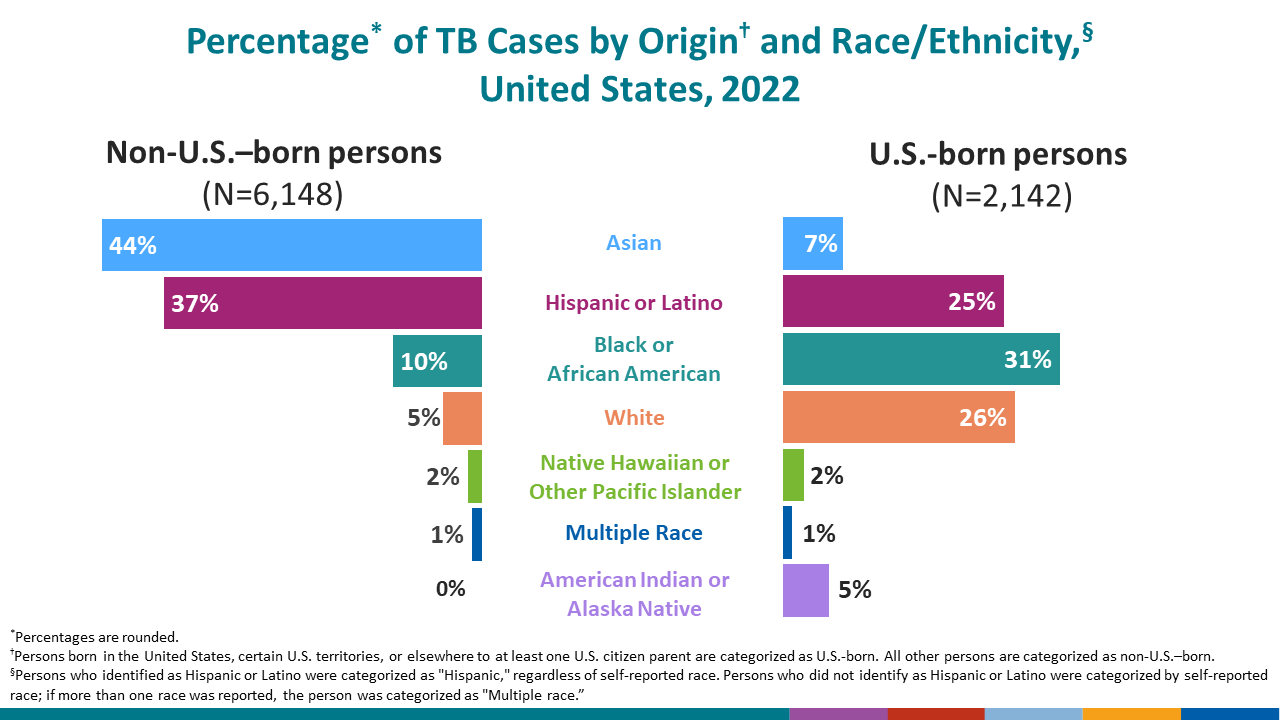
Table 3. Tuberculosis Cases, Percentages, and Incidence Rates per 100,000 Population Among U.S.-Born Persons1 by Hispanic Ethnicity and Non-Hispanic Race:2 United States, 1993–2022
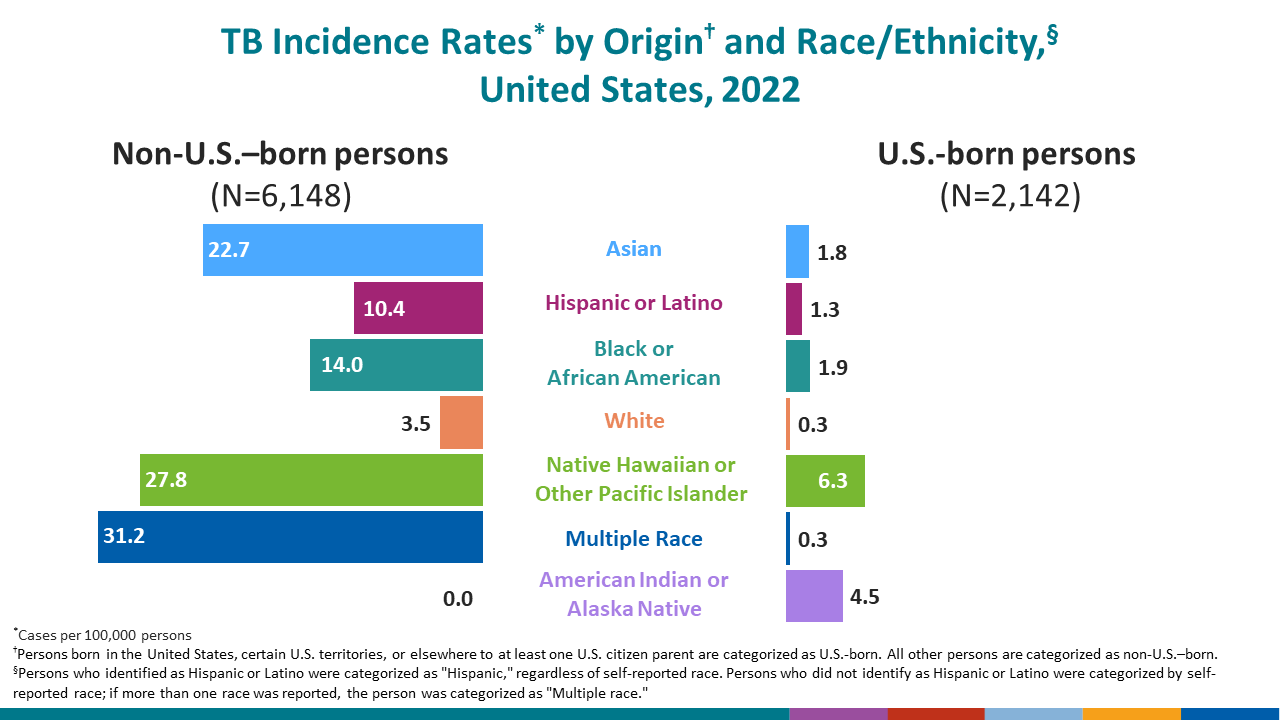
See surveillance slides #19, #20, #23, #24, and #25.
| Year | Total cases | Non-Hispanic | Hispanic or Latino | Unknown or missing | ||||||||||||||||||||
|---|---|---|---|---|---|---|---|---|---|---|---|---|---|---|---|---|---|---|---|---|---|---|---|---|
| American Indian or Alaska Native | Asian3 | Black or African American | Native Hawaiian or Other Pacific Islander4 | White | Multiple race | |||||||||||||||||||
| No. | (%) | Rate | No. | (%) | Rate | No. | (%) | Rate | No. | (%) | Rate | No. | (%) | Rate | No. | (%) | Rate | No. | (%) | Rate | No. | (%) | ||
| 2022 | 2,142 | 112 | (5.2) | 4.5 | 145 | (6.8) | 1.8 | 673 | (31.4) | 1.9 | 50 | (2.3) | 6.3 | 564 | (26.3) | 0.3 | 22 | (1.0) | 0.3 | 536 | (25.0) | 1.3 | 40 | (1.9) |
| 2021 | 2,177 | 86 | (4.0) | 3.8 | 111 | (5.1) | 1.4 | 741 | (34.0) | 2.0 | 40 | (1.8) | 5.2 | 631 | (29.0) | 0.3 | 21 | (1.0) | 0.3 | 540 | (24.8) | 1.3 | 7 | (0.3) |
| 2020 | 2,009 | 76 | (3.8) | 3.4 | 95 | (4.7) | 1.2 | 732 | (36.4) | 2.0 | 42 | (2.1) | 6.2 | 564 | (28.1) | 0.3 | 22 | (1.1) | 0.3 | 475 | (23.6) | 1.2 | 3 | (0.1) |
| 2019 | 2,516 | 79 | (3.1) | 3.4 | 113 | (4.5) | 1.5 | 911 | (36.2) | 2.6 | 26 | (1.0) | 3.9 | 750 | (29.8) | 0.4 | 20 | (0.8) | 0.3 | 608 | (24.2) | 1.5 | 9 | (0.4) |
| 2018 | 2,642 | 101 | (3.8) | 3.9 | 135 | (5.1) | 1.9 | 949 | (35.9) | 2.7 | 40 | (1.5) | 5.3 | 805 | (30.5) | 0.4 | 26 | (1.0) | 0.4 | 583 | (22.1) | 1.5 | 3 | (0.1) |
| 2017 | 2,661 | 91 | (3.4) | 3.8 | 128 | (4.8) | 1.8 | 1,005 | (37.8) | 2.9 | 41 | (1.5) | 5.9 | 790 | (29.7) | 0.4 | 20 | (0.8) | 0.3 | 580 | (21.8) | 1.5 | 6 | (0.2) |
| 2016 | 2,881 | 110 | (3.8) | 5.1 | 145 | (5.0) | 2.1 | 1,071 | (37.2) | 3.1 | 29 | (1.0) | 4.0 | 912 | (31.7) | 0.5 | 13 | (0.5) | 0.2 | 599 | (20.8) | 1.6 | 2 | (0.1) |
| 2015 | 3,126 | 144 | (4.6) | 7.0 | 138 | (4.4) | 2.1 | 1,142 | (36.5) | 3.3 | 39 | (1.2) | 5.6 | 978 | (31.3) | 0.5 | 22 | (0.7) | 0.4 | 660 | (21.1) | 1.8 | 3 | (0.1) |
| 2014 | 3,109 | 118 | (3.8) | 5.2 | 138 | (4.4) | 2.1 | 1,183 | (38.1) | 3.4 | 35 | (1.1) | 5.2 | 958 | (30.8) | 0.5 | 25 | (0.8) | 0.4 | 650 | (20.9) | 1.8 | 2 | (0.1) |
| 2013 | 3,303 | 122 | (3.7) | 5.6 | 154 | (4.7) | 2.5 | 1,246 | (37.7) | 3.6 | 16 | (0.5) | 2.2 | 1,073 | (32.5) | 0.6 | 22 | (0.7) | 0.4 | 657 | (19.9) | 1.9 | 13 | (0.4) |
| 2012 | 3,606 | 133 | (3.7) | 6.2 | 122 | (3.4) | 2.1 | 1,342 | (37.2) | 4.0 | 19 | (0.5) | 3.1 | 1,254 | (34.8) | 0.7 | 21 | (0.6) | 0.4 | 692 | (19.2) | 2.0 | 23 | (0.6) |
| 2011 | 3,914 | 130 | (3.3) | 6.6 | 131 | (3.3) | 2.4 | 1,532 | (39.1) | 4.5 | 24 | (0.6) | 5.4 | 1,306 | (33.4) | 0.7 | 24 | (0.6) | 0.5 | 763 | (19.5) | 2.4 | 4 | (0.1) |
| 2010 | 4,303 | 152 | (3.5) | 7.8 | 128 | (3.0) | 2.4 | 1,764 | (41.0) | 5.2 | 31 | (0.7) | 6.3 | 1,409 | (32.7) | 0.7 | 15 | (0.3) | 0.3 | 804 | (18.7) | 2.6 | 0 | (0.0) |
| 2009 | 4,484 | 98 | (2.2) | 5.6 | 146 | (3.3) | 2.9 | 1,919 | (42.8) | 5.7 | 20 | (0.4) | 4.0 | 1,432 | (31.9) | 0.8 | 15 | (0.3) | 0.3 | 846 | (18.9) | 2.9 | 8 | (0.2) |
| 2008 | 5,245 | 133 | (2.5) | 7.4 | 149 | (2.8) | 3.0 | 2,238 | (42.7) | 6.7 | 13 | (0.2) | 3.0 | 1,763 | (33.6) | 0.9 | 16 | (0.3) | 0.4 | 921 | (17.6) | 3.3 | 12 | (0.2) |
| 2007 | 5,427 | 128 | (2.4) | 7.5 | 130 | (2.4) | 2.7 | 2,461 | (45.3) | 7.3 | 18 | (0.3) | 4.3 | 1,789 | (33.0) | 1.0 | 9 | (0.2) | 0.2 | 878 | (16.2) | 3.3 | 14 | (0.3) |
| 2006 | 5,852 | 162 | (2.8) | 10.2 | 130 | (2.2) | 2.8 | 2,594 | (44.3) | 7.9 | 13 | (0.2) | 3.7 | 1,957 | (33.4) | 1.0 | 10 | (0.2) | 0.2 | 983 | (16.8) | 3.8 | 3 | (0.1) |
| 2005 | 6,286 | 148 | (2.4) | 8.7 | 120 | (1.9) | 2.7 | 2,874 | (45.7) | 8.8 | 21 | (0.3) | 6.5 | 2,131 | (33.9) | 1.1 | 24 | (0.4) | 0.6 | 955 | (15.2) | 3.7 | 13 | (0.2) |
| 2004 | 6,592 | 154 | (2.3) | 9.1 | 145 | (2.2) | 3.4 | 2,970 | (45.1) | 9.2 | 20 | (0.3) | 7.3 | 2,211 | (33.5) | 1.2 | 14 | (0.2) | 0.3 | 1,064 | (16.1) | 4.2 | 14 | (0.2) |
| 2003 | 6,833 | 176 | (2.6) | 11.6 | 152 | (2.2) | 3.7 | 3,087 | (45.2) | 9.6 | 22 | (0.3) | 6.0 | 2,370 | (34.7) | 1.3 | 9 | (0.1) | 0.2 | 999 | (14.6) | 4.1 | 18 | (0.3) |
| 2002 | 7,259 | 184 | (2.5) | 8.3 | 119 | (1.6) | 2.6 | 3,401 | (46.9) | 10.4 | – – | – – | – – | 2,548 | (35.1) | 1.4 | – – | – – | – – | 979 | (13.5) | 4.5 | 28 | (0.4) |
| 2001 | 7,840 | 214 | (2.7) | 9.6 | 115 | (1.5) | 2.6 | 3,665 | (46.7) | 11.2 | – – | – – | – – | 2,786 | (35.5) | 1.5 | – – | – – | – – | 1,026 | (13.1) | 4.8 | 34 | (0.4) |
| 2000 | 8,630 | 227 | (2.6) | 10.7 | 133 | (1.5) | 3.2 | 4,106 | (47.6) | 12.7 | – – | – – | – – | 3,103 | (36.0) | 1.7 | – – | – – | – – | 1,016 | (11.8) | 5.0 | 45 | (0.5) |
| 1999 | 9,777 | 237 | (2.4) | 11.2 | 132 | (1.4) | 3.1 | 4,607 | (47.1) | 14.3 | – – | – – | – – | 3,639 | (37.2) | 2.0 | – – | – – | – – | 1,119 | (11.4) | 5.6 | 43 | (0.4) |
| 1998 | 10,606 | 250 | (2.4) | 12.7 | 134 | (1.3) | 3.3 | 4,972 | (46.9) | 15.6 | – – | – – | – – | 3,915 | (36.9) | 2.1 | – – | – – | – – | 1,280 | (12.1) | 6.6 | 55 | (0.5) |
| 1997 | 11,920 | 259 | (2.2) | 12.6 | 150 | (1.3) | 3.9 | 5,719 | (48.0) | 18.0 | – – | – – | – – | 4,255 | (35.7) | 2.3 | – – | – – | – – | 1,464 | (12.3) | 7.8 | 73 | (0.6) |
| 1996 | 13,375 | 281 | (2.1) | 14.5 | 147 | (1.1) | 3.9 | 6,301 | (47.1) | 19.9 | – – | – – | – – | 4,967 | (37.1) | 2.7 | – – | – – | – – | 1,603 | (12.0) | 8.8 | 76 | (0.6) |
| 1995 | 14,652 | 313 | (2.1) | 28.7 | 138 | (0.9) | 7.1 | 6,750 | (46.1) | 21.3 | – – | – – | – – | 5,427 | (37.0) | 2.9 | – – | – – | – – | 1,905 | (13.0) | 10.7 | 119 | (0.8) |
| 1994 | 16,170 | 322 | (2.0) | 22.1 | 151 | (0.9) | 6.2 | 7,576 | (46.9) | 24.4 | – – | – – | – – | 6,010 | (37.2) | 3.2 | – – | – – | – – | 1,989 | (12.3) | 11.8 | 122 | (0.8) |
| 1993 | 17,423 | 263 | (1.5) | – – | 118 | (0.7) | – – | 8,250 | (47.4) | – – | – – | – – | – – | 6,318 | (36.3) | – – | – – | – – | – – | 2,235 | (12.8) | – – | 239 | (1.4) |
1Persons born in the United States, certain U.S. territories, or elsewhere to at least one U.S. citizen parent are categorized as U.S.-born. All other persons are categorized as non-U.S.–born.
2Persons who identified as Hispanic or Latino were categorized as “Hispanic or Latino,” regardless of self-reported race. Persons who did not identify as Hispanic or Latino were categorized by self-reported race; if more than one race was reported, the person was categorized as “Multiple race.”
3Includes Pacific Islander persons from 1993–2002.
4Native Hawaiian or Other Pacific Islander race first reported separately in 2003.
Note:
Incidence rates were created using the Current Population Survey (CPS) Basic Monthly data set. The CPS does not include institutionalized persons. Accessed July 10, 2023.
Data for all years are updated through July 8, 2023.
Double dashes (– –) indicate that data not available.
See Technical Notes.