Reported Tuberculosis in the United States, 2022
Table 18. Deaths Reported Among Persons with Tuberculosis Disease: United States, 2010–2020
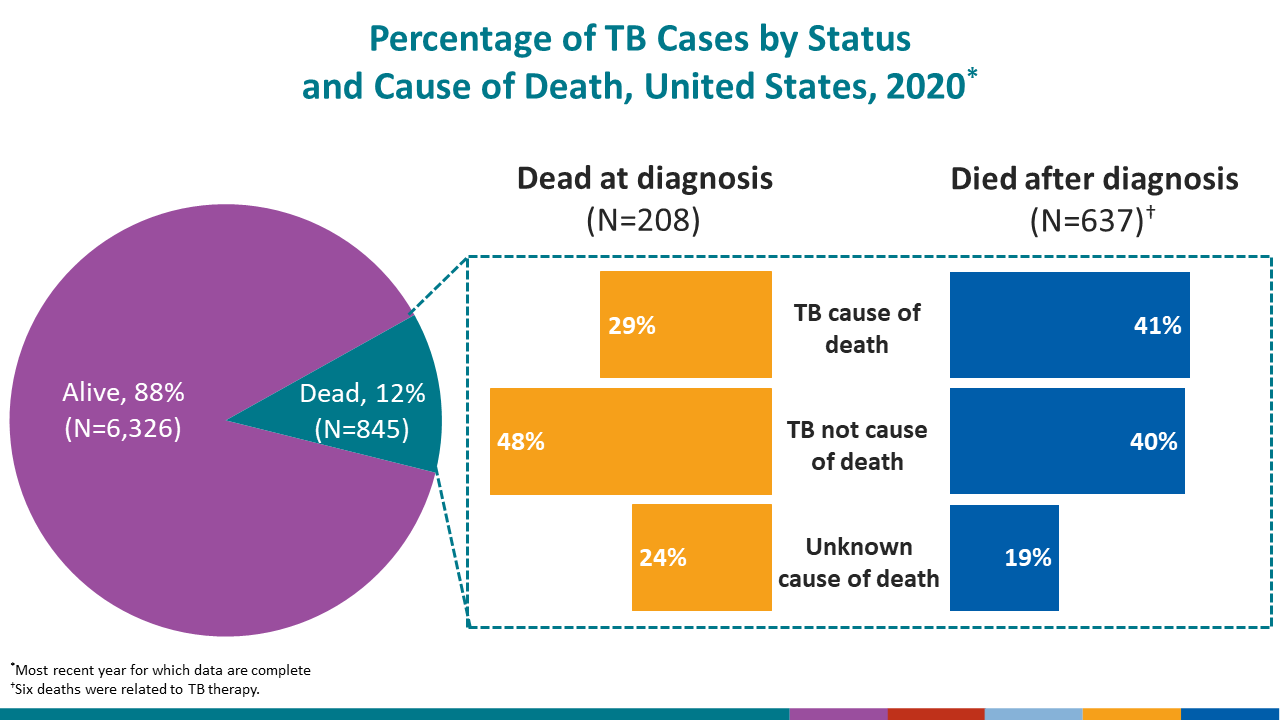
See surveillance slide #47.
| Year3 | Total | Dead at diagnosis | Died after diagnosis | ||||||||||||||
|---|---|---|---|---|---|---|---|---|---|---|---|---|---|---|---|---|---|
| Total deaths reported | Deaths related to TB disease or therapy1 | Total deaths | TB a cause of death | TB not a cause of death | Cause of death unknown or missing | Total deaths | Related to TB therapy or disease2 | Unrelated to TB therapy or disease | Cause of death unknown or missing | ||||||||
| No. | No. | (%) | No. | No. | (%) | No. | (%) | No. | (%) | No. | No. | (%) | No. | (%) | No. | (%) | |
| 2020 | 845 | 325 | (38.5) | 208 | 60 | (28.8) | 99 | (47.6) | 49 | (23.6) | 637 | 265 | (41.6) | 254 | (39.9) | 118 | (18.5) |
| 2019 | 892 | 313 | (35.1) | 222 | 64 | (28.8) | 108 | (48.6) | 50 | (22.5) | 670 | 249 | (37.2) | 283 | (42.2) | 138 | (20.6) |
| 2018 | 802 | 286 | (35.7) | 196 | 65 | (33.2) | 85 | (43.4) | 46 | (23.5) | 606 | 221 | (36.5) | 271 | (44.7) | 114 | (18.8) |
| 2017 | 789 | 256 | (32.4) | 164 | 50 | (30.5) | 81 | (49.4) | 33 | (20.1) | 625 | 206 | (33.0) | 284 | (45.4) | 135 | (21.6) |
| 2016 | 832 | 316 | (38.0) | 206 | 71 | (34.5) | 96 | (46.6) | 39 | (18.9) | 626 | 245 | (39.1) | 254 | (40.6) | 127 | (20.3) |
| 2015 | 794 | 274 | (34.5) | 207 | 63 | (30.4) | 102 | (49.3) | 42 | (20.3) | 587 | 211 | (35.9) | 261 | (44.5) | 115 | (19.6) |
| 2014 | 769 | 282 | (36.7) | 194 | 61 | (31.4) | 100 | (51.5) | 33 | (17.0) | 575 | 221 | (38.4) | 239 | (41.6) | 115 | (20.0) |
| 2013 | 807 | 275 | (34.1) | 211 | 64 | (30.3) | 109 | (51.7) | 38 | (18.0) | 596 | 211 | (35.4) | 278 | (46.6) | 107 | (18.0) |
| 2012 | 832 | 276 | (33.2) | 212 | 64 | (30.2) | 98 | (46.2) | 50 | (23.6) | 620 | 212 | (34.2) | 295 | (47.6) | 113 | (18.2) |
| 2011 | 944 | 347 | (36.8) | 241 | 89 | (36.9) | 102 | (42.3) | 50 | (20.7) | 703 | 258 | (36.7) | 315 | (44.8) | 130 | (18.5) |
| 2010 | 914 | 320 | (35.0) | 245 | 79 | (32.2) | 123 | (50.2) | 43 | (17.6) | 669 | 241 | (36.0) | 308 | (46.0) | 120 | (17.9) |
1Persons who were dead at diagnosis or died during therapy, and for whom TB or TB therapy was indicated as a cause of death.
2Six deaths were related to TB therapy in 2020.
3Year the case was counted, not the year the person died.
Note:
Data for all years are updated through July 8, 2023.