Reported Tuberculosis in the United States, 2022
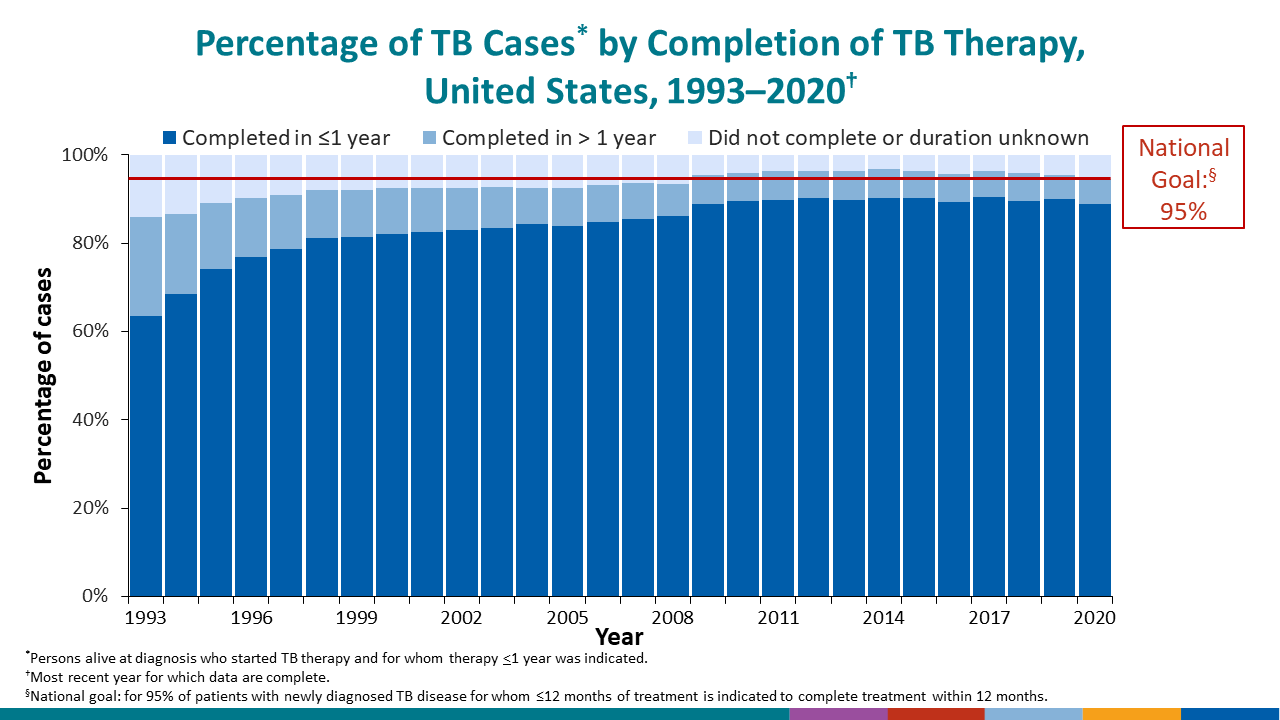
Table 16. Tuberculosis Cases and Percentages by Completion of Therapy: United States, 1993–2020
See surveillance slide #41.
| Year | Total cases1,2 | Completed therapy | Did not complete therapy3 | |||||||
|---|---|---|---|---|---|---|---|---|---|---|
| Total No. | ≤ 1 year | >1 year | Duration unknown | |||||||
| No. | (%) | No. | (%) | No. | (%) | No. | (%) | |||
| 2020 | 5,741 | 5,437 | 5,108 | (89.0) | 315 | (5.5) | 14 | (0.2) | 304 | (5.3) |
| 2019 | 7,174 | 6,862 | 6,463 | (90.1) | 384 | (5.4) | 15 | (0.2) | 312 | (4.3) |
| 2018 | 7,348 | 7,050 | 6,579 | (89.5) | 462 | (6.3) | 9 | (0.1) | 298 | (4.1) |
| 2017 | 7,394 | 7,134 | 6,689 | (90.5) | 430 | (5.8) | 15 | (0.2) | 260 | (3.5) |
| 2016 | 7,572 | 7,262 | 6,773 | (89.4) | 472 | (6.2) | 17 | (0.2) | 310 | (4.1) |
| 2015 | 7,853 | 7,580 | 7,085 | (90.2) | 490 | (6.2) | 5 | (0.1) | 273 | (3.5) |
| 2014 | 7,708 | 7,467 | 6,959 | (90.3) | 497 | (6.4) | 11 | (0.1) | 241 | (3.1) |
| 2013 | 7,741 | 7,461 | 6,959 | (89.9) | 493 | (6.4) | 9 | (0.1) | 280 | (3.6) |
| 2012 | 8,081 | 7,803 | 7,290 | (90.2) | 495 | (6.1) | 18 | (0.2) | 278 | (3.4) |
| 2011 | 8,461 | 8,165 | 7,592 | (89.7) | 569 | (6.7) | 4 | (0.0) | 296 | (3.5) |
| 2010 | 9,047 | 8,694 | 8,105 | (89.6) | 579 | (6.4) | 10 | (0.1) | 353 | (3.9) |
| 2009 | 9,491 | 9,074 | 8,431 | (88.8) | 632 | (6.7) | 11 | (0.1) | 417 | (4.4) |
| 2008 | 11,068 | 10,333 | 9,532 | (86.1) | 798 | (7.2) | 3 | (0.0) | 735 | (6.6) |
| 2007 | 11,408 | 10,696 | 9,747 | (85.4) | 947 | (8.3) | 2 | (0.0) | 712 | (6.2) |
| 2006 | 11,645 | 10,846 | 9,868 | (84.7) | 976 | (8.4) | 2 | (0.0) | 799 | (6.9) |
| 2005 | 11,945 | 11,045 | 10,029 | (84.0) | 1,015 | (8.5) | 1 | (0.0) | 900 | (7.5) |
| 2004 | 12,359 | 11,436 | 10,414 | (84.3) | 1,015 | (8.2) | 7 | (0.1) | 923 | (7.5) |
| 2003 | 12,644 | 11,723 | 10,563 | (83.5) | 1,155 | (9.1) | 5 | (0.0) | 921 | (7.3) |
| 2002 | 12,712 | 11,752 | 10,543 | (82.9) | 1,208 | (9.5) | 1 | (0.0) | 960 | (7.6) |
| 2001 | 13,513 | 12,521 | 11,141 | (82.4) | 1,374 | (10.2) | 6 | (0.0) | 992 | (7.3) |
| 2000 | 13,732 | 12,704 | 11,282 | (82.2) | 1,419 | (10.3) | 3 | (0.0) | 1,028 | (7.5) |
| 1999 | 14,660 | 13,508 | 11,931 | (81.4) | 1,575 | (10.7) | 2 | (0.0) | 1,152 | (7.9) |
| 1998 | 15,230 | 14,040 | 12,370 | (81.2) | 1,662 | (10.9) | 8 | (0.1) | 1,190 | (7.8) |
| 1997 | 16,326 | 14,861 | 12,849 | (78.7) | 1,998 | (12.2) | 14 | (0.1) | 1,465 | (9.0) |
| 1996 | 17,412 | 15,711 | 13,369 | (76.8) | 2,328 | (13.4) | 14 | (0.1) | 1,701 | (9.8) |
| 1995 | 18,454 | 16,461 | 13,671 | (74.1) | 2,775 | (15.0) | 15 | (0.1) | 1,993 | (10.8) |
| 1994 | 19,452 | 16,890 | 13,343 | (68.6) | 3,522 | (18.1) | 25 | (0.1) | 2,562 | (13.2) |
| 1993 | 19,899 | 17,115 | 12,621 | (63.4) | 4,476 | (22.5) | 18 | (0.1) | 2,784 | (14.0) |
1Persons for whom less than one year of therapy was indicated.
2Excludes patients who died within one year of initiating therapy; patients with an initial isolate resistant to rifampin; patients with bone and joint disease, meningeal disease, or disease of the central nervous system; or patients <15 years of age with miliary disease, positive blood culture, or a positive nucleic acid amplification test on a blood specimen. Beginning in 2011, patients who moved out of the country within one year of initiating therapy were also excluded.
3Includes persons for reason for stopping therapy was unknown.
Note:
Data for all years are updated through July 8, 2023.
Zero % (0.0) denotes <0.05%.
